J. Cent. South Univ. Technol. (2008) 15(s1): 229-233
DOI: 10.1007/s11771-008-352-9

Measuring system of high polymers’ pyromagnetic effect
ZHANG Yong-zhong(张永忠)1, LUO Ying-she(罗迎社)2, SU Jian-xin(粟建新)3,
MA Min-wei(马敏伟)2, YANG Zhan-yu(杨占宇)2, ZHANG Liang(张 亮)2
(1. College of Electronic and Information Engineering, Central South University of Forestry and Technology,
Changsha 410004, China;
2. Institute of Rheological Mechanics and Material Engineering, Central South University of Forestry and Technology,
Changsha 410004, China;
3. College of Information Engineering, Xiangtan University, Xiangtan 411105, China)
Abstract: The measurement system is the main equipment of the project. Based on the characteristic of experiment system, a sensor array is designed, and used to continually acquire the global magnetic field. A scientific scheme is developed to get the signal processing and temperature compensation for nondirective weak magnetic field. The software of sampling control system is given, which is complied using C language in Labwindows/CVI. Taking computer as main engine, the system can acquire the nondirective weak magnetic field automatically and continuously use the sensor array, the change of magnetic field can be shown in real-time and intuitively.
Key words: pyromagnetic effect; high polymer; global magnetic field; sensor array
1 Introduction
According to the fundamental research by YUAN et al[1-4], there is electro-magnetic field in destructing rheological bodies with defect. With the help of National Natural Science Fund, the measurement system was successfully developed by LUO et al[5-6] for several years, which can track peak points of pyromagnetic effect on destructing crack tip area. And the pyromagnetic effect was measured, which was produced in destructing material containing PVC defect. But this system can only measure the peak points of the pyromagnetic effect, and only gives the curve at the maximum when point changes along with time, breaking crack tip’s magnetic induction density belonging to rheological bodies with defect under general loading.
To research deeply the pyromagnetic effect of the breaking high polymer under general loading, pyromagnetic effect of high polymer is measured in global, and proved by experiment system. Using measuring technique by computer, the system was developed, which can acquire and analyse in global magnetic field. The system can automatically acquire the change of magnetic induction density by computer, in drawing rheological bodies with defect. It can also analyse the acquirement data using different methods.
2 Circuitry structure and signal processing
The test sample will produce a deformation band about 80 mm×80 mm in drawing (Fig.1). We need to accurately record and show the change of magnetic induction density in this field. The temperature of the sample will arise. To lower the temperature’s effect on the magnetic induction density, the sensor array only has a temperature compensation. It can accurately give the signal of magnetic induction density. After amplifying, filtering and other processing, the signal is given to DAQ card controlled by computer. After continually acquiring, the data are saved as file to hard disk of computer.
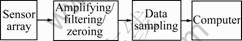
Fig.1 Chart of acquisition system in global magnetic filed
2.1 sensor signal processing
It is the key of this system. The SS495A1 sensor is used to acquire the magnetic induction density. Initially, the magnetic induction density of this system is lower than 1×10⁴ T. To make further quantitative measurement, the electric circuit of sensor is shown in Fig.2.

Fig.2 Circuit diagram of signal processing
In Fig.2, U2 and U3 are SS495A1. They are Hall sensors. Through an analog switch that is from eight channels selecting one, signal output from SS495A1 is given to U4 for amplifying. Sensor’s sensitivity is 31.25 V/T. The DAQ card’s precision is 12 bits, while input mode uses ±5 V, its resolution is 2.44 mV. If one wants to acquire directly the signal of sensor, the resolution of magnetic induction density should be about 7.8×10⁻⁵ T. Obviously, it is insufficient in this system. So U4 is used to amplify the signal from sensor about 43 times, and then the resolution of the system is about 182 T.
The resolution may meet the requirement.
2.2 Influence and processing of zero drift in signal
Based on sensor’s datasheet, its output signal is (0±0.075) V, while magnetic induction density is zero. Having been amplified 43 times, zero drift will reach as high as 3.225 V, and the whole electric circuit will come to the saturated condition. So U4 should adjust output signal to zero. An analogue voltage is sent out by the computer through the DA transformation. After being attenuated 10 times by R3 and R4, the signal is subtracted with signal from sensor. Zero drift is nearly eliminated. So the output can be adjusted to linearity range, while input signal is zero. As a result of the influence of the DA transformation’s resolution, the output is impossible to be adjusted to zero. While sampling, its residual is subtracted by computer. The detail is introduced in the software part.
2.3 Influence and treatment of temperature drift
According to datasheet of the SS495A1, the maximum of sensor’s temperature drift is ±0.04%/℃. In experiment, the temperature of test sample can highly arise to 40 ℃. So temperature drift will reach as high as 5×0.04%×40=0.08 V in out-port. This signal is amplified 43 times by U4. Its influence on measurement result is huge.
A sensor module is designed in this system, to reduce temperature signal. Through surveying temperature drift characteristic, 200 sensors that have the same batch, and two sensors that have the same temperature characteristics, are chosen to compose one pair, and they are installed back to back. The signal’s polarity of magnetic induction intensity produced by the pair sensors is opposite, but their temperature drifts are actually consistent. So after the two group signal subtraction, there is no influence of temperature on the output signal. The signal of magnetic induction density is two times greater than the original signal because the polarities are actually opposite.
2.4 Influence and disposal of drawing device’s clamping heads to measurement
The sensitivity of the measurement system is high, but drawing device’s clamping heads are always made of steel whose remanence is high. After lying aside in a period of time, they will produce some remanence. If the effective action of the remanence is not taken, the errors of measurement result will be high. The experiment proved that magnetic induction intensity―time curve of 200 mm long test sample was similar to that of the test sample without clamping heads. When the length is 550 mm, the effect of clamping heads can almost be ignored.
A sensor group is composed of 16 sensors that can measure the magnetic induction density of every point in a plane.
3 Design of software
LabWindows/CVI is promoted by American NI Corporation based on C language. It is the special-purpose development platform of hypothesized instrument, and it has been widespread application in the instrument and the industrial control domain. It’s the first choice in this topic.
According to the request of the system’s hardware, the procedure needs to provide the following functions: acquiring the magnetic induction intensity in real time, acquiring speed adjustability, automatic cutting over sensor channel when acquiring data, acquirement data showing as “magnetic induction intensity―time” curve, showing many acquirement data simultaneously by different contrast means, automatically zeroing the amplifying circuit, automatic recording and treating the zero error of every sensor when acquiring data. The surface of procedure is shown in Fig.3.
The data acquisition card PCI2306 is used to carry out A/D conversion for the analog signal. The sensor cutting switch is controlled by 16 channels digital out-port. Out-port of amplifier is connected with channel 0 of AD conversion, and the analog signal output by DAQ card is connected with amplifying circuit and zeroing-port.
Automatic calibration: Its function adjusts “zero spot” of each sensor, with the aim of making the amplifying circuit not enter the nonlinear zone with the zero drift of signal. The diagram of program is shown in Fig.4, each channel’s final DA value and the amplifier’s
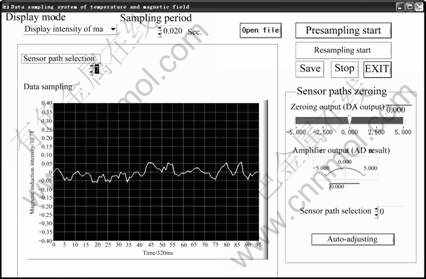
Fig.3 Main surface of control procedure
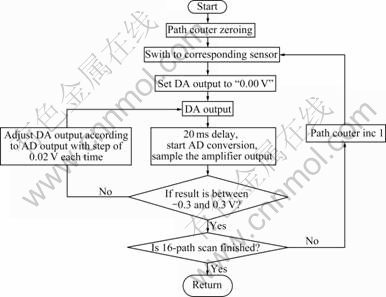
Fig.4 Diagram of automatic calibration program
output are saved as files ( they are saved as “set.set in this program ). When acquiring, a DA value by which sensor needs to adjust zero is sent by computer. And the signal of amplifier is sampled, then the sample subtracts the residual value of zero drift. The result is the sensor’s final output.
Pre-acquisition start: its function is to start the system to carry out the data acquisition by the normal speed and the procedure, and to draw up “the magnetic induction intensity―time curve” in real time. Because the working conditions of acquiring and automatic adjusting are not identical, this will cause the fact that the zero error elimination is not thorough while acquiring. To thoroughly eliminate residual value of zero drift in official acquiring time, the last frame data of this pre-acquisition are saved as zero error, and it is subtracted while acquiring. There is a timer. Timing time can be set through the sampling speed fence. It should be more than 20 ms in the windows operating system. The program shown in Fig 5 will run when timing over. The acquirement data are saved to an array.
Re-acquisition start: the flow of this program is the same as that in pre-acquisition. Only recomputed the zero error at the beginning of this program, and the pre-acquisition data are deleted. The data in array can be saved in hard-disk at the end.
Function to open file: it can open the saved data file and show “the magnetic induction intensity―time curve” in panel. For easily analysis, several files or spots can be contrasted simultaneously, and shown by different
colors. When acquiring data, 16 channels’ signals arrange in turn. It can easily be found that whether there is a bigger signal in experiment. Analyzing the relationship between each sensor’s signal and time is the main purpose while opening file. So the signal of each sensor should be shown alone. For observing easily, only one sensor’s signal is shown in the wave panel. But the channel number that needs to be shown can be set in “choose sensor channel number” (range from 0 to 15).
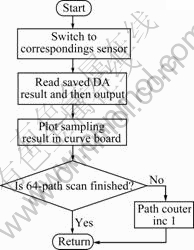
Fig.5 Diagram of data acquisition program
4 Result of experiment
The curves of several sensors signals are shown in Fig.6, which are got from one experiment. While
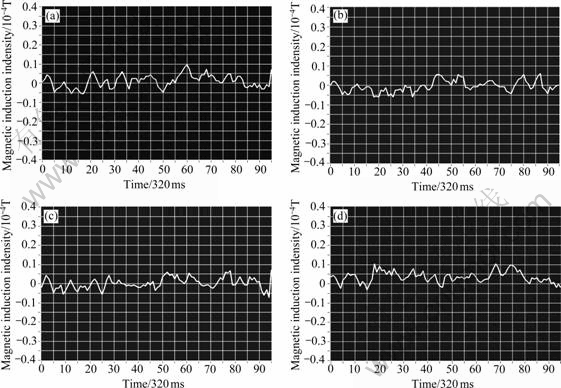
Fig.6 Figures of magnetic induction of different sensors: (a) Sensor 6; (b) Sensor 7; (c) Sensor 9; (d) Sensor 11
acquiring, a sensor is acquired every 20 ms, and it needs 320 ms to acquire one frame. In the chart, the horizontal coordinate is the sampling time, taking 320 ms as a time unit, the vertical coordinate is the magnetic induction intensity. We can see from the figure that there are several shapes like kyphosis (the back-face of tortoise) in the center-section of curve. This indicates that the magnetic induction intensity increases at the beginning, and gradually weakens with the test sample drawing break.
5 Conclusions
In this design scheme, the switch is used in the signal channel, and the speed of switching cannot be too quick because of the hardware of system. So acquisition data are not able to realize the true synchronization. The gain of amplifier is too high, so circuit’s noise is also large. It is difficult to quantitate. The experiment proves that the pyromagnetic effect phenomenon can be observed by this system while the destruction rate of high polymer is not high. In the next step work, circuitry’s performance should be enhanced, and the magnetic induction intensity should be measured quantitatively, the question about the temperature and the magnetic induction intensity acquired should be further studied, and the relationship between the temperature and the magnetic induction intensity while drawing should be researched.
References
[1] YUAN Long-wei. Rheology of bodies with defects [M]. Beijing: Nat Def Ind Press, 1994: 221-233. (in Chinese)
[2] YUAN Long-wei. Thermodynamic character and electromagnetic nature of the fracture process zone at crack tip in rheological material with defects [J]. Nat Sci J Xiangtan Univ, 1997, 19(3): 29-37. (in Chinese)
[3] YUAN Long-wei. The rupture theory and its application of rheological materials with defects [M]. Beijing: Science Press, 2001: 320-334, 494-521. (in Chinese)
[4] YUAN Long-wei. On the basic equation group in consideration of pyromagnetic effect for rheological material with defects [J]. Nat Sci J Xiangtan Univ, 2000, 22(3): 121-130. (in Chinese)
[5] LUO Ying-she, SU Jian-xin. The report for studying the pyromagnetic effect’s rule of breaking rheological bodies with defect [R]. Fundamental Mechanics and Materials Engineering of Xiangtan University, 2003. (in Chinese)
[6] LUO Ying-she, SU Jian-xin, DENG Xu-hua, CHEN Wei. Exploitation and applicating research on surveying system of pyromagnetic effect during rupture process of PVC sheet with defects [J]. Inter J of Applied Mechanics and Engineering, 2003, 8: 277-282.
[7] DataSheet: Solid State Hall Effect Sensors [M]. New Jersey: Honeywell Inc., 2002.
[8] LIU Jun-hua. Virtual instruments LabWindows/CVI with programming language [M]. Beijing: Electronics Industry Press, 2001. (in Chinese)
(Edited by CHEN Wei-ping)
Foundation item: Project(10672191)supported by the National Natural Science Foundation of China; Project(06JJ2059)supported by the Provincial Natural Science Foundation of Hunan, China; Project(KF0607) supported by the Key Laboratory of Low Dimensional Materials and Application Technology (Xiangtan University), Ministry of Education, China
Received date: 2008-06-25; Accepted date: 2008-08-05
Corresponding author: LUO Xing-she, Professor, PhD; Tel: +86-731-5623376; E-mail: lys0258@sina.com

