J. Cent. South Univ. Technol. (2011) 18: 48-55
DOI: 10.1007/s11771-011-0657-y

Real-solution stability diagrams for copper-ammonia-chloride-water system
Wang Xi(����)1, Chen Qi-yuan(����Ԫ)1, Yin Zhou-lan(������)1,
Hu Hui-ping(����Ƽ)1, Xiao Zhong-liang(Ф����)2
1. School of Chemistry and Chemical Engineering, Central South University, Changsha 410083, China;
2. Chemistry Department, Changsha University of Science and Technology, Changsha 410077, China
? Central South University Press and Springer-Verlag Berlin Heidelberg 2011
Abstract: A comprehensive thermodynamic model, which combined the Helgeson-Kirkham-Flowers (HKF) equation of state for standard-state thermodynamic properties of all species with realistic activity coefficient model developed by BROMLEY, was used to calculate the thermodynamic equilibrium, and a graphical method was developed to construct predominance existence diagrams (PED) for copper-ammonia-chloride in the presence of realistically modeled aqueous solutions. The existence of the different predominant chemical species for Cu(II) predicted by the diagrams was corroborated by spectrophotometrical studies and X-ray diffractometry. The simulated and experimental results indicate that the predominance of a given species in solution strongly depends on the pH value in this system. More quantitative information on real copper hydrometallurgy in the presence of ammonia and chloride can be obtained from these diagrams compared with the conventional predominance existence diagrams.
Key words: stability diagrams; copper; ammonia; chloride; thermodynamics; real solution
1 Introduction
Ammonia, as an effective lixiviant, has been widely used in a number of hydrometallurgical processes for nonferrous metal recovery (e.g., copper, cobalt and nickel). This is due to the fact that ammonia leaching offers more selectivity, less corrosion and lower reagent consumption for calcareous carbonate gangue. Extensive studies on the recovering copper from copper oxide and sulfide minerals by ammonia and ammonium salts leaching technology have been reported [1-3]. The use of NH4Cl in the process presents advantages over other ammonium salts. In some researches, chloride is considered: 1) a complexing agent for cuprous ions; 2) a surfactant that disperses the molten sulphur and thus removes the passivation of the mineral surface by elemental sulphur during pressure leaching [4]; and 3) a reagent that increases the surface area and the porosity of the insoluble product layer on the surface [5]. In addition, the chloride medium can improve the kinetics of the dissolution.
The dissolution and stabilization of copper in hydrometallurgical operations such as leaching and electrowinning require very high concentrations of ammonia and chloride. The accurate knowledge of the solution chemistry of the different species involved under such condition is essential to the prediction of the optimum operation conditions and the factors that affect the process.
The stability diagrams, as simple and visual expressions of thermodynamic data, have been widely accepted in several fields such as corrosion, geochemistry and hydrometallurgy. However, practical applications of currently available stability diagrams to hydrometallurgy systems are subjected to some inherent limitations. First, the classical stability diagrams have been constructed for arbitrarily assumed activities of dissolved species because of the difficulties in developing predictive activity coefficient models for multicomponent solutions. The absence of an activity coefficient model limits the accuracy of the diagrams to very dilute solutions. Another limitation is that the equilibrium reactions for all the species are not considered simultaneously. In fact, all species in solutions coexist and are in equilibrium. This situation becomes more severe for systems in the presence of ligands due to the formation of metal complexes.
Some Chinese metallurgists [6-7] proposed the simultaneous equilibrium computation technique to generate stability diagrams for metal-ligand systems, where all equilibria are taken into consideration at the same time. The potential-pH diagrams of Cu-NH3-H2O system were constructed [7-8]. The potential-lg[Cl-] diagrams at different temperatures [9] and potential-pH diagrams for Cu-Cl--H2O system [10] were illustrated.
The resulting diagrams present a stable region of solution, instead of regions of individual dissolved species besides the regions of different solid phases. All these made significant improvement on the thermodynamic tool. NILA et al [11] investigated the thermodynamics of Cu-NH4Cl-H2O system based on the concepts of generalized species and equilibrium. However, the non-ideality of the solution was not considered for these algorithms so that some errors may be produced inevitably for concentrated solution. A recent study on the speciation of copper in ammonia-chloride solutions was conducted using chemical equilibrium software MEDUSA [12]. Debye-H��ckel equation was used to calculate the activity coefficient for all aqueous species, but the activity coefficient model used is inadequate for computation concentrated solution system because it works just well at relatively low ionic strength (0.001 mol/kg? I ?0.1 mol/kg).
The objective of this work is to construct the stability diagrams for copper in the concentrated ammonia-chloride solution system, making it accurately predict and rationalize the copper hydrometallurgy process.
2 Thermodynamic model and construction of predominance existence diagrams
For realistic modeling of multicomponent, concentrated electrolyte systems, all species that may form in the system should be considered and both standard-sate properties and solution nonideality should be included, which is of utmost importance in thermodynamic equilibrium calculation for the treatment of such system. In a multicomponent system, each thermodynamic property is composed of two parts. For example, partial molar Gibbs free energy of the i-th species can be express by
 (1)
(1)
The first item is the standard state part which is only a function of temperature and pressure. The second one is the excess part which is a function of temperature and pressure as well as concentration, which accounts for the non-ideality of solution. The partial molar Gibbs free energy of the the i-th species is related to the molality (mi) by
 (2)
(2)
where ��i is the activity coefficient. Thus, thermodynamic properties of the system can be calculated if the standard state Gibbs energies of all species at the interesting temperature and pressure are available and the activity coefficients are known as the function of the molality of compositions and temperature.
2.1 Helgeson-Kirkham-Flowers (HKF) equation of state
HELGESON et al [13-15] found that the standard-state thermodynamic property of any species in water can be represented by a function with seven terms since 1968. The equations accurately represent the standard-state thermodynamic functions for aqueous, ionic, or neutral species as functions of both temperature and pressure. The HKF equation is based on the salvation theory and expresses the standard-state thermodynamic functions as sums of structure and salvation contribution, with the latter being dependent of solvent properties. The present range of applicability of the revised-HKF equations accurately represents the standard-state thermodynamic functions for aqueous, ionic, or neutral species as functions of T (up to 1 273 K) and p (up to 500 MPa) [16].
2.2 Activity coefficient model
An activity coefficient is a factor used in thermodynamics to account for deviations from ideal behaviour in a mixture of chemical substances. The activity coefficient model used for representing non-ideality in this study is an extended form of an expression developed by BROMLEY. In multicomponent system, the activity coefficient of the i-th ion is given by

 (3)
(3)
where A is Debye-H��ckel constant, which depends on temperature and solvent properties; I is ionic strength (I= 0.5��Zi2mi); N is the number of charges opposite to that of ion i; Zi and Zj are the numbers of charges on ion i and j, respectively; mi and mj are the molalities of ion i and j, respectively. Bij, Cij and Dij are empirical, temperature- dependent, cation-anion interaction parameters.
BROMLEY��s original formulation only contains one interaction parameter, B, which is sufficient for system with moderate ionic strength. For concentrated electrolyte solutions, the additional coefficients Cij and Dij usually become necessary. These parameters are obtained by regressing the experimental solubility and vapor-liquid equilibrium data. In the absence of experimental data, Bij can be estimated from contributions of individual ions.
2.3 Construction of predominance existence diagrams
Predominance existence diagram is important thermodynamic stability diagram. A predominance diagram shows the conditions of concentration and pH where a chemical species has the highest concentration in solutions in multiple acid-based equilibrium.
Determining the equilibrium concentration for each species requires the uses of automated computer-based solution algorithms. The comprehensive thermodynamic model mentioned above together with data bank is embedded in OLI-Systems software StreamAnalyzer 2.0. It is important that this software has a comprehensive data bank, which contains the standard-state thermodynamic properties and independent reaction sets for all species, HKFT equation of state parameters for aqueous species, and Redlich-Kwong-Soave equation of state parameters for gaseous species. The software also stores the parameters for ion-ion, ion-neutral and neutral-neutral interactions.
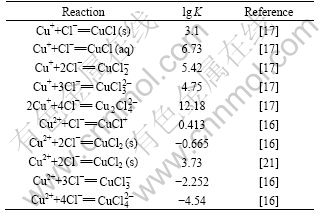
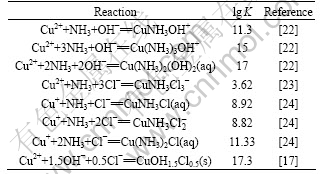
Some equilibrium constants for complex formation in an in-place database were updated and some that do not currently exist in the in-place database were taken from the critically selected stability constants published by the National Institute of Standards and Technology [17-20] and other literatures. Furthermore, these data were complemented with ESP formats databanks program and are presented in Tables 1-4.
Table 1 Selected values for Cu2+/Cu+-Cl- system at 298.15 K and 0.1 MPa
The procedures of thermodynamic equilibrium calculations include the following steps. First, the identities of compounds needed for constructing the predominance area diagram need to be specified, and the range of the reagent concentrations, temperature and pressure are used as input data. Second, once the thermodynamic conditions are specified, all possible combinations for ions, neutral complexes and solids are considered simultaneously. Chemical equilibrium equations and phase equilibrium equations are solved by using mass balance and electroneutrality equations. Equilibrium concentrations of all species are calculated as a function of the independent variable of interest through performing a simulated titration with reactants
Table 2 Selected values for Cu2+/Cu+-OH- system at 298.15 K and 0.1 MPa
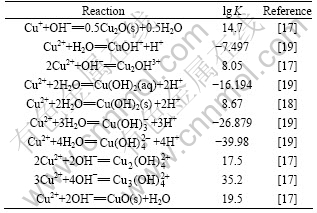
Table 3 Selected values for Cu2+/Cu+-NH3 system at 298.15 K and 0.1 MPa
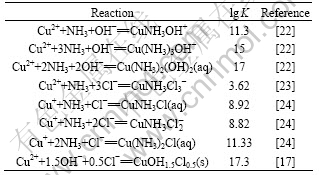
Table 4 Selected values for Cu2+/Cu+-NH3-OH--Cl- system at 298.15 K and 0.1 MPa
that are appropriate for varying the independent variable. The calculated equilibrium concentrations of all copper- containing species under different conditions are exported in an Excel worksheet.
Predominance existence diagrams are constructed by graphical method. The worksheet data files containing equilibrium concentration of all copper-containing species under different conditions are imported into Sigmaplot software first; then, three-dimensional (3D) concentration surface diagrams for all aqueous copper-containing species can be easily plotted on one diagram where X-axis and Y-axis are independent variables for pH and ions of interest, and Z-axis is the concentration of copper species. The surfaces that can be seen from the perspective of looking down, which presents the highest concentration of species in solutions, were projected onto XY plane. These projected surfaces represent the predominance existence area of the species. The intersecting line of the two surfaces represents the equal concentration of the two predominance species. When there are solid phases in desired system in equilibrium, a solid phase line should also be included in the predominance existence diagrams, which indicates the state of incipient precipitation of solids. In practice, the equilibrium point lies on the solid to aqueous species boundary when less than 0.25% of the input total concentration of ion of interest is found as a solid phase. The solid lines can be obtained by projecting the interesting lines of two surfaces. One is the concentration surface of solid phase and the other is that of the 0.25% input total copper concentration.
3 Experimental
All the solutions employed in this study were prepared using reagents of analytical quality and distilled water. All Cu(II) solutions were prepared using copper nitrate trihydrate (>99% purity). The pH was varied by adding sulfuric acid (H2SO4) and sodium hydroxide (NaOH) to the solution. UV-VIS spectrophotometric analysis of solutions was carried out using a UV-1800 spectrophotometer. The solid phases were characterized by X-ray diffraction (XRD) analysis using a Philips RigakuTM DMAX 2250VB+ diffractometer to determine the composition of the precipitates under different conditions.
4 Results and discussion
4.1 Predominance existence diagrams of system Cu(I)-NH3-Cl--H2O
In order to ascertain the formation of soluble and solid phases under different conditions for the Cu(I)-NH3-Cl--H2O system, predominance existence diagrams are constructed as a function of Cu(I), NH3+NH4+ and Cl- concentration versus pH, respectively. Variables like [Cu(I)], [NH3+NH4+] and [Cl-] are defined as total concentrations of dissolved species, which include these variables in the form of ion, molecule and metal-ion complex. These diagrams obtained show the predominance area of different aqueous species and stable area of solid phases. In all diagrams, the solid lines and the dashed lines correspond to the incipient precipitate solid phases. The interesting lines indicate that adjacent soluble species have the same concentration.
Figs.1(a), (b) and (c) show the predominance areas of different complexes and solid phases for �Clgm[Cl-], �Clg m[Cu(I)] and �Clg m[NH3+NH4+] as the function of pH, respectively. It is worth noting that some lines that

Fig.1 Predominance existence diagrams for Cu(I) system as function of pH: (a) -lg m[Cl-] (m[NH3+NH4+]=3 mol/kg, m[Cu(I)]=0.2 mol/kg); (b) -lg m[Cu(I)] (m[NH3+NH4+]= 3 mol/kg, m[Cl-]=3 mol/kg); (c) -lg m[NH3+NH4+] (m[Cl-]= 3 mol/kg, m[Cu(I)]=0.2 mol/kg)
separate two species indicating equal concentrate are curves rather than straight lines, which is quite different from conventional predominance existence diagrams. In the classical Pourbaix-type diagrams, each line represents the equilibrium between two chemical species for a given activity. Since the activity of dissolved species is assumed to be a priori, it is possible to derive analytical expressions for the equilibrium lines. Such expressions give pH values for the equilibrium between two species that express the concentration of species as a linear function of pH. In the real solution stability diagrams, activities of all species vary because of the changing amounts of input species. Activity coefficients are nonlinear functions of composition and may cause nonlinearities in the equilibrium lines.
It can be observed that in the acidic region (pH< ~6.63) dicopper(I) tetrachloride complex predominates as far as the chloride concentration is higher than ~0.20 mol/kg (-lg m[Cl-]<0.690 5) and Cu(I) complexes predominate for chloride concentration less than 0.20 mol/kg. For the neutral zone, there is an important variation of predominant copper species, which is strongly affected by changes in ammonia and chloride concentrations. An increase of pH causes a subsequent release of ammonia molecules from NH4+, and results in the formation of ternary copper complexes  and Cu(NH3)2Cl. Cu(NH3)2Cl2 exhibits a wide predominance in neutral-alkaline zone at the chloride concentration lower than 0.29 mol/kg (-lg m[Cl-]<0.537 6), while those species have been mentioned in Refs.[12, 24]. In these diagrams, the appearance of CuCl precipitates is observed in the acidic zone and Cu2O in the acidic and alkaline zone, whose pH value depends on -lg m[Cl-], while the two solids have been mentioned in Refs.[25-26] under those pH conditions.
Predominance area diagram does not mean that only one species exists in an area. Fig.2 illustrates the species distribution for Cu(I) in a solution containing total concentrations of 0.2 mol/kg Cu(I) and 3 mol/kg NH4Cl. The diagram shows that all copper species present as a function of pH. Such kind of diagram can show clearly the variation of species present under a given condition. It is clear that chloride complexes account for most of the total Cu(I) concentrations at pH value below 6 and Cu2Cl42- is the predominant species in this pH region, since its mole fraction is up to 84% at pH<4.7. As the pH value increases, ternary copper ammonia chloride complexes CuNH3Cl2- and Cu(NH3)2Cl become the predominant species. At pH>13.2, the formation of Cu2O(s) takes place.
4.2 Predominance existence diagrams of Cu(II)-NH3- Cl--H2O system
Figs.3(a), (b) and (c) illustrate the effects of Cl-,
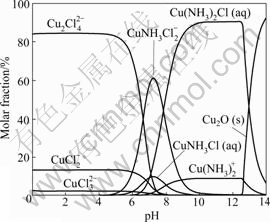
Fig.2 Species distribution diagram for Cu(I) in solution containing total concentrations of 0.2 mol/kg Cu(I) and 3 mol/kg NH4Cl
[NH3+NH4+] and Cu2+ concentration on the stability of copper species.
These diagrams show the zone that limits the predominance of soluble species and the existence of insoluble Cu(II). Cu(II) exists mainly in the form of copper aquocomplexes in the acidic zone pH<3.6. If the pH value is increased from about 3.6 to 13.2, copper ammonia complexes (Cu(NH3)n2+, n=1-5) become the predominant species. A mixed precipitate Cu(OH)1.5Cl0.5 is formed in the acidic-neutral zone. If the pH is increased further, the precipitation in the solution of blue hydroxide, Cu(OH)2, as well as black CuO, is noticed at pH=13.2.
Fig.3(a) shows the predominance existence diagram for different Cl- concentrations in the system of 0.2 mol/kg Cu(II) (corresponding to -lg m[Cu(I)]= 0.699) and 3 mol/kg [NH4++NH3] (corresponding to -lg m[NH3+NH4+]=-0.477). With the increase of the chloride concentration, there is a shrinkage of the pH interval in which the precipitate of CuO appears. For concentration of chloride greater than 3.21 mol/kg (-lg m[Cl-]=-0.51) and 8.41 mol/kg (-lg m[Cl-]= -0.924 8), Cu(II) dominates in solution as CuCl+ at pH<3.6 and  in the interval 3.2
Fig.3(b) presents the predominance existence diagram of -lg m[Cu(II)] versus pH, for Cu(II) in 3 mol/kg NH4Cl solutions. For concentration of copper <~0.18 mol/kg (-lg m[Cu(II)]=0.744 7), the predominant species in solution do not change with the concentration of Cu(II). For m[Cu(II)]>0.18 mol/kg, increasing the concentration of copper leads to widening of stability region of Cu(OH)1.5Cl0.5 and CuO, and makes the solubility of Cu(II) decrease.
Fig.3(c) shows the predominance existence diagram of -lg m[NH3+NH4+] versus pH for 0.2 mol/kg Cu(II) and
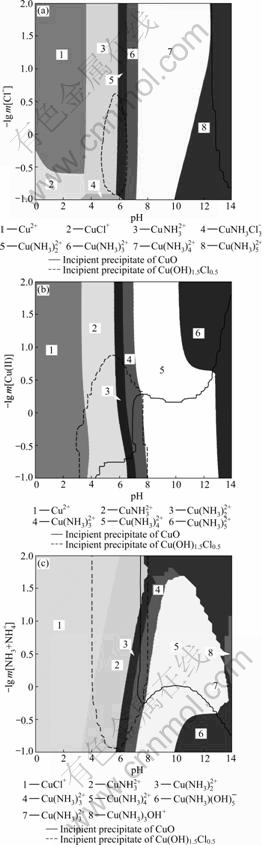
Fig.3 Predominance existence diagrams for Cu(II) system as function of pH: (a) -lg m[Cl-] (m[NH3+NH4+]=3 mol/kg, m[Cu(II)]=0.2 mol/kg); (b) -lg m[Cu(II)] (m[NH3+NH4+]= 3 mol/kg, m[Cl-]=3 mol/kg); (c) -lg m[NH3+NH4+] (m[Cl-]= 3 mol/kg, m[Cu(II)]=0.2 mol/kg)
3 mol/kg Cl-. For concentration of ammonia lower than 0.57 mol/kg (-lg m[NH3+NH4+]=0.244 1), variation of ammonia concentration does not change the distribution of predominance species. If the concentration of ammonia concentration is increased even more, the region of Cu(II) solubility widens and copper ammonia complexes become predominant species in the interval of 3.2
The species distribution diagrams for 0.2 mol/kg Cu(II) in 3 mol/kg NH4Cl solution is shown in Fig.4. It can be observed that, in the interval of 4.761.5Cl0.5 and pH>12.92 as CuO. For pH<3.8, the dominant species of total copper concentration is distributed mainly in three complexes (Cu2+, CuCl+, CuCl2(aq)) and their concentrations decrease slightly with pH increasing, because the ligand involved (Cl-) exchanges protons with ligand ammonia; in the interval of 6.29 and
and  and as they contain the ammonia ligand, their concentration depends on pH as NH3 does exchange protons.
Fig.5 shows the UV-VIS spectra for 0.02 mol/kg
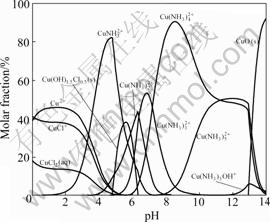
Fig.4 Species distributions diagram for 0.2 mol/kg Cu(II) in 3 mol/kg NH4Cl solution
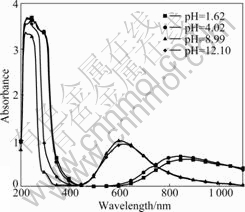
Fig.5 UV-VIS spectra of absorbance as function of wavelength for 0.02 mol/kg Cu(II) in 3 mol/kg NH4Cl at different pH values
Cu(II) solutions in 3 mol/kg NH4Cl at various pH values. It can be observed that two maxima appear at pH=1.62 and 4.02, whose absorbance does not vary with pH, indicating that predominant species does not contain ligands that exchange protons. There is only one absorption band in the UV region at approximately 250 nm, which is attributed to the appearance of CuCl+ and CuCl2 [27]. Another one at around 850 nm is associated with the species  [28]. A absorption band is observed between 500 and 700 nm and the maximum absorbance peak changes with pH. The maximum for these absorption bands are located at
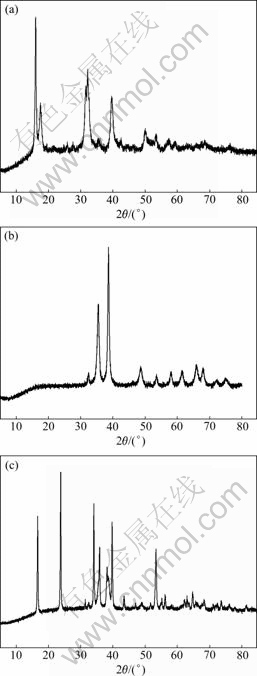
Fig.6 X-ray diffraction patterns for precipitates: (a) Cu(OH)1.5Cl0.5; (b) CuO; (c) Cu(OH)2
600 and 620 nm for pH 8.99 and 12.10, respectively. According to the Refs.[28-29], a maximum at 600 nm corresponds to the complex and 620 nm to which is in agreement with that indicated in Fig.4. Thus, the thermodynamic prediction is confirmed.
X-ray diffraction (XRD) analysis is used to characterize the solid phase that limits the solubility of copper. It is difficult to produce the necessary amount of Cu(I) precipitates to perform XRD analyses. Only Cu(II) species is characterized. When the pH of Cu(II) solution is adjusted between 4.76 and 6.29 (with the addition of NaOH), a green precipitate immediately forms. The XRD analysis of the solid is shown in Fig.6(a), where it can be observed that this corresponds to a solid with crystallography and chemical composition similar to atacamite (CuCl2��3Cu(OH)2). For pH>12.92, a blue precipitate appears in the solution and becomes black with time. The XRD spectra obtained for this solid fits the patterns of Cu(OH)2 and CuO (Figs.6(c) and 6(b)).
5 Conclusions
1) A comprehensive thermodynamic model for calculation of the thermodynamic equilibrium for system involving multiphases and concentrated solutions is described and used to calculate the multiphases equilibrium for copper in the high concentration of ammonia-chloride solutions.
2) A graphical method is proposed to construct the predominance existence diagrams for copper-ammonia- chloride-water system. These diagrams can accurately express the relations between aqueous species and solid phases. They are particularly useful for predicting the optimum chemical conditions and effects of various compounds that promote or inhibit copper extraction in the presence of ammonia and chloride.
3) The newly developed stability diagrams show that predominant species in solutions depends primarily on the pH in the system and the concentrations of Cu(I) or Cu(II). Total concentrations of ammonia and Cl- slightly affect the range of stable area of predominance species.
4) Cu(I) solubility limitation in ammonia and chloride media is caused by the formation of Cu2O at alkaline pH values and Cu(II) solubility is determined by the solubility of Cu(OH)1.5Cl0.5 in acidic conditions and CuO in alkaline pH.
References
[1] EKMEKYAPAR A, OYA R. Dissolution kinetics of an oxidized copper ore in ammonium chloride solution [J]. Chemical and Biochemical Engineering Quarterly, 2003, 17(4): 261-266.
[2] BINGOL D, CANBAZOGLU M, AYDOGAN S. Dissolution kinetics of malachite in ammonia/ammonium carbonate leaching [J]. Hydrometallurgy, 2005, 76(1/2): 55-62.
[3] YARTASI A, COPUR M. Dissolution kinetics of copper(II) oxide in ammonium chloride solutions [J]. Minerals Engineering, 1996, 9(6): 693-698.
[4] MCDONALD R G, MUIR D M. Pressure oxidation leaching of chalcopyrite (Part II): Comparison of medium temperature kinetics and products and effect of chloride ion [J]. Hydrometallurgy, 2007, 86(3/4): 206-220.
[5] LU Z Y, JEFFREY M I, LAWSON F. The effect of chloride ions on the dissolution of chalcopyrite in acidic solutions [J]. Hydrometallurgy, 2000, 56(2): 189-202.
[6] TANG Yue-fei. Potential-pH relationship in the complex system [J]. Nonferrous Metals, 1979(2): 28-30. (in Chinese)
[7] FU Chong-yue, ZHENG Di-ji. Thermodynamic study on the system Cu-NH3-H2O complexes [J]. Journal of Central South Institute of Mining and Metallurgy, 1979(1): 27-37. (in Chinese)
[8] LUO Ru-tie. Overall equilibrium diagrams for hydrometallurgical systems: Copper-ammonia-water system [J]. Hydrometallurgy, 1987, 17(2): 177-199.
[9] LI Hao-yue, ZHENG Di-ji, FU Chong-yue. Equilibrium study of the Cu-Cl-H2O system [J]. Journal of Central South Institute of Mining and Metallurgy, 1982(3): 39-45. (in Chinese)
[10] FU Chong-yue, ZHENG Di-ji. Thermodynamic analysis on the Cu-Cl-H2O system and its potential-pH diagrams [J]. Journal of Central South Institute of Mining and Metallurgy, 1980(3): 12-23. (in Chinese)
[11] NILA C, GONZ LEZ I. Thermodynamics of Cu-H2SO4-Cl--H2O and Cu-NH4Cl-H2O based on predominance-existence diagrams and Pourbaix-type diagrams [J]. Hydrometallurgy, 1996, 42(1): 63-82.
[12] VAZQUEZ-ARENAS J, LAZARO I, CRUZ R. Electrochemical study of binary and ternary copper complexes in ammonia-chloride medium [J]. Electrochimica Acta, 2007, 52(20): 6106-6117.
[13] HELGESON H C, KIRKHAM D H. Theoretical prediction of the thermodynamic behavior of aqueous electrolytes at high pressures and temperatures: I. Summary of the thermodynamic/electrostatic properties of the solvent [J]. American Journal of Science, 1974, 274: 1089-1199.
[14] HELGESON H C, KIRKHAM D H, FLOWERS G C. Theoretical prediction of the thermodynamic behavior of aqueous electrolytes at high pressures and temperatures (IV): Calculation of activity coefficients, osmotic coefficients, and apparent molal and standard and relative partial molal properties to 600 oC and 5 kb [J]. American Journal of Science, 1981, 281: 1249-1516.
[15] TANGER J C, HELGESON H C. Calculation of the thermodynamic and transport properties of aqueous species at high pressures and temperatures: Revised equations of state for standard partial molal properties of ions and electrolytes [J]. American Journal of Science, 1988, 288(1): 19-98.
[16] SVERJENSKY D A, SHOCK E L, HELGESON H C. Prediction of the thermodynamic properties of aqueous metal complexes to 1 000 oC and 5 kb [J]. Geochim Cosmo Acta, 1997, 61(7): 1359-1412.
[17] MARTELL A E, SMITH R M. NIST standard reference database 46, Version 7.0 [M]. Gaithersburg, USA: NIST, 2003.
[18] SMITH R M, MARTELL A E. NIST Critical stability constants of metal complexes database, Ver. 5.0 [M]. Gaithersburg, MD, USA: NIST, 1998: 643-652.
[19] SMITH R M, MARTELL A E. NIST critically selected stability constants of metal complexes database, Version 3.0 [M]. Gaithersburg, MD, USA: NIST, 1997: 246-264.
[20] SMITH R M, MARTELL A E. Critical stability constants [M]. New York and London: Plenum Press, 1976: 257-286.
[21] BALL J W, NORDSTROM D K. User��s manual for WATEQ4F, with revised thermodynamic data base and test cases for calculating speciation of major, trace, and redox elements in natural waters, USGS-OFR-91-183 [R]. U.S. Geological Survey, Menlo Park, California.
[22] GUbeli A O, HEbert J, COtE P A, TAILLON R. The action of the simple and mixed complex-species of copper(II) with hydroxide and ammonia as ligands [J]. Helvetica Chimica Acta, 1970, 53: 186-197. (in French)
[23] LIMPO J L, LUIS A, CRISTINA M C. Solubility of cupric chloride in ammoniacal ammonium chloride solutions [J]. Rev Metal Madrid, 1993, 29: 27-35.
[24] SOLIS J S, HEFTER G, MAY P M. Chemical speciation in the copper(I)-ammonia-chloride system [J]. Australian Journal of Chemistry, 1995, 48: 1283-1292
[25] STANKOVIC Z D. The effect of Cl(I) ions on kinetics and mechanism of anodic dissolution and cathodic deposition of copper [J]. Electrochimica Acta, 1984, 29(3): 407-409.
[26] GORBUNOVA I V, LYAMINA L I, GORBUNOVA K M. Some kinetics on cathodic solid-phase reduction of copper(I) oxide [J]. Soviet Electrochemistry, 1987, 23: 1027-1033.
[27] KHAN M A, SCHWING-WEILL M J. Stability and electronic spectra of the copper(II) chloride complexes in aqueous solutions [J]. Inorganic Chemistry, 1976, 15(9): 2202-2205.
[28] LEVER A B P. Inorganic electronic spectroscopy [M]. Amsterdam: Elsevier, 1984: 554-572.
[29] BJERRUM J, BALLHAUSEN C J, JORGENSEN C K. Studies on absorption spectra (I): Results of calculations on the spectra and configuration of copper(II) ions [J]. Acta Chemica Scandinavica, 1954, 8: 1275-1289.
(Edited by YANG Bing)
Foundation item: Project(2007CB613601) supported by the National Basic Research Program of China
Received date: 2009-11-12; Accepted date: 2010-03-03
Corresponding author: CHEN Qi-yuan, Professor, PhD; Tel: +86-731-88877364; E-mail: nano-sun@hotmail.com

