
Residual strains of aluminum alloy characterized by nanoindentation
WANG Yan-shen(������)1, 2, QU Shi-liang(��ʿ��)3, GAI Yu-xian(������)2,
DONG Shen(�� ��)4, LIANG Ying-chun(��ӭ��)4
1. Department of Physics, Harbin Institute of Technology, Harbin 150001, China;
2. School of Naval Architecture, Harbin Institute of Technology at Weihai, Weihai 264209, China;
3. Department of Optoelectronic Science, Harbin Institute of Technology at Weihai, Weihai 264209, China;
4. Center for Precision Engineering, Harbin Institute of Technology, Harbin 150001, China
Received 10 August 2009; accepted 15 September 2009
Abstract: A formula was brought forward to correlate residual strain with hardness measured by nanoindentation method. Using the formula, residual strains in prestrained aluminum alloy samples were evaluated. In order to compare with the calculated strain, such values were also measured by strain gauge method. The results show that the differences of the residual strain obtained by nanoindentation and strain gauge method are not more than 8%, which shows that the formula is suitable for characterizing residual strain of aluminum alloy.
Key words: aluminum alloy; residual strain; nanoindentation; hardness; strain gauge
1 Introduction
Aluminum alloy is a kind of widely used material which has high plasticity. Compressed or stretched loads may bring residual strain in aluminum alloy. When the amount of such loads and the range of affected area are very small, residual strains aroused by loads are not only very small but also in a very confined area, which brought about difficulties for measurement.
X-ray diffraction (XRD)[1], Raman spectroscopy[2] and nanoindentation[3] are three conventional methods to measure preciously residual stress and strain in small sized area. Residual stress and strain acquired by XRD are mean values in the X-ray penetration depth. Since the penetration depth of X-rays varies with its wavelength, different values will be obtained by different XRD equipments for one sample. The penetration depth of the laser beam used in Raman spectroscopy is in micron magnitude. Consequently, the residual stress and strain measured by Raman spectroscopy are also mean value in its penetration depth. Furthermore, the shift of Raman spectral line contains the information of residual stress and crystallizing information. It��s very hard to distinguish residual stress and strain from crystallizing information. Compared with the above methods, nanoindentation is a good method for characterizing residual stress and strain with large gradient distributed in a very confined area.
In 1996, TSUI[4] applied nanoindentation in the measurement of residual stress during the study of the influence of applied loads on aluminum alloy. Since then, many researchers have done a lot of researches on measurement of residual stress and strain using nanoindentation[3, 5-14]. According to the researches of CAO et al[15-16], elastic modulus is affected by not plastic residual strain but residual stress. And, hardness is influenced by not residual stress but plastic residual strain. In this work, nanoindentation was utilized to preciously measure residual strain on the surface of aluminum alloy. The modulus and hardness used in this work were the values measured by nanoindentation instead of the real values in theory. A formula was brought forward to correlate residual strains with hardness measured by nanoindentation method. Using the formula, the residual strains in prestrained aluminum alloy samples were evaluated.
2 Mathematical method
CARLSSON and LARSSON[6] defined the ratio of real contact area to nominal contact area as area ratio c2
in the study of nanoindentation (Eq.(1)).
 (1)
(1)
where A and Anom are the real and the nominal contact areas of nanoindentation, respectively; hc and hmax are contact depth and the maximum indentation depth correspondingly.
According to simulations and experiments, CARLSSON and LARSSON discovered that c2 is the function of residual stress and strain[5-6]. In most case, plastic residual strain exists accompanied with residual stress. They can both influence the value of area ratio. Here, area ratio can be considered the complex of the component only influenced by residual stress  and the component only influenced by plastic residual strain
  . Correspondingly, the area ratio that consists of the two components is marked as
  , and the area ratio of the virgin material without stress and strain is marked as
  . Residual stress can be achieved from the differences between
  and . While, the differences between and can also provide the possibility for characterizing plastic residual strain in samples.
2.1 Plastic residual strain calculated from area ratio
According to the simulation and experimental study of samples with equal biaxial residual strain, CARLSSON and LARSSON[6] gave the equation that correlated plastic residual strain with the area ratio only contains plastic residual strain, which is shown as Eq.(2).
 (2)
(2)
where ��p is the equal biaxial residual strain in samples. Eq.(2) can be easily transformed into Eq.(3), which can be used to directly achieve plastic residual strain from area ratios of samples with and without strain.
 (3)
(3)
In Eq.(3), the sign of plastic residual strain is consistent with the stretch or compress state. Whatever the sign is positive or negative, the inequality �� is always tenable. can be easily got from the origin unstrained sample. corresponds the state that has only plastic residual strain. Such state is a supposed condition for the convenience of strain analysis in the simulation study of CARLSSON and LARSSON[5] and is difficult to be acquired in practical research. As a result, is difficult to be obtained.
In the following, parameters got from the virgin material and samples with residual stress and strain will be utilized to replace in Eq.(3), which facilitates the calculation of plastic residual strain.
2.2 Plastic residual strain calculated from hardness
Plastic residual strain in samples can influence the contact depth measured in nanoindentation. Hence, hardness tested by nanoindentation varied with plastic residual strain. Thus, the measured hardness can be used to describe plastic residual strain. Based on Eq.(2) brought forward by CARLSSON, a formula was deduced to correlate plastic residual strain with hardness measured by nanoindentation.
Similar to the symbol style of area ratio,  and
and  are the reduced moduli of the virgin material and the sample with residual stress and plastic residual strain, respectively;
  represents the reduced modulus of the sample that has residual stress;
  is the reduced modulus of the sample that has only plastic residual strain; and correspond to two supposed states which are hardly coexisted in practice. They were induced for the convenience of strain analysis. In this work, symbols of hardness H and contact area A with the same subscripts as the above reduced modulus had similar meanings.
A formula was deduced to express reduced modulus by hardness, contact area and indentation depth in Ref.[15] as follows:
 (4)
(4)
where E* is the reduced modulus which contains the modulus information of the indenter and the sample; H is the hardness of the sample; �� and �� are tip shape constant and correction factor, respectively. For ideal Berkovich tips, the contact area is
 (5)
(5)
Substituting Eq.(5) into Eq.(4) yields
 (6)
(6)
According to Eq.(6), can be expressed as
 (7)
(7)
Since reduced modulus is not affected by the plastic residual strain and hardness does not vary with the state of residual stress, whatever the state of plastic residual strain is, reduced modulus in samples with the same residual stress always keeps invariant, i.e.  , and hardness in samples with the same residual strain always does not change, i.e.
  . Then, Eq.(7) is turned into
 (8)
(8)
According to Eq.(8),
 (9)
(9)
From Eq.(9), the square-root area ratio can be acquired as follows:
 (10)
(10)
Substituting Eq.(10) into Eq.(3) yields
 (11)
(11)
For a determined sample, and are constant and can be achieved from the virgin material of the sample. The two parameters �� and �� are also constant in nanoindentation experiments. The hardness  is the only variable in Eq.(11), and it can be got directly from nanoindentation.
Following the calculating steps of  , the square- root area ratio of the virgin material can be obtained.
 (12)
(12)
where H0 is hardness of the virgin material, and �� is always tenable. According to Eq.(10) and Eq.(12),  is always smaller than H0. So, Eq.(11) is only suitable for ��H0. When ��H0, the plastic residual strain in the sample is in compress state. Under this condition, relative pile-ups will appear around the indents, which is not suitable for the application of Hertz theory and Oliver-Pharr method[17]. Therefore, Eq.(11) is not tenable when ��H0.
Through the study of CARLSSON and LARSSON, the area ratio measured by nanoindentation is hardly changed when the plastic residual strains have the same absolute values[5]. Thus, in this work, for the samples with the same absolute values of plastic residual strain, the absolute values of differences in hardness between stretched and virgin samples equal those between compressed and virgin samples. Then, Eq.(11) can be revised as where ��p is the plastic residual strain in the sample; H is hardness of the virgin material; and is the hardness of the sample with residual stress and plastic residual strain, which is the only variable in the formula.
 (13)
(13)
From Eq.(13), ��p is only the function of . Thus, it can be extracted from hardness measured in nanoindentation. When ��H0, the strain is stretched and the sign of ��p is positive. When ��H0, the strain is compressive and the sign of ��p is negative. When =H0, ��p=0.
In Carlsson��s equation (Eq.(2)), the sign of ��p can not be determined directly. While in Eq.(13) deduced in this work, such sign for ��p can be determined by relative value between the hardness of the virgin material and samples with residual stress and strain.
3 Experimental
3.1 Residual strain measured by strain gauges
The samples were two aluminum alloy bulks with size of 15 mm��15 mm��3.5 mm and 165 mm��16 mm��4.6 mm, respectively. They were machined to be mirror surface on one side through ultra-precision diamond turning, and their roughness Ra values were 3.76 nm and 5.68 nm, correspondingly. Aging treatment was employed on samples before load experiments.
The samples were compressed and stretched by load instrument (Zwick Z100), which will result in prominent strain. Strain gauges were glued on the mirror surface, so as to test residual strain on the surface after the load process. In the process, strain of the strain gauges varied with the strain state in the sample, and the strain measured by the gauges was the mean residual strain of the tested area when the load process finished. The residual stains of the compressed and stretched samples measured by strain gauge method were -1.63��10-3 and 3.79��10-3, respectively.
3.2 Residual strain measured by nanoindentation
Nanomechanical properties such as hardness in the areas on the mirror surface of the compressed and stretched samples were both measured by a commercial nanomechanical test system (TriboIndenter, Hysitron Inc.).
Five experiment positions in the origin sample without stress and strain were randomly selected for nanoindentation testing. The fluctuations of reduced modulus and hardness in such positions are very small. So, reduced modulus and hardness of the origin unstressed sample can take the average values of the five groups. Accordingly, the reduced modulus and the hardness H0 are 56.27 GPa and 809.80 MPa correspondingly. According to Eq.(1), c0 can be calculated by the contact depth and the maximum indentation depth of the origin unstressed sample, which were got from the indentation data of sample C. Here, the square-root area ratio of the unstressed sample c0 is 0.955. In this research, a diamond Berkovich tip was used in nanoindentation experiments, so �� and �� take 0.75 and 1, respectively.
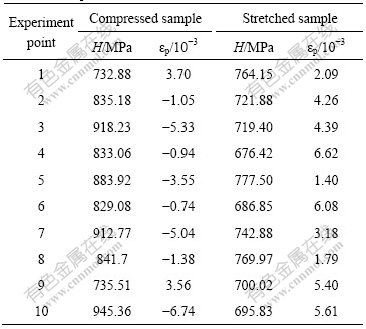
Ten experiment points were randomly selected on each of the two strained samples. Using Eq.(13), residual strain in such area on the mirror surface was calculated through the acquired hardness data. Table 1 shows the hardness and plastic residual strain of the compressed and stretched samples.
As is shown in Table 1, the plastic residual strain of the compressed sample is from -6.74��10-3 to 3.70�� 10-3, and that of the stretched sample ranges from 1.4�� 10-3 to 6.62��10-3. Their mean values are -1.75��10-3 and 4.08��10-3, respectively. The plastic residual strain characterized by nanoindentation method is discrete. The inhomogeneous distribution of strain and the increase of surface roughness caused by the strain may be responsible for such phenomenon. The discrete data in Table 1, to some extent, reflect the real plastic residual strain in the corresponding area. It also indicates that nanoindentation has high space resolution in the measurement of plastic residual strain, which is suitable for characterizing samples with large plastic strain gradient in small sphere.
Table 1 Hardness and plastic residual strain of compressed and stretched samples
3.3 Discussion
Residual strain measured by many methods is always the sum of the plastic and elastic components. It��s very hard to distinguish the plastic component from the total residual strain. Commonly, the plastic component of residual strain is rather larger than the elastic one, especially when samples are plastically deformed prominently. For convenience, plastic residual strain can be used to approximately substitute residual strain.
By comparing residual strain obtained through nanoindentation with that achieved by strain gauge method, their differences are 7.36% for the compressed sample and 7.65% for the stretched sample, which is caused by the deviations between plastic residual strain and the total residual strain, and the increase of surface roughness resulted from strain. In general, the error of plastic residual strain measured by nanoindentation method is small. Therefore, the accuracy of Eq.(13) is acceptable and is suitable for characterizing residual strains from nanoindentation.
4 Conclusions
1) A formula correlating residual strain of aluminum alloy with hardness measured by nanoindentation is brought forward.
2) The residual stains of the compressed and stretched aluminum alloy bulks samples measured by strain gauge method are -1.63��10-3 and 3.79��10-3 correspondingly.
3) The mean plastic residual strains of the compressed and the stretched aluminum alloy bulks samples are -1.75��10-3 and 4.08��10-3, respectively.
4) By comparing the residual strain obtained through nanoindentation with that achieved by strain gauge method, their differences are not more than 8%, which shows that the formula is suitable for characterizing residual strains of aluminum alloy.
Acknowledgments
We extend our sincere thanks to Prof. ZHANG Shao-shi, Prof. FAN Jiu-ming, Prof. ZHAO Shu-shan and other staffs in School of Astronautics, Harbin Institute of Technology.
References
[1] GELFI M, BONTEMPI E, ROBERTI R, ARMELAO L, DEPERO L E. Residual stress analysis of thin films and coatings through XRD experiments [J]. Thin Solid Films, 2004, 450(1): 143-147.
[2] KOUTEVA-ARGUIROVA S, SEIFERT W, KITTLER M, REIF J. Raman measurement of stress distribution in multicrystalline silicon materials [J]. Materials Science and Engineering B, 2003, 102(1/3): 37-42.
[3] SURESH S, GIANNAKOPOULOS A E. A new method for estimating residual stresses by instrumented sharp indentation [J]. Acta Materialia, 1998, 46(16): 5755-5767.
[4] TSUI T Y, OLIVER W C, PHARR G M. Influences of stress on the measurement of mechanical properties using nanoindentation: Part ��. Experimental studies in an aluminum alloy [J]. Journal of Materials Research, 1996, 11(3): 752-759.
[5] CARLSSON S, LARSSON P L. On the determination of residual stress and strain fields by sharp indentation testing. Part I: theoretical and numerical analysis [J]. Acta Materialia, 2001, 49(12): 2179-2191.
[6] CARLSSON S, LARSSON P L. On the determination of residual stress and strain fields by sharp indentation testing. Part ��: Experimental investigation [J]. Acta Materialia, 2001, 49(12): 2193-2203.
[7] SWADENER J G, TALJAT B, PHARR G M. Measurement of residual stress by load and depth sensing indentation with spherical indenters [J]. J Mater Res, 2001, 16(7): 2091-2102.
[8] PHARR G M, BOLSHAKOV A. Understanding nanoindentation unloading curves [J]. J Mater Res, 2002, 17(10): 2660-2671.
[9] LEE Y H, KWON D. Residual stresses in DLC/Si and Au/Si systems: Application of a stress-relaxation model to the nanoindentation technique [J]. J Mater Res, 2002, 17(4): 901-906.
[10] LEE Y H, KWON D. Measurement of residual-stress effect by nanoindentation on elastically strained (100) W [J]. Scripta Materialia, 2003, 49(5): 459-465.
[11] KESE K O, LI Z C, BERGMAN B. Influence of residual stress on elastic modulus and hardness of soda-lime glass measured by nanoindentation [J]. J Mater Res, 2004, 19(10): 3109-3119.
[12] KESE K, TEHLER M, BERGMAN B. Contact residual stress relaxation in soda-lime glass. Part ��. Measurement using nanoindentation [J]. Journal of the European Ceramic Society, 2006, 26(6): 1003-1011.
[13] XU Z H, LI X D. Influence of equi-blaxial residual stress on unloading behaviour of nanoindentation [J]. Acta Materialia, 2005, 53(7): 1913-1919.
[14] QASMI M, DELOBELLE P, RICHARD F, BOSSEBOEUF A. Effect of the residual stress on the determination through nanoindentation technique of the Young��s modulus of W thin film deposit on SiO2/Si substrate [J]. Surface & Coatings Technology, 2006, 200(14/15): 4185-4194.
[15] CAO Y Z, WANG Y S, DONG S, YANG Y Q, LIANG Y C, SUN T. Residual stresses around femtosecond laser ablated grooves in silicon wafer evaluated by nanoindentation [C]// Proc SPIE, Bellingham, 2007, 6724: 672417.
[16] DONG S, WANG Y S, YANG Y Q, LIANG Y C, SUN T, WANG Y H, ZHENG Z R. Residual strain measurement of femtosecond laser microexploded glass by nanoindentation [J]. Key Engineering Materials, 2008, 364(1): 205-209.
[17] OLIVER W C, PHARR G M. An improved technique for determining hardness and elastic modulus using load and displacement sensing indentation experiments [J]. J Mater Res, 1992, 7(6): 1564-1583.
(Edited by ZHAO Jun)
Foundation item: Project(20080440876) supported by China Postdoctoral Science Foundation; Project(HIT(WH)XB200805) supported by Science Foundation of Harbin Institute of Technology at Weihai
Corresponding author: WANG Yan-shen; Tel: +86-631-5687930; E-mail: wangyanshen@sina.com

