Dye tracer infiltration technique to investigate macropore flow paths in Maka Mountain, Yunnan Province, China
��Դ�ڿ������ϴ�ѧѧ��(Ӣ�İ�)2016���8��
�������ߣ��ż��� ������
����ҳ�룺2101 - 2109
Key words��landslides; macropores; plant; root systems; organic matter; stone
Abstract: In order to investigate the differences of macropores vertical distribution under different surface plants, and to assess the influences of root systems, organic matter and texture on macropore flow paths, two dye tracer infiltration experiments were performed in slopes under two different plants (Campylotropis polyantha (Franch.) Schindl vs. Cynodon dactylon (Linn.) Pers). Dye tracer infiltration experiments with field observations and measurements of soil properties were combined. Results show that the discrepancy in macropores distribution between two slopes under different plants is significant. Root systems have significant effects on macropore flow paths distribution and the effect become more pronounced as the diameter of roots become larger. Organic matter and stone are important factors to affect macropores distribution. Root-soil interface, inter-aggregate macropore and stone-soil interface are important macropore flow paths in well vegetated slopes.
J. Cent. South Univ. (2016) 23: 2101-2109
DOI: 10.1007/s11771-016-3266-y

ZHANG Jia-ming(�ż���), XU Ze-min(������)
Faculty of Civil Engineering and Mechanics, Kunming University of Science and Technology, Kunming 650500, China
 Central South University Press and Springer-Verlag Berlin Heidelberg 2016
Abstract: In order to investigate the differences of macropores vertical distribution under different surface plants, and to assess the influences of root systems, organic matter and texture on macropore flow paths, two dye tracer infiltration experiments were performed in slopes under two different plants (Campylotropis polyantha (Franch.) Schindl vs. Cynodon dactylon (Linn.) Pers). Dye tracer infiltration experiments with field observations and measurements of soil properties were combined. Results show that the discrepancy in macropores distribution between two slopes under different plants is significant. Root systems have significant effects on macropore flow paths distribution and the effect become more pronounced as the diameter of roots become larger. Organic matter and stone are important factors to affect macropores distribution. Root-soil interface, inter-aggregate macropore and stone-soil interface are important macropore flow paths in well vegetated slopes.
Key words: landslides; macropores; plant; root systems; organic matter; stone
1 Introduction
Landslides are a ubiquitous phenomenon in mountainous regions. They may cause severe damage and have been studied as part of the Unesco��s Earth Science Programme for several decades. Landslides might arise from human activity like road construction or earthquake or precipitation. In humid climates, landslides are a common phenomenon frequently occurring in well vegetated slopes. These landslides are mainly initiated by the combination of steep relief and long-lasting intensive rainfalls [1-2].
For rainfall-induced landslides, hydrological conditions in the soil like soil moisture distribution are crucial [3]. Water flow in soils as well as the distribution of flow path influences the soil moisture. Two rather different flow types can be distinguished: water can percolate slowly through the soil matrix (matrix flow) or move rapidly through macropore networks and bypass a large portion of the soil (macropore flow). Macropore flow is a common process in well vegetated slopes [4-5] and dominates the hydrological regime and affects slope stability, especially in steep forest watersheds in humid climates [6-7]. Once the capacity of macropore flow paths is exceeded it is believed that they contribute to high pore water pressures in the surrounding soils, contributing to a high landslide initiation potential [6].
In general, direct measurements of macropores distribution are difficult. Dye tracer such as methylene blue is believed to be a better proxy for movement of large organic molecules [4]. Methylene blue dye, therefore, has limited capacity to serve as tracer of matrix water flow in soil matrix, as it exhibits strong retardation and moves slower than water [4, 8]. Therefore, dyes are often used in tracer experiments to visualize macropore networks. A number of studies of dye-stained macropore flow paths have been published in the literature [8-10]. BOUMA was among the first to use dyes to visualize macropore flow paths in field soils [10]. Dye tracer infiltration technique, combined with digital image processing methods, has many advantages. It is relatively fast and the cost is low. Measurement can be easily performed directly in the field, without taking samples for laboratory analysis. Tracers allow macropore flow paths to be both visualised and quantified at different scales of observation. Moreover, the observed macropores from dye tracer infiltration technique do not include all the macropores but identify only those pores that are connected with infiltration surface: the continuous pores. These continuous macropores are especially relevant to macropore flow.
Until recently, most studies of this type have been conducted at well vegetated slopes. However, these works mostly concentrated on the vertical or horizontal distribution patterns of macropores. For instance, Nobles applied qualitative image analysis to study the impacts of landscape position (riser, tread, floodplain and upland summit) on the vertical distribution patterns of macropore flow paths in caliche soils in Central Texas Hill Country [4]. The vertical distribution of macropores was investigated using dye in a tropical rain forest, the Bukit Tarek experimental watershed of Peninsular Malaysia [11]. However, using dye patterns simply as nice qualitative pictures that illustrate macropore flow paths in soils is not sufficient. Recent studies took a quantitative approach to describe macropores. For example, Weiler and Fl��hler carried out dye tracer experiments in northern Switzerland and quantified (e.g., dye coverage) the distribution of macropores on the basis of dye patterns in vertical and horizontal soil sections [12]. Using the extreme value theory, BOGNER et al [13] and SCHLATHER and HUWE [14] evaluated the vertical distribution of macropores in forest soils. In another circumstance, DEVITT and SMITH [15] studied the influences of root systems of Larrea tridentata (creosotebush) on macropore flow paths in desert soils. GRAHAM et al [16] and KASTEEL et al [17] reported that roots, organic matter, soil texture and stones may impact on macropores distribution. Nevertheless, in well vegetated slopes, to our knowledge, few studies have examined the discrepancies of macropores distribution under different surface plant and the influences of root systems, organic matter and texture on macropore flow paths.
Furthermore, forest litters on experimental plots surface were removed before these dye tracer experiments [4, 13-14, 18]. As the interface between the mineral soil and the atmosphere in many land ecosystems, the forest litter plays a crucial role in hydrological processes [19]. Several authors have drawn attention to the physical particularities of the forest litters and note how they differ to those of the underlying mineral soils [20-21]. Due to its location and properties, the presence of forest litters can modify the amount of rainwater available for infiltration [22]. Consequently, it can alter the hydrological response of the soils compared to their response when no forest litter is present [19]. According to DESCROIX [23], forest litters play a pivotal role in soil hydrology. Litters are favorable to the interception of rainfall, which result in rainfall quickly infiltrates into the macropores and reduce the damage to the soils structure [11]. Furthermore, litters have positive effects on the temporal stability of macropores [24]. Macropores could be blocked by sediment particle due to removing the litter layer during rainfall simulation process in dye tracer experiment [11]. Consequently, previous studies could result in underestimate the macropore flow paths compare with real situation.
The present work aims to resolving the discrepancies that exist with respect to the macropore flow paths in well vegetated slopes under two different plants. We will carry out two dye tracer infiltration experiments in well vegetated slopes under different plants without removing forest litters, characterize the differences of macropores vertical distribution for two different plots, combine dye tracer technique with the laboratory analysis to assess the effects of root systems, organic matter and texture on macropore flow paths.
2 Materials and methods
2.1 Study site
Two experiments were performed at the Maka Mountain, Kunming, Yunnan, China (24��51��N, 102��52��E) in December, 2011. At the study site, the air temperature ranges from 0 ��C to 31.5 ��C with an annual mean temperature about 14.7 ��C. The average annual precipitation is 1001 mm. The minimum, maximum and average mean monthly precipitation are 13 mm (February and December), 211 mm (July) and 83.4 mm, respectively. The monthly precipitation has an unimodal distribution peak in July. Late Permian Emeishan basalt provides a base for a fifty to one hundred centimeter thick residual soil. The dominant vegetation in experimental plots 1 and 2 is Campylotropis polyantha (Franch.) Schindl and Cynodon dactylon (Linn.) Pers, respectively. Campylotropis polyantha (Franch.) is a woody plant, Cynodon dactylon (Linn.) Pers is an herbaceous plant. At the plots, soil samples were collected at depths of 0-10, 10-20, 20-30, 30-40 and 40-50 cm to measure soil properties in the lab, including organic matter, porosity, bulk density and soil texture. Soil samples were oven dried (80 ��C, 48 h), crushed and sieved. Organic matter content of the samples was determined by the potassium dichromate volumetric method according to China Standard (Specification of soil test, SL237��1999). Measured results of the soil properties are summarized in Table 1.
2.2 Experimental design
The schematic design for dye tracer infiltration experiments is shown in Fig. 1. At each experimental plot, a rectangular wooden frame was embedded into the soil. The length and width of the frame were 100 cm. Before the infiltration experiments, a 1.0 m deep trench was dug 1.0 m beside the downslope end of the experimental plots.
A dye tracer infiltration experiment was carried out in plots 1 and 2, respectively, in order to visualize adequately the distribution of macropore flow paths.Methylene blue was chosen as a dye tracer because it is clearly visible in soils, it has a low toxicity, and it has a high stability over a large pH and ionic strength range. In each plot, 250 L of aqueous solution of methylene blue (Concentration=1.5 g/L) as applied over 5 h at plot with a constant rate of 50.0 mm/h using a rainfall simulator. No ponding was observed for two plots throughout the experiment.
Table 1 Soil physical and chemical properties of two experimental plotsa
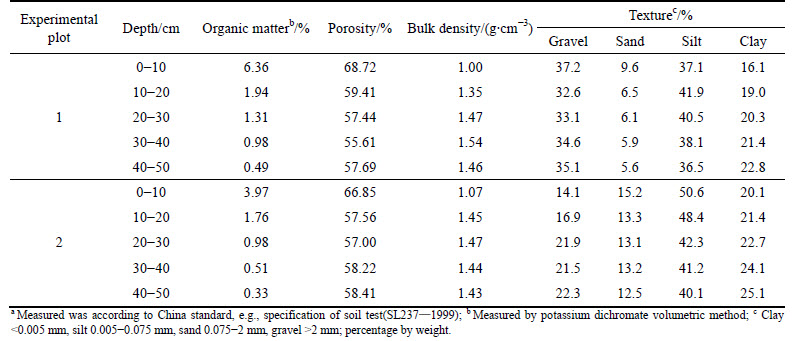
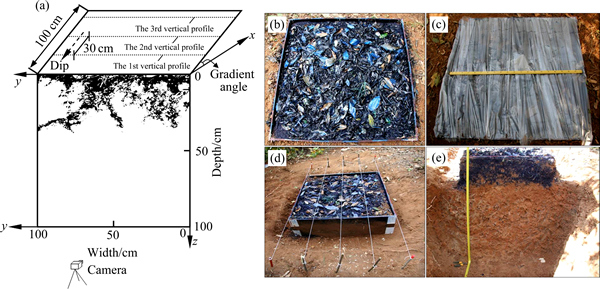
Fig. 1 (a) Diagram of experimental setup (a plot with a measurement scale of 100 cm �� 100 cm); (b) Methylene blue was chosen as a dye tracer to visualize macropore flow paths in plot 1. The length and width of the rectangular wooden frame were 100 cm; (c) Plot were covered to prevent evaporation; (d) White lines were applied to ensure vertical excavated profile explanate; (e) Vertical soil profiles were excavated starting from trench
Then the plots were covered to prevent evaporation and left for 24 h to complete the infiltration process. After the infiltration process, vertical soil profiles were excavated, starting from the trench with a horizontal interval of 30 cm (Fig. 1). For each plot, three profiles were excavated. After each profile was exposed, the soil surface was leveled and cleaned with a brush to remove loose soil particles resulting from digging. Dye stained patterns of the profile were recorded using a Canon EOS 5D Mark II digital camera.
2.3 Image processing
The final coverage of the stained areas was subsequently determined from profile images according to the following description. Five steps were necessary in order to obtain diagrams which could express the colored area specific to depth. The first step was to correct the pictures of certain profiles which could not be photographed orthogonally and output JPG-files of RGB format with the image editing program Photoshop CS2. The second step was to convert the image of RGB format into grayscale-image and output the TIFF-files with Matlab 7.0. One pixel represented an area of 1 mm��1 mm in the true coordinate system. The third step was application of Photoshop CS2 in TIFF-files exposure and threshold processing. The stained areas turned black, while the rest stayed white. The fourth step was to convert the image into binary format with Photoshop CS2. ��0�� was expression of black, while ��225�� was expression of white. The fifth step was to draw a numerical matrix of bitmap with Image 6.0 and save as Excel files.
2.4 Statistical analyses
Non-parametric Kruskal-Wallis test was conducted to identify statistical differences in dye coverage. Analysis of variance (ANOVA) was used to test the effects of root systems, organic matter and texture on macropore flow paths. Linear regression analysis and partial correlations analysis were conducted to determine the relationships between the mass density of fresh roots, organic matter content and average dye coverage for each plot. All analysis was conducted in SPSS software Version 17.0 with significance at P<0.05.
3 Results and discussion
3.1 Distribution patterns of macropore flow paths
The dye tracer experiment yielded 6 images which were initially subjected to a visual examination based primarily on morphology of the dye tracer pattern (Fig. 2). Macropore flow paths in plot 1 are mainly concentrate in the upper 30 cm, whereas most of the macropores in plot 2 are concentrate in the upper 10 cm, expect for the 1st profile. Macropore flow paths in two plots are more variable, with uniform distribution in the upper 5 cm and formation of heterogeneous distribution below this depth. Dendritic macropore flow paths developed from the base of the top 5 cm as the dye passed through root channels, etc. The distribution patterns of macropore between two plots are different. Although highly variable, the plot 1 exhibits much greater macropore flow paths than the plot 2. As shown in Fig. 2, the zone above the final infiltration depth at each plot is not completely covered by dye. The result suggested that macropores in vertical profile are not vertically straight downward but tortuous.
The relationship of dye coverage vs. depth is shown in Fig. 3. As shown in Fig. 3(a), the deepest macropore flow paths in plot 1 are 32.9 cm, 28.0 cm and 27.4 cm for the 1st, 2nd and 3rd profiles, respectively, while those in plot 2 are 29.9 cm, 24.3 cm and 23.7 cm for the 1st, 2nd and 3rd profiles, respectively. By applying a non- parametric test, one can say that the difference is significant (P<0.05). Overall, macropore flow paths decreases with depth, however, this decrease is not linear but fluctuant. The steepest decline in macropore flow paths appear to occur over the top 10 cm of the plot, and then in 10-40 cm in depth, macropore flow paths decreases slowly with depth.
As shown in Fig. 3(b), average dye coverage decreases with depth (P<0.05). At depth of 0-40 cm, the Eta statistical measures (��2) of between average dye coverage and depths in plot 1 is 0.665, 0.716 and 0.629 for the 1st, 2nd and 3rd profiles, respectively, while that in plot 2 is 0.666, 0.261 and 0.354 for the 1st, 2nd and 3rd profile, respectively. The results above show that the positive relationships between average dye coverage and depths is more significant for plot 1 than for plot 2.
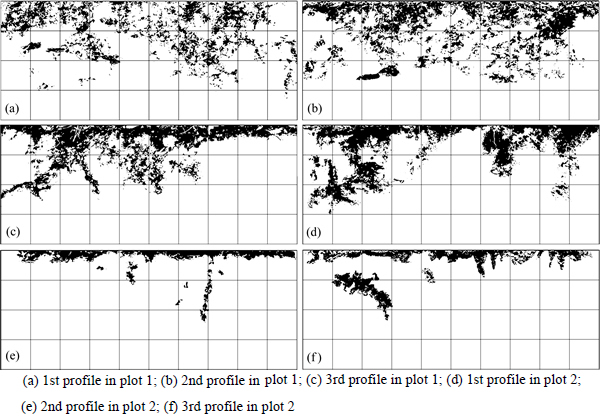
Fig. 2 Typical dye stained patterns for profiles (The grid size of the figure is 10 cm��10 cm):
3.2 Effects of root systems on macropore flow paths
Representative field photos in Fig. 4 shows clearly the effects of root systems on macropore flow paths distribution. As shown in Fig. 4(a), where the denser the root systems, where the large the stained area. The spatial relationship between root systems and stained areas is significant. In Fig. 4(b), the soil around a root of 5 mm in diameter was stained. The dye concentrates on living roots, especially, those which had developed vertically or in a downslope direction (Fig. 4(c). As shown in Fig. 4(d), a root of 20 mm in diameter was stained by methylene blue. Living roots may affect the macropore flow locally and change the flow towards the soil around root which is non-compacted and highly conductive. These macropore flow paths are defined as ��root-soil interface��. The results derived from these photos indicate that root systems have significant effects on macropore flow paths distribution.
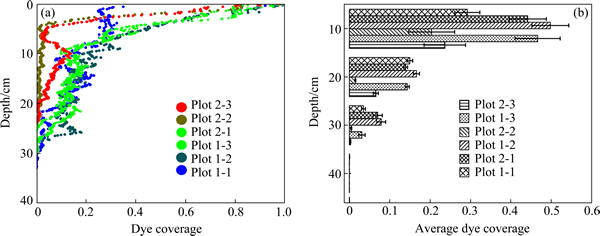
Fig. 3 Dye coverage vs. depth of two plots (three profiles for each plot) (a) and average dye coverage vs. depth (b) (means and standard deviations of six profiles; ��plot 1-1�� represent the 1st profile in experimental plot 1. Name methods of others are the same)
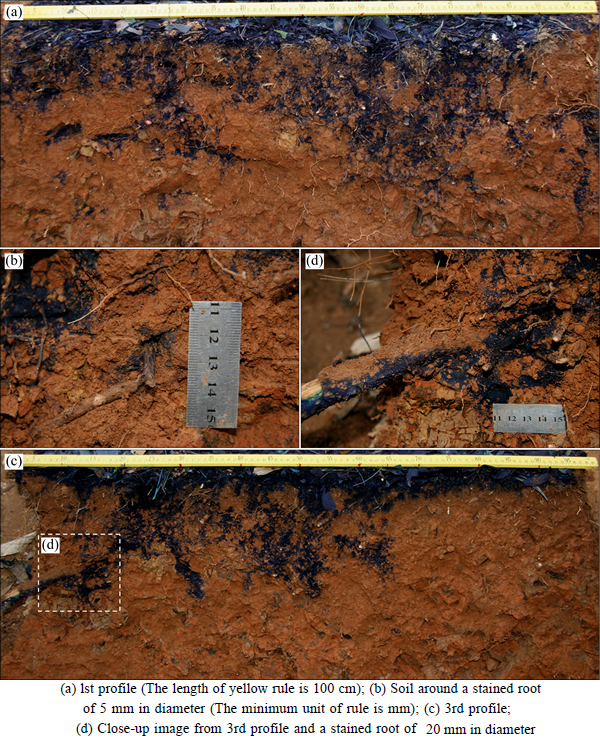
Fig. 4 Dye concentrated on living roots in plot 1:
At each plot, undisturbed blocks of soil (40 cm �� 40 cm��10 cm) were taken from the depths of 0-10, 10-20, 20-30 and 30-40 cm to measure the mass density of fresh roots (defined as the proportion of the mass of fresh roots (g) to the total mass of soil (kg) and its unit is g/kg). The mass density of fresh roots decreases with depth (P<0.05). The relationship of average dye coverage vs. the mass density of fresh roots is presented in Fig. 5(a). The mass density of fresh roots is distinctly higher for plot 1 than for plot 2 (P<0.05). The relationship between average dye coverage (Yi) and the mass density of fresh roots (Ai) can be expressed as: Y1=0.018A1-1.116 and Y2=0.028A2-0.027 for plots 1 and 2, respectively. There is a strong linear positive relation between average dye coverage and the mass density of fresh roots for two plots (R1=0.958, R2=0.948). However, the influence of root systems for plot 1 is more significant than for plot 2 (F1=22.190, P1=0.042; F2=17.715, P2=0.052). The reason is that, in plot 2, the majority of roots are confined to the upper 10 cm and the diameter of roots range from 1 mm to 2 mm. In contrast, in plot 1, the majority of roots are confined to the upper 30 cm and the diameter of roots range from 2 mm to 7 mm, and the maximum diameter is 26 mm. The results indicate that the effect becomes more pronounced as the diameter of root become larger.
Macropore flow paths that relate to plant roots including decayed root channel [25] and root-soil interface. However, in the Maka Mountain, the important macropores is root-soil interface. This fact is dependent on the growth condition of vegetation and physicochemical characteristic of soil. Root-soil interface is an important macropore flow paths in well vegetated slopes. There are three types of formation mechanism of root-soil interface: 1) roots often follow the cracks between aggregates, and the abandoned continuous pores produced by previous roots or earthworms and other soil fauna [26]; 2) the physical entrance and expansion of a root in the soil compress the soil adjacent to it [27]; 3) the uptake of water by roots dries the soil and thereby hardens it; on the other hand, the exudation of water from root tips may soften the soil on the growth morphology of roots [28].
3.3 Effects of organic matter on macropore flow paths
Organic matter is formed from the litters and the roots of vegetation that grows on it. For this reason the organic matter content is likely to be partly affected by the surface vegetation. The organic matter content decreases with depth (P<0.05). It is distinctly higher for plot 1 than for plot 2 (P<0.05). As shown in Fig. 5(b), the average dye coverage increases overall with the organic matter content in two plots. The relationship between average dye coverage (Yi) and the organic matter content (B1) can be expressed as Y1=0.073B1-0.039 and Y2=0.087B2-0.058 for plots 1 and 2, respectively. Modeling by linear analysis demonstrate that there is outstanding positive correlation between average dye coverage and the organic matter content for two plots (R1=0.982, F1=54.672, P1=0.018 and R2=0.993, F2= 150.514, P2=0.007).
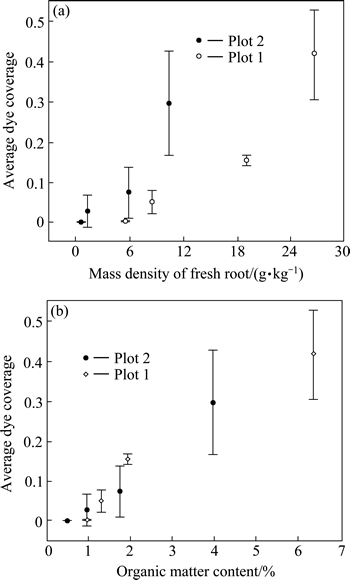
Fig. 5 Relation between mass density of root and average dye coverage (a) and relation between organic matter content and average dye coverage (b) (Means and standard deviations of two plots)
Inter-aggregate macropore is one kind of important macropores and it is a key factor in the high infiltration [26-27]. The impacts of five factors on macroaggregate formation were described in a comprehensive review [29]. Organic matter is the most important factor involved in the formation and stabilization of macroaggregate [30]. However, most of macroaggregate formation studies have been conducted in agricultural soils [29]. A large number of aggregates have been observed in top soils in well vegetated slopes. For instance, using scanning electron microscope, aggregates were observed in top soils in plot 1 (Fig. 6). The aggregate can be formed in numerous ways. As one kind of organic matter, fungal hyphae could enmesh fine particles of soil into stable aggregates (Fig. 6(a)). The fungal mycelium has been described as a ��sticky string bag�� because it entangles particles within the hyphae network and cements particles together through extracellular polysaccharide production [31]. In accordance with the aggregate hierarchy theory and the pore exclusion principle, the enmeshment of particles by the ��sticky string bag�� is a major factor in the formation of macroaggregates [32]. Furthermore, as shown in Fig. 6(b), organic matter could also combine with soil mineral particles to form an aggregate in bonding way [31]. The organic matter is still considered to provide the flexible links between the external surfaces of clay domains [33]. The aggregate result from physicochemical reactions between polyvalent cations, organic molecules, and clays and it is more stable [31].
3.4 Effects of texture on macropore flow paths
The particle size distribution vs. depth is shown in Table 1 and Fig. 7. In general, the sand and silt content decreases with depth, in contrast, the clay content increases with depth for two plots. For both plots the gravel content increases overall with depth, but showing maximum values at depths of 0-10 cm for plot 1. The gravel content is distinctly higher for plot 1 and for plot 2 (P<0.01). The sand and silt content are lower for plot 1 and for plot 2 (P<0.05). No significant difference in the clay content between two plots is observed (P=0.142).
Furthermore, as shown in Fig. 8, the surface of stones in plot 1 were stained by dye, this result indicates that stone surface serve as macropore flow paths. The finding is well-supported by the result of dye tracer experiments of diverse author [34-35]. Stones affect the pore volume of soil remarkably [36]. Aubertin investigated macropores in a moderately steep slope, covered by a mixed deciduous hard-wood forest in Ohio and found that the forest soil rich in stones and macropores were associated with stones [25]. Dye tracer experiments showed that some macropores flow did occure along the surface of stones [5, 7]. BOGNER et al [13] and NOBLES et al [4] reported that the surface of the stones served as macropore flow paths and were stained. LAINE-KAULIO [36] conducted dye tracer experiments in the midslope part of the Kangaslampi slope and discovered that the dye concentrated on the stone surface. WEILER [37] pointed out that macropores flow through a stone was not possiibe, but macropores flow around a stone was quite frequent. As a consequence, this macropore flow paths is defined as ��stone-soil interface��. It is an important macropore flow paths, especially in the topsoil.
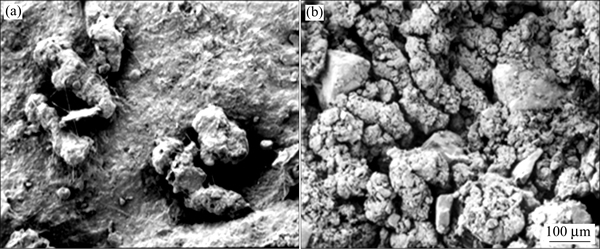
Fig. 6 Scanning electronic micrographs of fine roots (a) and hyphae binding soil particles (b) into water-stable aggregates
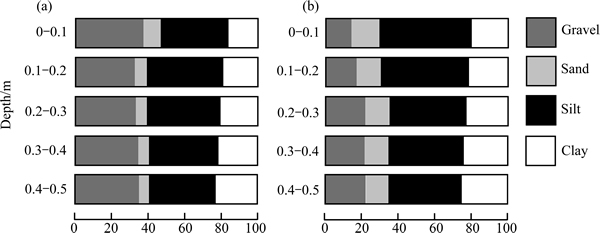
Fig. 7 Particle size distribution of soil for plot 1 (a) and plot 2 (b) (The different depth sections correspond to soil horizons)
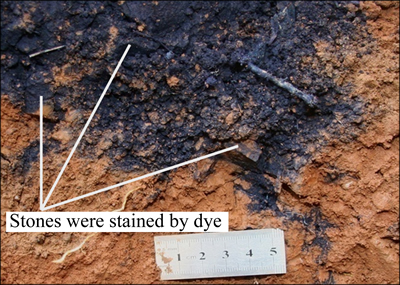
Fig. 8 Stone-soil interface preferentially channeled water in plot 1 (The minimum unit of the rule is mm)
4 Conclusions
1) The discrepancy in macropores distribution between both plots under different surface vegetation is significant. The depths and areas of macropore flow paths are larger for the woody plant community slopes (plot 1) than for the herbaceous plant community slopes (plot 2). The decrease of macropore flow paths with depth is fluctuant. Macropore flow paths are homogeneous distribution in the upper 5 cm layer, however they are heterogeneous (dendritic) distributions below this depth.
2) Root systems have significant effects on macropore flow paths distribution and the effect become more pronounced as the diameter of root become larger. Macropores that relate to plant roots including decayed root channel and root-soil interface. In the Maka Mountain, root-soil interface is an important macropore flow paths.
3) Dye coverage decreases with the organic matter content for two plots, which indicated that the organic matter is one of the important factors to affect macropores distribution. Inter-aggregate macropore could be formed by the combination organic matter and soil particles in numerous ways and it is one kind of important macropores.
4) Stone is favorable for the formation of macropores, especially in the topsoil. Stone-soil interface is an important type of macropore flow paths in well vegetated slopes.
References
[1] WANG Lan-min, WU Zhi-jian, WANG Ping, CHEN Tuo. Characteristics, causation, and rehabilitation of Zhouqu extraordinarily serious debris flows in 2010, China [J]. Journal of Central South University of Technology, 2013, 20(8): 2342-2348.
[2] CHIANG S H, CHANG K T. The potential impact of climate change on typhoon-triggered landslides in Taiwan, 2010-2099 [J]. Geomorphology, 2011, 133(3): 143-151
[3] GUZZETTI F, PERUCCACCI S, ROSSI M, STARK C P. The rainfall intensity�Cduration control of shallow landslides and debris flows: An update [J]. Landslides, 2008, 5(1): 3-17.
[4] NOBLES M M, WILDING L P, LIN H S. Flow pathways of bromide and brilliant blue FCF tracers in caliche soils [J]. Journal of Hydrology, 2010, 393(1): 114-122.
[5]  K, EBERMANN S, SCHALLING N. Evidence of double-funneling effect of beech trees by visualization of flow [J]. Journal of Hydrology, 2012, 470: 184-192.
[6] UCHIDA T, KOSUGI K, MIZUYAMA T. Effects of pipeflow on hydrological process and its relation to landslide: A review of pipeflow studies in forested headwater catchments [J]. Hydrological Processes, 2001, 15(11): 2151-2174.
[7] ANDERSON E, WEILER M, ALILA Y, HUDSON R O. Dye staining and excavation of a lateral preferential flow network [J]. Hydrology and Earth System Sciences, 2009, 13(6): 935-944.
[8] WANG K, ZHANG R D. Heterogeneous soil water flow and macropores described with combined tracers of dye and iodine [J]. Journal of Hydrology, 2011, 397(1): 105-117.
[9] ALAOUI A, GOETZ B. Dye tracer and infiltration experiments to investigate macropore flow [J]. Geoderma, 2008, 144(1): 279-286.
[10] BOUMA J, JONGERIUS A, BOERSMA O, JAGER A, SCHOONDERBEEK D. The function of different types of macropores during saturated flow through four swelling soil horizons [J]. Soil Science Society of America Journal, 1977, 41(5): 945-950.
[11] NOGUCHI S, NIK A R, KASRAN B, TANI M, SAMMORI T, MORISADE K. Soil physical properties and preferential flow pathways in tropical rain forest [J]. Journal of Forest Research, 1997, 2(2): 115-120.
[12] WEILER M, FL HLER H. Inferring flow types from dye patterns in macroporous soils [J]. Geoderma, 2004, 120(1): 137-153.
[13] BOGNER C, WOLF B, SCHLATHER M, HUWE B. Analysing flow patterns from dye tracer experiments in a forest soil using extreme value statistics [J]. European Journal of Soil Science, 2008, 59(1): 103-113.
[14] SCHLATHER M, HUWE B. A risk index for characterising flow pattern in soils using dye tracer distributions [J]. Journal of Contaminant Hydrology, 2005, 79(1): 25-44.
[15] DEVITT D A, SMITH S D. Root channel macropores enhance downward movement of water in a Mojave Desert ecosystem [J]. Journal of Arid Environments, 2002, 50(1): 99-108.
[16] GRAHAM C B, WOODS R A, MCDONNELL J J. Hillslope threshold response to rainfall: (1) A field based forensic approach [J]. Journal of Hydrology, 2010, 393(1): 65-76.
[17] KASTEEL R, GARNIER P, VACHIER P, COQUET Y. Dye tracer infiltration in the plough layer after straw incorporation [J]. Geoderma, 2007, 137(3): 360-369.
[18] HANGEN R, GERKE H H, SCHAAF W, HTTL R F. Flow path visualization in a lignitic mine soil using iodine�Cstarch staining [J]. Geoderma, 2004, 120(1): 121-135.
[19] KEITH D M, JOHNSON E A, VALEO C. A hillslope forest floor (duff) water budget and the transition to local control [J]. Hydrological Processes, 2010, 24(19): 2738-2751.
[20] KEITH D M, JOHNSON E A, VALEO C. Moisture cycles of the forest floor organic layer (F and H layers) during drying [J]. Water Resources Research, 2010, 46(7): 1-14.
[21] LAUREN A, MANNERKOSKI H. Hydraulic properties of mor layers in Finland [J]. Scandinavian Journal of Forest Research, 2001, 16(5): 429-441.
[22] GUEVARA-ESCOBAR A,  E, RAMOS- SALINAS M, HERNANDEZ-DELGADO G D. Experimental analysis of drainage and water storage of litter layers [J]. Hydrology and Earth System Sciences, 2007, 11(5): 1703-1716.
[23] DESCROIX L, VIRAMONTES D, VAUCLIN M, GONZALEZ BARRIOS J L, ESTEVES M. Influence of soil surface features and vegetation on runoff and erosion in the Western Sierra Madre (Durango, Northwest Mexico) [J]. Catena, 2001, 43(2): 115-135.
[24] NERIS J, TEJEDOR M,  C. Effect of forest floor characteristics on water repellency, infiltration, runoff and soil loss in Andisols of Tenerife (Canary Islands, Spain) [J]. Catena, 2013, 108: 50-57.
[25] AUBERTIN G M. Nature and extent of macropores in forest soils and their influence on subsurface water movement [M]. Forest Service, Broomall, PA: Northeastern Forest Experiment Station, 1971.
[26]  M, LABOURIAU R, HOLMSTRUP M, TORP S B, GREVE M H, HECKRATH G, IVERSEN B V, de JONGER L W, MOLDRUP P, JACOBSEN O H. Density of macropores as related to soil and earthworm community parameters in cultivated grasslands [J]. Geoderma, 2011, 162(3): 319-326.
[27] PETH S, HORM R, BECHMANN F, DONATH T, FISCHER J, SMUCKER A J M. Three-dimensional quantification of intra- aggregate pore-space features using synchrotron-radiation-based microtomography [J]. Soil Science Society of America Journal, 2008, 72(4): 897-907.
[28] PASSIOURA J B. Soil conditions and plant growth [J]. Plant, Cell & Environment, 2002, 25(2): 311-318.
[29] SIX J, BOSSUYT H, DEGRYZE S, DENEF K. A history of research on the link between (micro) aggregates, soil biota, and soil organic matter dynamics [J]. Soil and Tillage Research, 2004, 79(1): 7-31.
[30] SAHA D, KUKAL S S, SHARMA S. Landuse impacts on SOC fractions and aggregate stability in typic ustochrepts of Northwest India [J]. Plant and Soil, 2011, 339(1-2): 457-470.
[31] OADES J M, WATERS A G. Aggregate hierarchy in soils [J]. Soil Research, 1991, 29(6): 815-828.
[32] BOSSUYT H, DENEF K, SIX J, FREY S D, MERCKX R, PAUSTIAN K. Influence of microbial populations and residue quality on aggregate stability [J]. Applied Soil Ecology, 2001, 16(3): 195-208.
[33] ALAG Z Z, YILMAZ E. Effects of different sources of organic matter on soil aggregate formation and stability: A laboratory study on a lithic rhodoxeralf from Turkey [J]. Soil and Tillage Research, 2009, 103(2): 419-424.
[34] JARVIS N J. A review of non-equilibrium water flow and solute transport in soil macropores: Principles, controlling factors and consequences for water quality [J]. European Journal of Soil Science, 2007, 58(3): 523-546.
[35] SAUER T J, LOGSDON S D. Hydraulic and physical properties of stony soils in a small watershed [J]. Soil Science Society of America Journal, 2002, 66(6): 1947-1956.
[36] LAINE-KAULIO H. Development and analysis of a dual- permeability model for subsurface stormflow and solute transport in a forested hillslope [D]. Aalto: Aalto University, 2011.
[37] WEILER M H. Mechanisms controlling macropore flow during infiltration [D]. Freiburg: Albert-Ludwigs University of Freiburg, 2001.
(Edited by DENG L��-xiang)
Foundation item: Project(U1502232) supported by the National Natural Science Foundation of China-Yunan Joint Fund; Project(KKSY201406009) supported by the Natural Science Foundation of Kunming University of Science and Technology, China; Project(2014FD007) supported by the Natural Science Foundation of Yunnan Province, China
Received date: 2015-03-30; Accepted date: 2015-07-22
Corresponding author: ZHANG Jia-ming, PhD, Lecturer; Tel: +86-13888442865; E-mail: zjm_engeo@163.com

