Geochemical studies, mineralization and mineral potential of Tafresh area, the Iran-Markazi
来源期刊:中南大学学报(英文版)2018年第10期
论文作者:Safari MAHDI Khademi FARKHONDEH
文章页码:2496 - 2511
Key words:Urumieh–Dokhtar; magmatic series; hydrothermal; mineralization; mineral potential
Abstract: The study area is part of the Urumieh–Dokhtar volcanic arc that a large part of its surface is covered by extrusive Igneous rocks (tuff, intermediate lavas and ignimbrites sheets), plutonic igneous (diorite and granodiorite) and semi-deep stones (dyke and sill). Studied samples are situated in calc-alkaline domain of magmatic series diagrams. Harker diagrams show the fractional crystallization of Clinopyroxene, amphibole, plagioclase, alkali feldspars and opaque minerals (ilmenite Titano-magnetite, ilmenite and rutile). In spider diagrams, light rare earth elements (LREE) are enriched compared to heavy rare earth elements (HREE), and HFS elements (Ti, Nb) show negative anomaly and LFS elements (Cs, K, Pb) show positive anomaly, showing that it is a distinct characteristic of subduction zones. Skarns of the area mainly are of exoskarns and are rich in plagioclase, microcline, amphibole, biotite and epidote. Skarn is enriched of iron, copper, molybdenum, vanadium, lead, zinc and silver. Deposits of barite in the area show characteristics of volcanic-sedimentary barites and are associated to ore-bearing hydrothermal solutions. Using satellite images and processing information, four areas with high mineral potential are identified in the area.
Cite this article as: Safari MAHDI, Khademi FARKHONDEH. Geochemical studies, mineralization and mineral potential of Tafresh area, the Iran-Markazi [J]. Journal of Central South University, 2018, 25(10): 2496–2511. DOI: https://doi.org/10.1007/s11771-018-3931-4.

J. Cent. South Univ. (2018) 25: 2496-2511
DOI: https://doi.org/10.1007/s11771-018-3931-4

Safari MAHDI1, Khademi FARKHONDEH2
1. Department of Geology, Payame Noor University of Tehran, Tehran, P.O. Box 19395-3697, Iran;
2. Department of Geology, Faculty of Science, Imam Khomeini International University, Qazvin, Iran
 Central South University Press and Springer-Verlag GmbH Germany, part of Springer Nature 2018
Abstract: The study area is part of the Urumieh–Dokhtar volcanic arc that a large part of its surface is covered by extrusive Igneous rocks (tuff, intermediate lavas and ignimbrites sheets), plutonic igneous (diorite and granodiorite) and semi-deep stones (dyke and sill). Studied samples are situated in calc-alkaline domain of magmatic series diagrams. Harker diagrams show the fractional crystallization of Clinopyroxene, amphibole, plagioclase, alkali feldspars and opaque minerals (ilmenite Titano-magnetite, ilmenite and rutile). In spider diagrams, light rare earth elements (LREE) are enriched compared to heavy rare earth elements (HREE), and HFS elements (Ti, Nb) show negative anomaly and LFS elements (Cs, K, Pb) show positive anomaly, showing that it is a distinct characteristic of subduction zones. Skarns of the area mainly are of exoskarns and are rich in plagioclase, microcline, amphibole, biotite and epidote. Skarn is enriched of iron, copper, molybdenum, vanadium, lead, zinc and silver. Deposits of barite in the area show characteristics of volcanic-sedimentary barites and are associated to ore-bearing hydrothermal solutions. Using satellite images and processing information, four areas with high mineral potential are identified in the area.
Key words: Urumieh–Dokhtar; magmatic series; hydrothermal; mineralization; mineral potential
Cite this article as: Safari MAHDI, Khademi FARKHONDEH. Geochemical studies, mineralization and mineral potential of Tafresh area, the Iran-Markazi [J]. Journal of Central South University, 2018, 25(10): 2496–2511. DOI: https://doi.org/10.1007/s11771-018-3931-4.
1 Introduction
The magmatic arc of Urumieh-Dokhtar is part of the Alpine-Himalayan orogenic belt with the northwest trend that continues from Anatolian fault in Turkey to Oman in southern Iran. This magmatic arc is 50–150 km in width and about 1800 km in length located in the southwestern margin of the continent in Central Iran [1, 2]. This magmatic complex contains thick sequence of about 3–4 km from pyroclastics and lava flows including Basalts, andesite, andesite-basalt, trachy andesite, dacite and rhyolite, and numerous intrusive bodies and deep dikes to a surface. Alavi introduces Lower Cretaceous as the age of the oldest rocks in the complex of Urumieh-Dokhtar (granitoid complex of Shirkooh) but Ref. [3] introduces Middle Jurassic as the age of this complex. Some researchers have attributed magmatism of this magmatic arc Cenozoic to Neo-Tethyan subduction under the Central Iran continent [4] and have attributed the chemical composition of the magma changes during the Cenozoic to changes in subduction slope [5]. And some others introduced adakitic as Mio- Pliocene magmatism of this magmatic arc [6–8]. The study area is located in the middle of the magmatic arc of Urumieh–Dokhtar.
The aim of this work is to investigate petrogenetic and volcanic evolution of volcanic and plutonic rocks, mineralization and mineral potential of the area. To achieve this target, following study methods are used: facies review of volcanic and intrusive units of the area, chemical review of major and trace elements and using remote sensing data in the mineral potential analysis of the area.
2 Geology and lithology
The oldest outcrops in the study area are Shotori dolomite related to Triassic then are Jurassic and Cretaceous sediments that have outcrop in the Noghreh Kamar area is older, but most of studied outcropping belongs to Eocene volcanic and pyroclastic rocks [9, 10] (see Figure 1, [11]).
2.1 Tuffs
Rocks of this facies in the lower part of the series include layers of tuff shale, tuff marl, tuff limestone, that gradually turn into tuffs (lithic tuff, crystal tuff, Vitrik tuff) and green pyroclastic layers in the higher parts. In the study area, crystal tuffs are the main unit of volcano-sedimentary facies and include micro crystals of quartz and plagioclase, shards of glass, opaque minerals and matrix. Micro crystals have rounded edges and embayed textures.
2.2 Lavas of andesite and basaltic-andesite
Basaltic-andesite lava flows are the product of volcanic eruptions in non-marine environment and are on the previous volcano-sedimentary units (Figure 2). Andesitic lava flows are the most in the area in terms of volume. The main texture of these samples is zoning texture, sieve texture, porphyry texture with microcrystalline background and glomerulopathy texture. Most components of andesitic rocks are plagioclases. More plagioclases show sieve texture and zoning (Figures 3(a) and (b)). Pyroxene, are mostly in form of pyroxene phenocrysts, and mostly have segregated blades. Almost all pyroxene phenocrysts are euhedral. Some pyroxene phenocrysts have zoning(Figure 3(c)). Amphiboles are also frequently seen in these samples and are subhedral and euhedral [10].
2.3 Rhyolitic ignimbrites
In some parts of the area, thin ignimbrite sheets with rhyolite combination are seen sporadically [10] (Figure 2(b)) that due to their particular combination and texture, known as production of gas-charged eruptions from top of magma tanks. The lava flows consist of glass components, phenoclasts (consisting plagioclase, sanidine, pyroxene and rarely quartz) and opaque minerals. Plagioclases show zoning and sieve texture. In these samples, there is otaksity texture [10] (Figure 3(d)).
2.4 Infiltrators
Eocene volcanic complex is disconnected by intrusive masses including parallel dikes categories and subvolcanic masses with combination of diorite and granodiorite [10]. Among the main texture of these rocks is porphyry with microgranoular background and hidden crystal. Plagioclase phenoclasts mostly show zoning. Most of plagioclase is parsed. Amphiboles are also observed abundantly in these rocks. In all samples of area, the opaque minerals include magnetite.
One of the distinctive features of the Tafresh area is existence of various parallel arranged dikes (Figure 1). In the study area, dikes are gathered in two East and West of Tafresh areas based on the relative concentration (Figure 1). These dikes are almost parallel to each other with a thickness of about 5.2 m and a length of 15–20 m, these dikes have cut units related to the Eocene and older, after the Eocene volcano-sedimentary and volcanic rocks, Qom formation and the formation of bottom red (Figure 2(c)). Dikes have porphyry textures with Intercertal, Hyalumicrolity, microlitic, glomeroporhyryhidden crystal and sometimes alternating backgrounds.
3 Geochemistry
3.1 Main elements
In diagram of naming alkali set against silica [12], samples related to volcanic rocks are in range of basalt, the tracky basalt, andesite basalt, andesite tracky basalt, andesite, tracky andesite, dacite and rhyolite (Figure 4(a)). And in silica diagram against alkali set [13], samples of the intrusive body and semi-deep dikes are in range of gabbro and diorite (Figure 5(b)). The dividing line of the range of alkaline from calc-alkaline has been reported [14], (Figure 4). In the triangular diagram [14] AFM (Alkali set-FeO–MgO diagram), most of samples are in the range of calc-alkaline and samples of semi-deep dikes and a few samples of lavas and one sample of intrusive body are in the range of tuleity (Figure 4(c)). Aluminum saturation diagram [15] of the samples of studied area, most of samples related to the lavas and dikes are in the range of Metalomin and samples of the intrusive body, some samples of dikes and intrusive body are in the range of aluminous (Figure 4(d)).
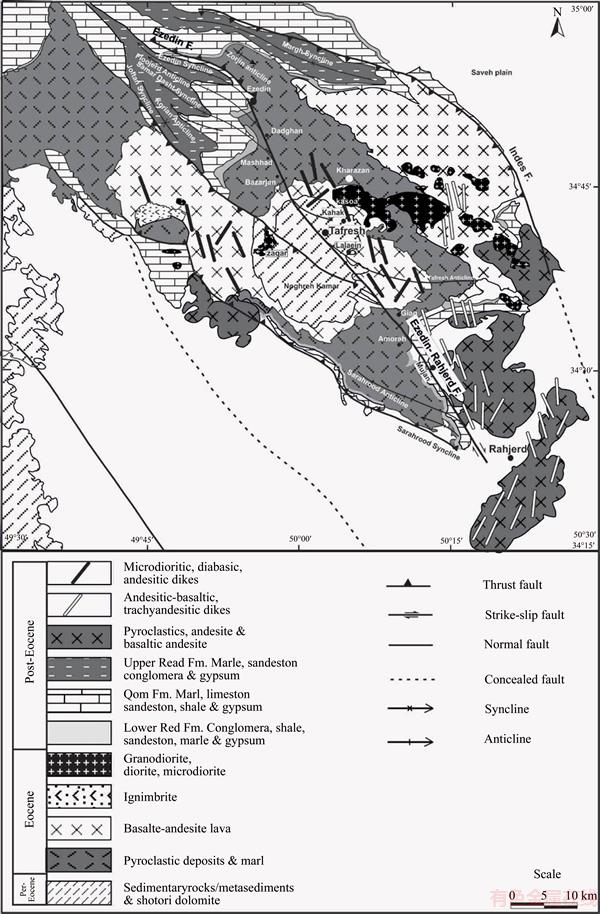
Figure 1 Simplified geological map of study area [10, 11]
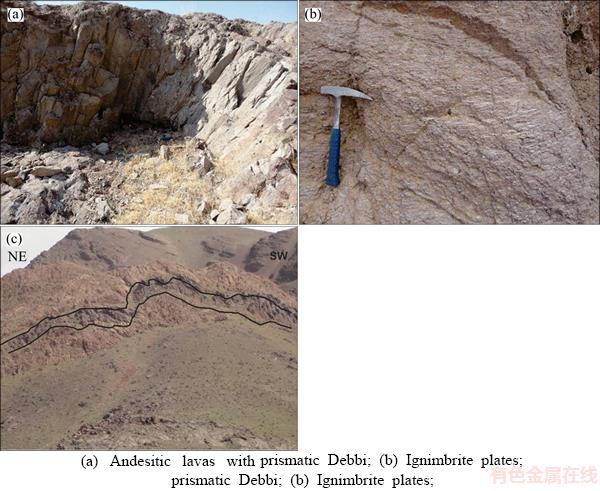
Figure 2 Samples of magmatic facies in study area:

Figure 3 Microscopic images of samples:
In tectonic environment differentiation diagrams [16], Th–Hf–Ta, Hf/3–Th–Nb/16, Zr/117–Th–Nb/16, most of samples are in the range of arc-island (Figures 5(a) and (b)). In Ref. [17], La/Yb–Ta/Yb diagram, the diagram separates three tectonic environment active continental margin, arc-island and first arc-island. In this diagram, the samples are in the range of arc-island (Figure 5(c)). The Nb/Y against Zr/Y diagram [18] showing this proportion is of fixed mantellic variables. In this diagram, mantle components combined in basalt fields have been shown in different tectonic environments. Diagram is divided into two areas with plume source and non-plume source by Nb linea. Two areas of ocean island basalt (OIB) and oceanic plateau basalt are in the range of the plume source and magmatic arc (ARC) and normative are in the range of non-plume source. Route F shows melting the batch and the subduction zone (SUB) route shows subduction [11, 19], most of samples are in the range of non-plume source and placed in the direction of subduction (Figure 5(d)).

Figure 4 Ranking volcanic rocks diagram [12] (a), ranking intrusive igneous rocks diagram [13] (b), triangular diagram of FeO–MgO–AlK [14] (c) and alumina saturation diagram [15] (d)
3.2 Examine evidence for subduction and crustal contamination
ROGERS et al [20] believe that for trends plotted in diagrams of changes in incompatible elements against incompatibles, if they are ascending linear and pass through the origin of coordinates, it can be said that fractional crystallization has a crucial role in the development of the region’s rocks. Some factors can cause changes in these processes such as inconsistencies in source, varying degrees of partial melting, incorporation and contamination of magma [21]. Changes in incompatible elements relative to each other for the studied samples are shown in the Ce and Y versus the Yb diagrams. In this chart, the pattern of changes in the studied samples follows linear process or is nearly linear and ascending (Figures 6(a) and (b)). Semi-deep dikes samples show a little deviation. Ratio diagram of changes in Ba/Y versus Ba has also been used, these changes show linear and ascending trend (Figure 6(c)), consequently all drawn trends indicate that fractional crystallization is the main process in the evolution of rocks.
K2O/Na2O against Rb/Zr diagram is used to detect fractional crystallization processes along with digestion of (AFC) and fractional crystallization of (FC) [22]. As can be seen, most of the studied samples follow AFC process (Figure 7(a)). In chart Rb/Y against Nb/Y, vertical trends in this diagram occur as a result of enrichment in subduction zone or crustal contamination, and thus the amount of Rb in relativity to Rb/Y rises. Vertical process of studied samples is clearly visible in this diagram, and enrichment is shown in subduction zone(Figure 7(b)). Charts of Th/Nb against Ba/Th [23] are used to investigate melting of the upper crust and sediments and lower crust page. The chart reflects the expansion of company of upper crust materials in magma forming studied rock (Figure 7(c)). In fact, this ratio in the studied samples can indicate the role of subducted oceanic plate sediments in the magmatic rocks. According to Ref. [24], if the whole change of K2O/TiO2 is low, it can be concluded that the crustal contamination plays little role in evolution of magma. In lavas area, the K2O/TiO2 ratio is changing in 8/2–16/0 (Excluding five samples that show higher values), these numbers represent the low importance of crustal contamination in the samples. Area’s magma has properties of arc volcanic regions. A ratio that could be determinative is the ratio of Ba/La, this ratio is between 4 and 10 for NMORB, 10 and 15 for EMORB and more basalt inside pages and it is more than 15 for volcanic rocks of convergent plate boundary [16]. This mentioned ratio in volcanic arcs is more than in stretching areas and regions behind the arc [25]. This ratio changes from 15 to 114 in area’s lavas (only in a few cases is less than 15). Because a high proportion of Ba/La is a sign of enrichment in mantle wedge by fluids of subduction zone, and Ba is derived from subducted oceanic sediments [26]. The amount of TiO2 is also one of the indicators of magma in such areas, in basalts and andesits of arc areas, TiO2 rarely increases from 3.1 wt%, despite the fact that TiO2 in other tectonic environment is more than 10 wt% [25]. The amount of TiO2 in the studied samples fluctuates between 2/1 and 4/0 (only in three cases reaches 1.8), these values can be indicative of the samples relationship with volcanic arcs areas.
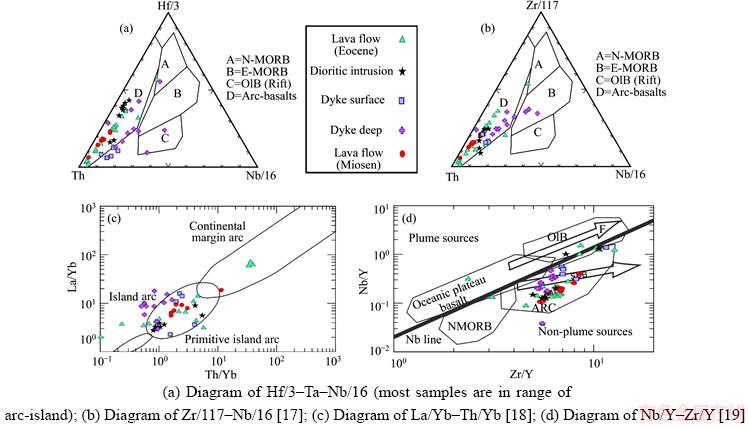
Figure 5 Determining tectonic environment diagrams:

Figure 6 Plot of changes in incompatible elements of La against Ce (a), plot of changes in incompatible elements of Y against Yb (b) and ratios of incompatible elements Ba/Y versus Ba diagram (c)
3.3 Harker diagrams
In Harker diagrams, the MgO, CaO, FeO,Al2O3 and TiO2 oxides in studied samples show a decreasing trend by increasing SiO2 (Figure 8). MgO often exits from the melting due to high compatibility, in the early stages of crystallization,changes between magmatic rocks of area, is explained by fractional crystallization of pyroxene, hornblende, opaque minerals, plagioclase and alkaline feldspar. Because diagram of oxides of the main elements including TiO2, CaO, Fe2O3, MgO and Al2O3 shows negative linear trend, the main element oxide Na2O show the curve trend. The main element oxide Na2O shows the curve trend. The MgO, Fe2O3, CaO trend is perfectly synchronized and represents close relationship of iron, magnesium and calcium during fractional crystallization and concurrent use of three oxides in similar minerals. The simultaneous use of three oxide is attributed to crystallization of plagioclase, hornblende and pyroxene. Reduction of MgO and Fe2O3 is coordinated by fractional crystallization process and it can be attributed to subtract minerals of ferromagnesian. Reduction of CaO shows subtraction of phases containing CaO, phases consisting CaO contains three mineral of calcium plagioclase, hornblende and pyroxene. Reduction of TiO2 can be attributed to subtraction of minerals containing TiO2, including ilmenite, rutile and Titano-magnetite. Reduction of Al2O3, FeO, MgO and CaO is attributed to subtraction of hornblende. It can be concluded that during fractional crystallization of clinopyroxene, the amphibole, plagioclase, alkali feldspars and opaque minerals (ilmenite Titano-magnetite, ilmenite and rutile) are crystallized from magma (Figure 8).
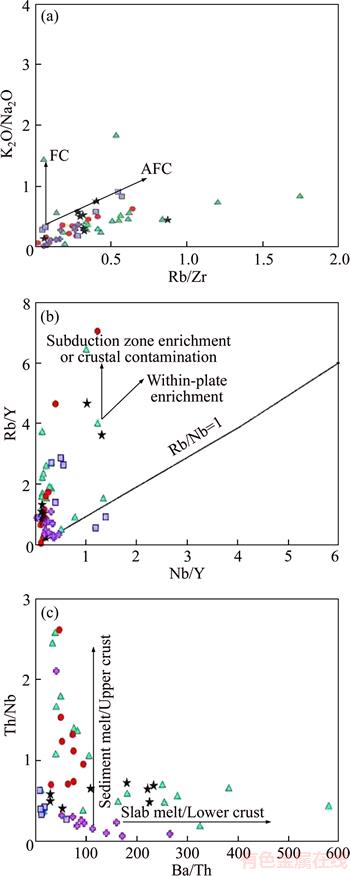
Figure 7 Diagram of K2O/Na2O against Rb/Zr (more samples follow the AFC trend) (a); Chart Rb/Y versus Nb/Y (samples show vertical trend that represents enrichment in subduction zone or crustal contamination occurs) (b); Chart Th/Nb against Ba/Th (more samples indicate expansion of the company of upper crust material in magma forming studied rocks, and some samples indicate lower crust sheets melting in forming of area’s rocks) (c)
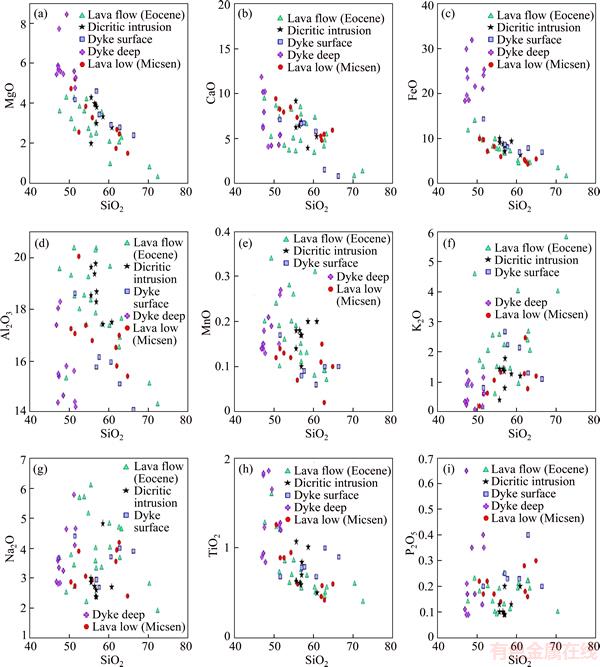
Figure 8 Harker diagrams of studied samples
3.4 Spider diagrams
In spider diagrams, light rare earth elements (LREE) are enriched in ratio to heavy rare earth elements (HREE). High LREE/HREE ratio can be due to incompatibility of LREE in comparison with HREE. Trace element patterns show characteristic of subduction zones stones. Also the samples show characteristics such as high ratio of Ba/La, the amount of TiO2 and ratio values of K2O/TiO2 show characteristics of arc-island area’s magma. The presentations all endorse samples relationships with subduction zones. Drawing diagrams to determine the crystallization processes indicates that more studied samples follow AFC trend. Also enrichment of mantle wedge by fluids derived from subducted plate is clearly visible on the diagram. Some samples are placed in the range of adakites that according to previous studies it can be attributed to the broken subducted plate (Figure 9).
4 Mineralization and mineral potentials
4.1 Metamorphic rocks
The studied skarns in the region include Kasva intrusive body skarn and skarns of Zagheri intrusive body. In both intrusive bodies, because of the lack of direct contact between skarn halo and mass, the granodiorite is exoskarn type. Investigated skarns are calcic skarn type and include constituents of Ca and Ca–Fe. Most of the world reserves are created in classic exoskarn [27]. Skarns are formed in open systems and in different hydrothermal environments, magma to hot springs. Hydrothermal fluids involved in the skarn formation are variable from metamorphic fluid to magma and atmospheric fluid [28].
4.1.1 Zagher skarn unit
This unit is seen in the southern part of Dobaradarn mountain and north of the Zagheri village. Skarn unit wide reaches up to 20 m. Outcrops of this unit is above the Zagheri village where the diorite intrusion has cut carbonate unit. The minerals quartz, recrystallized calcite, epidote, chlorite, garnet and opaque minerals (magnetite, Alyzhyst, sulfides, carbonates of copper, iron and manganese hydroxides) have been seen in the skarn zone. Sometimes crystals of the mineral cordierite can also be seen. Areas where skarn formation has been done are created as endoskarn and exoskarn indexes. At endoskarn area, quartz in stones has been rose and skarn type minerals such as epidote, magnetite, Alyzhyst, and even sometimes garnet are also composed. In addition, in the place of endoskarn abundant sulfide, mainly pyrite with sphalerite, galena, chalcopyrite, malachite and azurite are seen, which are scattered along the veins or rock. Silica alteration is seen in endoskarn and sometimes exoskarn part. Skarn in this area is calcic type skarn considering mother rocks lithology and obtained minerals. In one of samples, the anorthite, quartz, augite and calcite are observed in main phase, and hornblende and biotitein are observed in secondary phase. Existence of anorthite, augite, hornblende and biotite in limestone shows skarn formation [29]. In area dikes, the mineralization of epidote and amphibolein is observed in diorites (Figure 10).
4.1.2 Kasva skarn unit
Kasva intrusive body has penetrated among the Eocene sedimentary-pyroclastic facies. The host rock is in the study area of Tuff. Kasva exoskarn in the region includes garnet skarn zone, garnet- epidote skarn and marble zone.
Kasva exoskarn in the studied area includes garnet-skarn, garnet-epidote skarn and marble zone. In garnet skarn zone, garnet is the most abundant rock-forming mineral and can be seen as coarsely crystallized with zoning and isotropic, smaller crystals of garnet are also isotropic in this zone.
In garnet-epidote skarn zone, garnet is isotropic and epidotes are in the field of quartz with granvblasty texture. In marble zone, garnet crystalls are scattered along with epidote in field of calcite and quartz. Among the skarn minerals, we can point to magnetite, hematite, malachite, pyrite and chalcopyrite.
4.1.3 Zagher hornfels
Hornfelses are observed as halo around the intrusion and diorite dikes. This unit’s width is approximately 500 m that from mass margin to the out, the degree of metamorphism gradually decreases. Rocks are very fine-grained, dense and hard that their apparent color is dark gray to black. These units in different parts have sulfide mineralization mostly in the form of pyrite, and the amount of mineralization increases towards the periphery of masses.
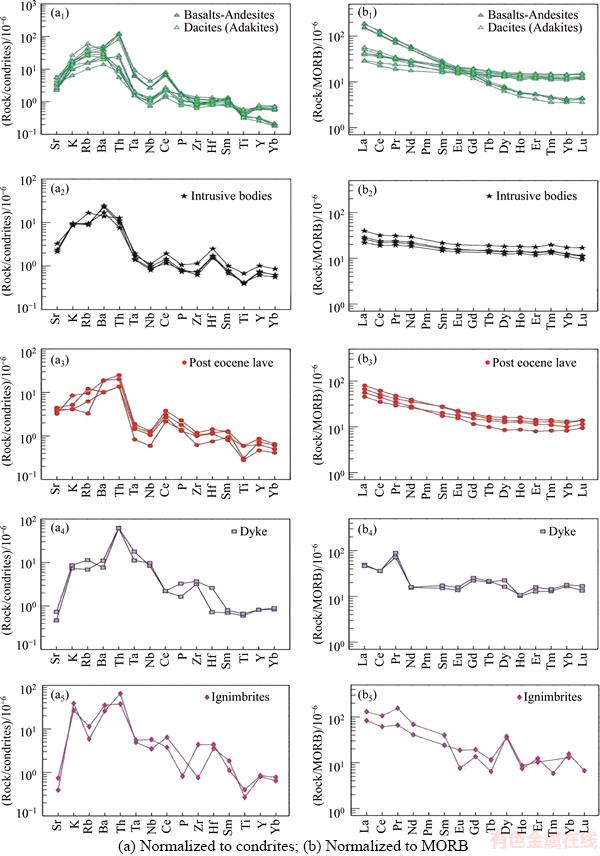
Figure 9 Spider diagrams of samples in study area:
Zagheri silicified hornfels units are observed in the north col of Noghre Kamar and west of Zagheri village, as a zone in edge of intrusive body that is strongly silicified and with pyrite. The thickness of the unit is up to 50 m. This unit contains pyrite in the form of veins.
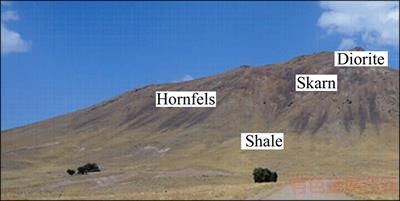
Figure 10 View of Zagheri diorite intrusive, and skarn unit, hornfelse in west of Two Brothers Mount
4.2 Creating barite ore deposit
There are several barite ore deposits in volcanic zone of Urumieh-Dokhtar, the study of mineralogy, alteration and fluid inclusion halo puts it in number of hydrothermal vein deposits. Barite mineralization in the region Tafresh, is formed as filling empty space and along the fault in two hypogene and supergene stages. The hypogene stage includes the Barite-quartz mineralization and sulfide mineralization and the supergene stage that is the result of weathering, and decomposition of primary minerals is mostly formed from oxide and carbonate minerals. Barite veins with high storage are placed between Eocene bottom green, middle red and upper green units. In this area, mineralization at a low temperature and pressure (less than 250 °C) is formed by fluids rich in sulfate ions and the presence of secondary building controller (fault). In the northern part of the studied area, there is a deposit of barite located as veins and lenses in the north west–south east in andesitic- pyroclastic rocks. In the mentioned deposit, there are the manganese oxide minerals, malachite, galena and calcite mineral that have filled the space between barite. The barite is available as most abundant mineral in forms of shaped and hypidiomorphic crystals and rarely in stretched form. The host andesitic rocks have large crystals of plagioclase with theme of tiny crystal with porphyry and microlitic texture. MOALLAYE et al [30] considered it similar to volcanic-sedimentary barite deposits according to the geochemical characteristics of rare earth elements, such as concentrations of rare earth elements, enrichment and light rare earth element (LREE) of the heavy rare earth elements and positive anomalies. The source of mineralizing hydrothermal fluids in this deposit is low temperature hydrothermal fluids associated with hydrothermal processes.
4.3 Remote sensing
One of the useful methods to explore mineral is using remote sensing. In this method for detecting the target, after pre-processing and corrections on the data, different methods are used to detect and identify the target [31]. Porphyry ore body are usually accompanied by different alteration zones including Potassic, Phyllic, Argillic and Propylitic zones, the typical pattern of which could be seen in Figure 11. In this work, ETM+ images will be attempted to detect argillic and propylitic alteration and iron oxide to provide information layers and alteration of Tafresh sheet for incorporation.
4.3.1 ETM+ image processing
By using the multi spectral images of ETM+, identification of iron oxide alteration (Gossan) argillic and propylitic alteration associated to porphyry copper deposits is possible. 12 zones of porphyry copper alteration presented by Refs. [32, 33] is given in order to provide the understanding of ore deposit situation and minerals index of any zone to detect Landsat images [34].
Ratio pictures or ratios with considered as extremely useful methods for detection of phenomena in multiband images. This method is used to reduce the impact of sunlight, topodiagramy and spectral detection in images [35]. The main advantage of the use of band ratios, is providing an image completely independent of brightness [36]. This method is used for mapping herbs, clays and detection of alteration zones of clay alteration.
4.3.2 Detection of iron oxide
Iron oxides and sulfides are the second group of minerals that accumulate in the hydrothermal alteration system. Figure 12 shows the spectrum of minerals accumulate in this zone that shows minimum reflectance in the range of first band and maximum reflectance in the range of third band [37].
The band ratio is used for the detection of iron oxides in the region (Figure 13(a)). By image processing, it can be concluded that in the west and north west of Tafresh region there is accumulation of iron minerals extensively, and in other areas this mineralization is sporadically and with less intensity [37].
4.3.3 Detection of alteration
Image processing methods can be used to detect the altered areas and specific lithological units. One of these methods is band ratios and color ratio images to enhance the spectral response of minerals and reduce the spectral response of vegetation. ABRAMS et al [38] aparted this phyllic and potassic alteration zones from propylitic and argillic areas using color ratio images(Figure 13(b)). What should be noted here is that the aforementioned method for identifying alterations in region does not act as well as the band ratio method because of variations of lithology in the Tafresh area. It is worth mentioning that whatever shown in the band ratios, all are not representation of an alteration system associated with mineralization.
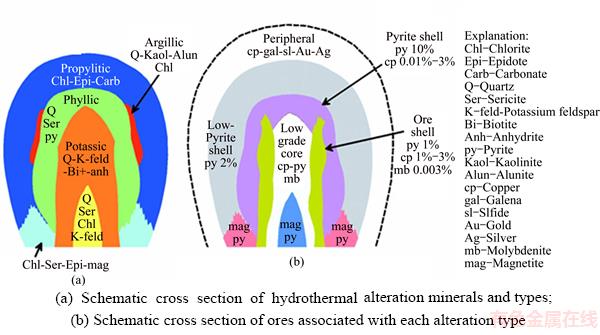
Figure 11 Different alteration zones of porphyry copper ore body:

Figure 12 Iron oxide minerals pectrum and Landsat band range [37]
4.3.4 Color combinations of alteration in ASTER
In ASTER images, alterations can be detected by use of creating colored images 468. For this purpose, in Figure 13(c), this color combination is used to detect alteration. The results of the analysis of satellite images show (Figure 14) that in the north west, west and south west of the region, there is a high potential. There are also several small alterations visible in the center of the image. The results have four full potential zones in the studied area (see Figure 14).
Finally, by comparing the images with each other, we tried to provide the best possible alteration zone map to provide alteration layer required for integration. The results show that in the north west, west and south west of region, there is a high potential. There are also several small alterations visible in the center of the image. The results have four full potential areas in Tafresh tab (Figure 14).
It is concluded that active mines in the region are placed in four areas of mineral potential, that this mine can be divided into two categories: metal and non-metal mines. Metal mines includes. 1) Iron mine: Iron Beklik, Samardasht iron, binaural iron; 2) Copper mines: Narbaghy Copper, Banaylu copper, Dolly copper and Chogan copper. Nonmetal mines includes. 1) Barite mines: Darsu, Ahmadabad, Sarahrud, Kohlu payin; 2) Mines of bentonite: Bentonite Mine of Ashtiyan and Ghezelcheh.
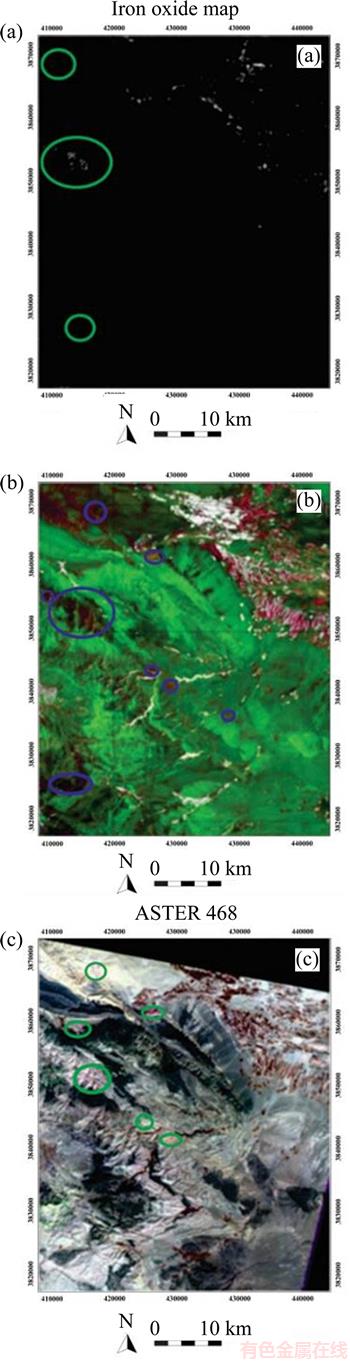
Figure 13 (a) Detection of iron oxides; (b) Detection of alteration associated with porphyry copper system by Abrams and Brown method; (c) Tafresh area alteration (argillic alteration in this image is detected in pink and propylitic alteration is green)
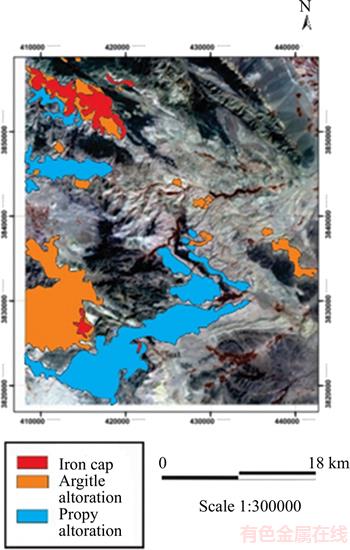
Figure 14 Alteration map of Tafresh zone
5 Conclusions
5.1 Magmatic evolution
Studied stones, according to the classification charts, have the combination range of basalt, andesite basalt, andesite, diorite, dacite and rhyolite. Magmatic evolution of volcanic rocks of area takes place in range of calc-alkaline and tuleity, according to the charts setting magmatic series. In charts of saturation degree of alumina, most of samples are in the range of Peralumina, and samples of intrusion masses except one, four samples of lavas and four samples of dikes are in the range of Metalomina. Changes between magmatic rocks of area are explained through fractional crystallization of pyroxene, hornblende, opaque minerals, plagioclase and alkaline feldspars. Because oxides of the main elements TiO2, CaO, Fe2O3, MgO and Al2O3 show negative linear trend, the main element oxide Na2O show the curve. The MgO, Fe2O3, CaO process is perfectly synchronized and reflects the close relationship of iron, magnesium and calcium during fractional crystallization and concurrent use of these three oxide in the same minerals. Simultaneous use of these three oxide is attributed to crystallization of plagioclase, hornblende and pyroxene. Reduction of MgO and Fe2O3 is coordinated by fractional crystallization process and can be attributed to subtract ferromagnesian minerals. Reduction of CaO shows subtraction of phases containing CaO, phases containing CaO consists of three calcium minerals including phasesplagioclase, hornblende and pyroxene. Reduction of TiO2 can be attributed to subtraction of minerals containing TiO2, including ilmenite, rutile and Titano-magnetite. Reduction of Al2O3, FeO, MgO and CaO is attributed to subtract hornblende. It can be concluded that during fractional crystallization of clinopyroxene, amphibole, plagioclase, alkali feldspars and opaque minerals (ilmenite Titano- magnetite, ilmenite and rutile) are crystallized from magma. In addition to low amount of magnesium, the low Mg number and high ratio of FeO/MgO, also confirms not being primary of magma producing rocks of area. Tectonic environment of samples is arc-island of areas. In tectonic environment differentiation charts, samples are in the range of basalts of arc-island areas and active continental margin, but after Eocene andesite samples slightly tend to the inside sheets basalt, spider diagrams show pattern of trace elements characteristics of subduction zones rocks.
In spider diagrams, the LREEs have been enriched than heavy rare earth elements (HREEs). The high ratio of LREE/HREE can be due to incompatibility of LREE in comparison with HREE. Trace elements pattern show characteristic of subduction zones rocks. Also samples show characteristics such as high ratio of Ba/La, the amount of TiO2 and ratio values of K2O/TiO2 show characteristics of arc-island area magmas. The presentations are all endorsing the relationship between samples and subduction zones. Drawing charts to determine the crystallization processes indicate that most of studied samples follow the AFC process. Also enrichment of mantle wedge by fluids derived from subducted plate is clearly visible on the diagram. Some samples are placed in the range of adakites that it can be attributed to the broken subducted plate according to previous studies.
5.2 Economic geology
There are several barite ore deposits in Urmia- dokhtar volcanic zone that mineralogical studies, alteration and fluid inclusion, puts it in numbers of hydrothermal vein Ore deposits. Barite mineralization in the Tafresh area is formed as filling the empty space and along the fault in two hypogene and supergene stages. Hypogene stage contains barite-quartz mineralization and sulfide mineralization and the supergene stage that is the result of weathering and decomposition of primary minerals is mostly formed from oxide and carbonate minerals. Barite veins with saving thousand tons are placed between underlying green units, middle red and upper green with Eocene age. In this mine, mineralization at low temperature and pressure (less than 250 °C) is formed by fluids enriched sulfate ion and the presence of secondary building controller (fault).
Intrusive body in a collision with Triassic shales, turns them into hornfels and in dealing with Cretaceous limestone, causing formation of marble and skarn in the north west and west of Zagher Village and south of brothers Mount. Studied skarn has formed the skarn in impact of diorite dyke with Cretaceous limestone. Studied skarn show enrichment in ratio to Cr, As, Au, Ni, Co, Cu, Fe, Zn elements and it is expected that skarn is from iron skarns. Studied skarn shows enrichment in ratio to V, Sc, Cr, Ce, La elements and show depletion in ratio to Sr element. In addition, gold was not observed in the samples of studied area. According to the analysis of elements, there is malformations in the Sb, As, Co and Mo elements, also there is enrichment in As, Cu, Zn and Mo elements. It can be concluded that the skarn is also copper skarns. Geochemical anomalies were seen in the Cd, U, Sb, Co, Mo, As, Mn, Cu, Ag, Zn and Pb elements indicating the existence of Pb and zinc skarns. Co, Sb, U, Pb, As, Cu, Zn, Mo elements enrichment, especially mineralization of molybdenum confirms the existence of molybdenum skarn. However, according to the diagram of average composition of this intrusive body, the studied skarn does not show conditions of Pb and zinc and molybdenum skarns, and confirms iron-copper skarn.
5.3 Remote sensing
By comparing images with each other, the most favorable alteration map in the region was prepared to provide alteration layers required for integration. The results suggest that there is a high potential in the north west, west and south west areas. Also several small alterations are visible in the center of the image. Studies show four areas of potential in the form of Tafresh.
According to the stepping arrangement of Bidhend faults, Ezzoddin-Rahjerd and the right moves on the mentioned faults, it can be seen that dikes of west Flujerd-Rahjerd fault, in parts of central and close terminal of to North compressional of Ezzoddin-Rahjerd fault and dikes of East Rahjerd Ezzoddin-faults, in the compression zone between two fault of Bidhendi and Ezzoddin- Rahjerd, has outcrop that indicates created tensile space in mentioned dextral shear zone (Khademi 1392). Creating stretching spaces and disruption, forming a conduit for the passage of magma and formation of dikes have been parallel to the Ezzoddin-Rahjerd fault and perpendicular to fold axis of area. As previously mentioned, dikes in the region have two dominant trends N40–45W and N10–20W. Dikes with the N40–45W process are parallel with main structures such as Talkhab faults, Chaqqar and Tafresh caused by stretching movements in the direction of structures and the main fractures are formed due to the collision and the formation of the original structures (Khademi 1392). Igneous rocks are a group of rocks that have economic potential and mineral resource. In subduction zones, mineralization associated with alkaline and calc-alkaline rocks is done in the continental environment, from mineralization of these samples we can mention mineralization of Pb, zinc, gold, silver, mercury and we can mention mineralization of chromium, cobalt, nickel, iron, copper, and other elements in basic rocks. Due to the items listed and Figures 1, 14 and 15, areas with high mineral potential are consistent with process of main faults in the area such as Indes, Tafresh, fault and stretching space discussed at the southern end of the Azzedine-Rahjerd fault and north terminal of Bidhend fault. It can be said that magmatism of area is consistent with deep fractures of area and mineralization of copper, iron and barite. As mentioned, it is also in connection with the Neogene-Eocene magmatism. According to the contents expressed previously, paragenesis barite, calcite, copper and alteration minerals, have emerged in hydrothermal conditions and in relation to cooling magmatic rocks of area.
References
[1] ALAVI M. Regional stratidiagramy of the Zagros fold-thrust belt of Iran and its proforeland evolution [J]. American Journal of Science, 2004, 304(1): 1–20.
[2] ALAVAI M. Tectonic of the Zagros orogenic belt of Iran: New data and interpretations [J]. Tectonophysics, 1994, 229(3): 211–238.
[3] JAZEE M. A review of the geochemistry and isotope and intrusive granitoid Middle Jurassic and Tertiary: A new perspective on tectono-magmatic and mineralization in this period of Iran [J]. Journal of Geology, Ferdowsi University of Mashhad, 2012, 2(4): 171–198. (in Persian)
[4] BERBERIAN M, KING G C P. Towards a paleogeodiagramy and tectonic evolution of Iran [J]. Canadian Journal of Earth Sciences, 1981, 18(2): 210–265.
[5] HASSANZADEH J. Metallogenic and tectonomagmatic events in the SE sector of the Cenozoic active continental margin of Iran (Shahre-Babak area, Kerman Province) [D]. Los Angeles: University of California, 1993.
[6] GHADAMI G R, MORADIAN A, MORTAZAVI M. Post-Collisional Plio-Pleistocene Adakitic volcanism in Centeral Iranian Volcanic Belt: Geochemical and geodynamic implications [J]. Journal of Sciences Islamic Republic of Iran, 2008, 19(3): 223–236.
[7] MOHAJJEL M, FERGUSSON C L. Dextral transpression in Late Cretaceous continental collision, Sanandaj–Sirjan zone, western Iran [J]. Journal of Structural Geology, 2000, 22(8): 1125–1139.
[8] OMRANI J, AGARD P, WHITECHURCH H, BENOIT M, PROUTEAU G, JOLIVET L. Arc-magmatism and subduction history beneath the Zagros Mountains, Iran: A new report of adakites and geodynamic consequences [J]. Lithos, 2008, 106(3): 380–398.
[9] EMAMI M H. Geological quadrangle map of Iran, 1: 250,000 scale, sheet E6 (Qom) [M]. Tehran: Geological Survey of Iran, 1981.
[10] KKHADEMI F. Check facies and geochemistry of magmatic rocks of Shahrab-Feshk region North East of Farmahini, Arak [D]. Qazvin: Imam Khomeini International University, 2013. (in Persian).
[11] KOHANSAL R, RADFAR J. Geological map of 1: 100,000 Farmahin [M]. Tehran: Geological Survey of Iran, 2003. (in Persian).
[12] le MAITRE R W, BATEMAN P, DUDEK A, KELLER J, LAMEYRE L E, BAS M J, SABINE P A, SCHMID R, S RENSEN H, STRECKEISEN A, WOOLEY A R, ZANETTI B. A classification of igneous rocks and glossary of terms [M]. Oxford: Blackwell, 1989.
[13] COX K G, BELL, J D, PANKHURST R J. The interpretation of igneous rocks [M]. London: George Allen and Unwin, 1979.
[14] IRVIN T N, BARAGAR W R A. A guide to the chemical classification of the common volcanic rocks [J]. Canadian Journal of Earth Sciences, 1971, 8(5): 523–548.
[15] SHAND S J. Eruptive rocks—Their genesis, composition, classification, and their relation to ore-deposits with a chapter on meteorite [M]. New York: John Wiley & Sons, 1943.
[16] WOOD D A. The application of a Th-Hf-Ta diagram to problem of tectonomagmatic classification and to establishing the nature of crustal contamination of basaltic lavas of the British tertiary volcanic province [J]. Earth and Planetary Science Letters, 1980, 50(1): 11–30.
[17] CONDIE K C. Geochemical changes in basalts and andesites across the Archean–Proterozoic boundary: Identification and significance [J]. Lithos, 1989, 23(1–2): 1–18.
[18] CONDIE K C. High field strength element ratios in Archean basalts: A window to evolving sources of mantle plumes [J]. Lithos, 2005, 79 (3): 491–504.
[19] SAFARI M. Studying mineralogical and technological properties of mining industry soil of Save Gorg Baghi and its impact in the ceramics industry [C]// The Fourth Conference of Economic Geology of Iran. Birjand, Iran, 2011. (in Persian)
[20] ROGERS G, SAUNDERS A D, TERRELL D J, VERMA S P, MARRINER G F. Geochemistry of Holocene volcanic rocks associated, with ridge subduction in Baja California, Mexico [J]. Nature, 1985, 315(6018): 389–392.
[21] ROLLINSON H R. Using Geochemical data: Evaluation, presentation, interpretation [M]. New York: Longman Group, 1993.
[22] PEARCE J A. Trace element characteristics of lavas from destructive plate boundaries [M] Chichester: Wiley, 1982: 525–548.
[23] OROZACO-ESQUIVEL T, PWTRONE C M, FERRARI L, TAGAMI T, MANETTI P. Geochemical variability in Laas from the eastern Trans-Mexican volcanic belt: Slab detachment in a subduction zone with varying dip [J]. Littos, 2007, 93(1): 149–174.
[24] FAN W M, GUE F, WANG Y J, LIU G. Late Mesozoic calcalkaline volcanism of post-orogenic extention in the northen Da Hinggan mountains, northeastern China [J]. Journal of Volcanology and Geothermal Research, 2003, 121(1): 115–135.
[25] GILL J B. Orogenic andsites and plate tectonic [M]. New York: Springer-Verlage, 1981.
[26] WILSON M. Igneous petrogenesis: A global tectonic approach [M]. London: Unwin Hyman, 1989.
[27] EINAUDI M T, BURT D M. Introduction terminology, classification, and composition of skarn deposits [J]. Economic Geology, 1982, 77(4): 745–754.
[28] BARNES H L. Geochemistry of hydrothermal ore deposits [M]. New York: John Wiley and Sons, 1977.
[29] MALEKI A. Geology, mineralogy, geochemistry and zonation of gold skarn of Zagher Tafresh [D]. Arak: Technical University of Arak, 2015. (in Persian)
[30] MOALLAYE M S, EHYA F, KHEYME S S. Geology, geochemistry and source of barite deposit of Chenarvardeh, Markazi Province [C]// The Nineteenth Congress of the Geology Society of Iran and the Ninth National Congress of the Geology of Payam Noor University. Tehran, Iran, 2015. (in Persian)
[31] MAGHSOUDI F, RIAHI S H, prospecting of ornamental rocks using Satellite Images in Northeast of Kerman [C]// 33th National Geosciences Survey of Iran. Tehran, Iran, 2015. (in Persian)
[32] LOWELL J D, GUILBERT J M. Lateral and vertical alteration mineralization zoning in porphyry ore deposits [J]. Economic Geology, 1970, 65: 373–408.
[33] MARS J C, ROWAN J C. Regional Mapping of phyllic- and argillic-altered rocks in the Zagros magmatic arc, Iran, using advanced space borne thermal and reflection radiometer (ASTER) data and logical operator algorithms [J]. Geosphere, 2006, 2(3): 161–186.
[34] SAFARI M, JUNGOUDARZI M. Geology and exploration of resources (groundwater, hydrocarbon deposits, minerals) [M]. Tehran: Pazineh, 2014. (in Persian)
[35] RANJBAR H. Deposites exploration telemetry [R]. Shahid Bahonar University of Kerman [R]. 2008. (in Persian)
[36] GUPTA M M, JIN J, HOMMA N. Static and dynamic neural networks: From fundamentals to advanced theory [M]. New Jersey: John Wiley & Sons, Inc., Hoboken, 2003.
[37] SABINS F F. Remote sensing for mineral exploration [J]. Ore Geology Reviews, 1999, 14(3): 157–183.
[38] ABRAMS M J, BROWN L, LEPLERY R, SADOWSKI P. Remote sensing for porphyry copper deposits in Southern Arizona [J]. Economic Geology, 1983, 78(4): 591–604.
(Edited by FANG Jing-hua)
中文导读
伊朗–马卡齐塔夫雷什地区的地球化学研究、矿化和矿物潜力
摘要:本文的研究区是乌鲁米耶–杜克塔尔火山弧的一部分,其表面大部分为挤压型火成岩(凝灰岩、中间熔岩和闪长岩片)、斜长火成岩(闪长岩和花岗闪长岩)和半深岩(闪长岩和底岩),研究样品属于岩浆系列的钙碱性岩系。Harker图显示了斜辉石、斜长岩、斜长石、碱性长石和不透明矿物(钛铁矿、斜长石和不透明矿物)的分馏结晶。在蛛网图中,轻稀土元素比重稀土元素富集,HFS元素(Ti,Nb)呈现负异常,LFS元素(Cs,K,Pb)呈现正异常,为俯冲带的一个明显特征。该地区的硅卡岩主要为外生岩溶,富含斜长石、微克隆、角闪石、黑云母和绿帘石。硅卡岩富含铁、铜、钼、钒、铅、锌和银。该地区的重晶石矿床具有火山沉积重晶石的特征,与含矿热液有关。利用卫星图像和处理信息,确定了该区4个矿产潜力大的地区。
关键词:乌鲁米耶–杜克塔尔;岩浆系列;热液;成矿作用;矿物潜力
Received date: 2016-11-04; Accepted date: 2017-03-23
Corresponding author: Safari MAHDI, PhD, Lecturer; Tel: +98–912–2889600; E-mail: mb.safari@yahoo.com; ORCID: 0000-0002- 7800-4656

