J. Cent. South Univ. Technol. (2011) 18: 726-730
DOI: 10.1007/s11771-011-0754-y
Application of response surface method for optimal transfer conditions of multi-layer ceramic capacitor alignment system
PARK Su-seong, KIM Jae-min, CHUNG Won-jee, SHIN O-chul
School of Mechatronics, Changwon National University, Changwon 641-773, Korea
? Central South University Press and Springer-Verlag Berlin Heidelberg 2011
Abstract: The multi-layer ceramic capacitor (MLCC) alignment system aims at the inter-process automation between the first and the second plastic processes. As a result of testing performance verification of MLCC alignment system, the average alignment rates are 95% for 3216 chip, 88.5% for 2012 chip and 90.8% for 3818 chip. The MLCC alignment system can be accepted for practical use because the average manual alignment is just 80%. In other words, the developed MLCC alignment system has been upgraded to a great extent, compared with manual alignment. Based on the successfully developed MLCC alignment system, the optimal transfer conditions have been explored by using RSM. The simulations using ADAMS? has been performed according to the cube model of CCD. By using MiniTAB?, the model of response surface has been established based on the simulation results. The optimal conditions resulted from the response optimization tool of MiniTAB? has been verified by being assigned to the prototype of MLCC alignment system.
Key words: multi-layer ceramic capacitor (MLCC); alignment system; response surface method (RSM); MiniTAB?; ADAMS?
1 Introduction
Nowadays, cellular phones, digital cameras and MP3 have been daily necessaries so that they become more compact and even lighter with powerful functions. To cope with these demands, the electronic parts such as capacitors are much smaller. For this purpose, a new type of capacitor, called multi-layer ceramic capacitor (MLCC), is shown up. The MLCC can allow an electronic product to be ultra-light.
Accordingly, the demand of MLCC is consistently increasing. In turn, this pushes up the automation for producing MLCC efficiently. This is why we are getting into research for MLCC production automation system with Solomon Mechanics Inc. However, the inter-process automation, i.e., automation between two neighboring processes, is lower than the automation of each process.
The MLCC alignment system which aims at the inter-process automation between the first and the second firing processes will be dealt with. In specific, without the MLCC alignment system, manual process would intervene for the inter-process between the above two processes. Figure 1 shows the MLCC alignment system developed by Solomon Mechanics Inc.
The purposes of this work are: 1) Testing the performance verification of the MLCC alignment system, compared with the manual operation; 2) Applying the response surface method to figuring out the optimal transfer conditions of the MLCC transfer system.
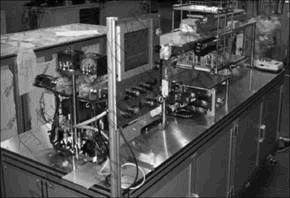
Fig.1 Multi-layer ceramic capacitor alignment system
2 Testing performance verification of MLCC alignment system
2.1 MLCC alignment system
The MLCC alignment system from the first firing process to the second firing process can be outlined as follows: 1) the feeding part of the first fired chips, 2) mass measuring part of chips, 3) conveyor unit for transferring chips from the feeding part to mass measuring part, 4) aligning part of chips, and 5) transferring part of chips. In order to verify the performance of the MLCC alignment system, some experiments were conducted by using various testing chips. The modes of MLCC are 3216, 2012 and 3818, with size, area and mass listed in Table 1. In Table 2, the alignment reference is shown for the testing chips. In specific, ‘GOOD’ decision of alignment will be made when 90% quantity or 90% mass can be obtained. Especially, the initial operating conditions for the MLCC alignment system [1] are v1= 0.015 m/s, v2=0.043 m/s and L=4.000 mm, where v1 denotes the forward velocity of a feeder, while v2 denotes the return velocity of a feeder. In the meanwhile, L indicates the transfer distance of a feeder [2].
Table 1 Testing chips of MLCC
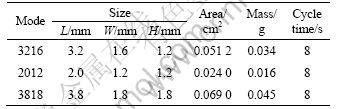
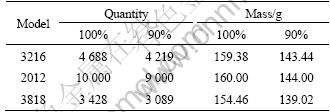
Table 2 Alignment reference for testing chips
The principle of MLCC alignment system can be briefly explained as follows. The chips of MLCC are dropped freely under gravitation from a chute as shown in Fig.2. Then v1 would make chips move forward by not exceeding a static friction between each chip and feeder floor, whereas v2 would make chips move back by exceeding the static friction. Consequently, this kind of iterating motion can result in the vibration which can further induce the alignment. It can be noted that the rugged terrains in Fig.2 will play an important role in alignment, by incorporating the vibrating floor of feeder [1].
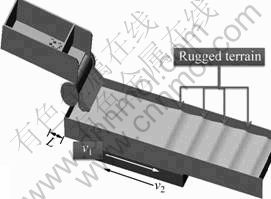
Fig.2 Schematic diagram of MLCC alignment system
2.2 Result of testing performance verification
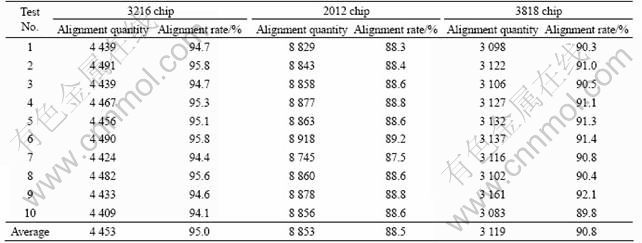
For each chip, ten experiments have been made, as shown in Table 3. The average alignment quantities and rates are 4 453 and 95% for 3216 chip, 8 853 and 88.5% for 2012 chip and 3 119 and 90.8% for 3818 chip. Even though 2012 chip has reached 88.5% in alignment rate below than 90% of GOOD alignment, the MLCC alignment system can be accepted for practical use because the average manual alignment is just 80%. In other words, the developed MLCC alignment system has been upgraded to a great extent, compared with the manual alignment.
3 Response surface method (RSM) and optimum conditions
3.1 RSM
Based on the successfully developed MLCC alignment system, the optimal transfer conditions will be explored by using RSM [3]. In specific, RSM is used for finding the optimal values of three design factors, v1, v2 and L, for chip feeding motion of the developed MLCC alignment system. By using ADAMS? [4], 30 chips of 3216 chip have been simulated.
Table 3 Results of testing performance verification
Each chip has been constrained by the contact condition which can realize colliding effects between each other. For each simulation, the elapse time of transferring chips is set to be 8 s, the same as the practical operation of the developed MLCC alignment system. The simulation resolution is set to have 900 steps. The flowchart of RSM is summarized in Fig.3.
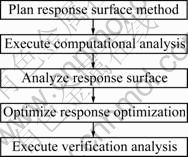
Fig.3 Flowchart for response surface method
The RSM with the central composite design (CCD) method [5] is used to approximate a response variable (i.e., transfer credit in this work). In the CCD method, each design variable can be selected by using MiniTAB? [6-7], only considering the lower and upper bounds. In addition, total 20 ADAMS? simulations are performed with three design variables, as shown in Table 4.
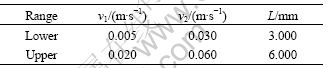
The CCD has added the 2k factorial design at axial and center points in order to estimate the change of design variables according to the level changes of response variables, which would be resulted from fewer simulations or experiments. The CCD is composed of cube model and axial model. In this work, the cube model of CCD is used, as listed in Table 5. Figure 4 shows one of the simulation results using ADAMS? according to the design of experiment shown in Table 4. Table 6 lists the range of design variables for CCD. Here α for CCD is usually chosen to the maintain rotatability in indicating the distance between the center.
3.2 Result of RSM
In Table 4, “Transfer credit” indicates the performance index for each set of design variables (or operating conditions). In the simulation of ADAMS?, each chip can get four transfer credits when it passes over four specified (rugged) terrains (which are needed for alignment of chips), as shown in Fig.4. Actually, when each chip should pass over the first terrain, it can have one transfer credit. It follows that the full transfer credit is 120 when 30 chips can pass over four terrains in 8 s.
It can be noticed that transfer credit can take a value of zero. In simulation, only 30 chips are simulated rather than actual number of some thousands chips. In practice, a lot of chips can result in the interaction (between each other) which could push chips over four rugged terrains. Thus, the interaction effect of only 30 chips can be much lower than that of some thousands chips. This can make the transfer credit take a value of zero. In addition, the reason why only 30 chips are selected as a simulation model is that its simulation time in ADAMS? is about 1.5 h for each simulation. The total simulation time amounts to 30 h for 20 cases.
Table 4 Simulation result using ADAMS?
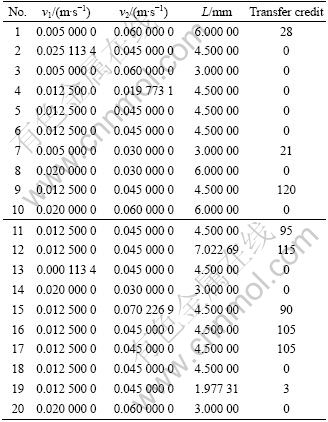
Table 5 Cube model of CCD
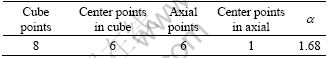
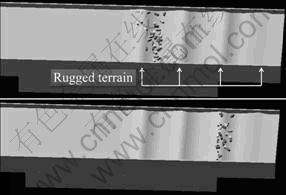
Fig.4 Simulation of ADAMS?
Table 6 Range of design variables
By using MiniTAB?, the model of response surface has been established based on the simulation results according to CCD. Especially, a quadratic polynomial model has been estimated by using model fitting. For both the construction of response surface and the estimation of regression equation, a full quadratic form of estimation model has been established by considering the response surface forms for all the design variables. Then, by using residual analysis, lack-of-fit, and the coefficient of determination, the decision on the compatibility of selected regression model has been made. When the selected model cannot be compatible, the response surface model can be reduced by pooling the terms which are not significant in the variance analysis. Through this process, a final regression model can be re-established.
Figure 5 shows the final model of response surface regression. In specific, for any model of response surface, the value of P for each term has been checked. Then, from the largest P value, pooling of one term can be made so that a model can be fitted. After fitting, R-sq and lack-of-fit can be confirmed in Fig.5. As a result, it follows that “Vel1*Vel2”, “Vel2*Length” and “Vel2* Length” are not significant, which in turn are ruled out, as shown in Fig.5 [8].
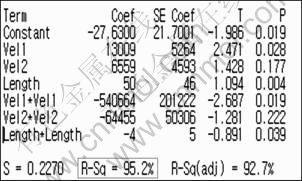
Fig.5 Final model of response surface regression
In order to evaluate the compatibility of surface regression model, both residual analysis and analysis of variance (i.e., ANOVA) are used. Figure 6 shows the normal probability plot of the residuals. The final model of surface regression is in good accordance with the normal distribution.
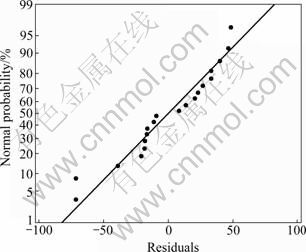
Fig.6 Normal probability plot of residuals for transfer credit
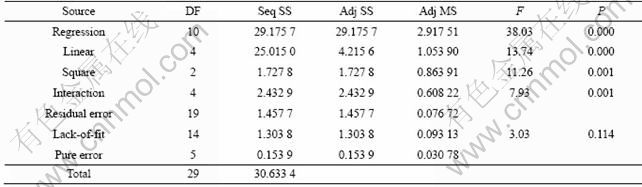
Table 7 shows the ANOVA result for transfer credit. It can be noticed that the final model of surface regression is turned out to be compatible since lack-of-fit of 0.114 is greater than 0.05 (95%). Besides, the coefficient of determination (i.e., R-sq) of 95.2% denotes that the final model of regression surface is valid.
Based on the results of analyses, transfer credit, T, (which denotes the performance of chip transfer according to v1, v2, and L in ADAMS simulations) can be obtained in a form of quadratic polynomial as
T=-27.63+13 009v1+6 559v2+50L-540 664 -
-
64 455 -4L2 (1)
3.3 Optimum conditions
In order to figure out the optimal transfer conditions of v1, v2 and L, the tool of response optimization in MiniTAB? has been used based on Eq.(1). As mentioned before, this optimization seeks for ‘larger-the-better characteristics’ since the response variable, i.e. T, would be better if it could be close to the full credit of 120. Under the constraint of 110≤T≤120, the optimal transfer conditions satisfying ‘larger-the-better characteristics’, are v1=0.019 m/s, v2=0.050 5 m/s and L=5.545 4 mm.
Table 7 ANOVA result for transfer credit
4 Application to prototype of MLCC system
The optimal conditions, v1=0.019 m/s, v2=0.050 5 m/s and L=5.545 4 mm, resulted from the response optimization tool of MiniTAB?, have been verified by being assigned to the prototype of MLCC alignment system shown in Fig.1. Especially, the operation result of the MLCC alignment system using the initial conditions (v1=0.015 m/s, v2=0.043 m/s, L=4.000 mm) is compared with those of the MLCC alignment system using the optimal conditions, as shown in Fig.7. It can be noticed that the alignment rate using the optimal conditions has been increased by 1.5%, compared with the case of operation using the initial conditions for 3216 chip (see Table 8).
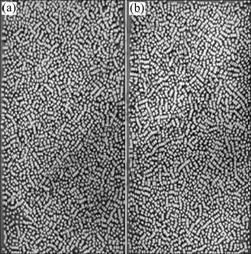
Fig.7 Results of operations for prototype of MLCC system using initial and optimal conditions
Table 8 Comparison of operations using initial and optimal conditions for 316 Chip

5 Conclusions
1) Based on the successfully developed MLCC alignment system, the optimal transfer conditions have been explored by using RSM. The RSM with CCD method has been used to approximate a response variable, i.e., transfer credit. The simulations using ADAMS? has been performed according to the cube model of CCD. By using MiniTAB?, the model of response surface has been established based on the simulation results. In order to evaluate the compatibility of surface regression model, both residual analysis and analysis of variance have been used to show that the final model of surface regression is in good accordance with normal distribution. Based on the results of analyses, the performance of chip transfer has been obtained in a form of quadratic polynomial.
2) The optimal conditions resulted from the response optimization tool of MiniTAB? have been verified by being assigned to the prototype of MLCC alignment system. It is shown that the alignment rate using the optimal conditions has been increased by 1.5%, compared with the case of operation using the initial conditions.
Acknowledgement
This work was partially supported (in part) by the Solomon Mechanics Inc.
References
[1] KIM K H, OH S R, RHIM S S. Fiducial mark recognition algorithm and stage control for MLCC alignment [J]. Korean Society of Mechanical Engineers, 2008: 215-217.
[2] SHIN O C, JUNG S R, JUNG S H, KIM S I, JUNG W J, KIM J M. Development of chip align automation system for second firing of multi-layer ceramic capacitor [J]. Korean Society of Manufacturing Process Engineers, 2009, 6: 225-228.
[3] SONG C G, JO B G. MSC.ADAMS for multibody dynamics analysis [R]. 2007.
[4] KIM W C, KIM J J, PARK B W, PARK S H, PARK T S, SONG M S, LEE S Y, LEE Y J, JEON J W, CHO S S. Introduction to Statistics [R]. 2005: 309-356.
[5] MYERS R H, MONTGOMERY D C. Response surface methodology [M]. New York: John Wiley & Sons Inc, 1995: 77-112.
[6] LEE S B. Minitab user handbook [M]. Korea: Eretec, 2002: 34-71.
[7] LEE S H. Engineering data analysis with statistics taken to MiniTAB [R]. 2006: 627-675.
[8] JUNG D W, CHUNG W J, KIM H C, BANG Y M, YOON Y M. Six sigma robust design of fork park for LCD transfer system [C]// World-Multi Conference on Systemics, and Cybernetics, Informatics. Orlando, Florida, USA, 2006: 347-352.
(Edited by YANG Bing)
Foundation item: Work supported by the Second Stage of Brain Korea 21 Projects
Received date: 2010-06-28; Accepted date: 2010-11-30
Corresponding author: CHUNG Won-jee, Professor, PhD; Tel: +82-55-213-3624; E-mail: wjchung@changwon.ac.kr

