Effect of cavitation bubble collapse on hydraulic oil temperature
来源期刊:中南大学学报(英文版)2016年第7期
论文作者:沈伟 张健 孙毅 张迪嘉 姜继海
文章页码:1657 - 1668
Key words:cavitation; bubble collapse; hydraulic oil temperature; Rayleigh–Plesset equation; cone-type throttle valve
Abstract: Cavitation bubble collapse has a great influence on the temperature of hydraulic oil. Herein, cone-type throttle valve experiments are carried out to study the thermodynamic processes of cavitation. First, the processes of growth and collapse are analysed, and the relationships between the hydraulic oil temperature and bubble growth and collapse are deduced. The effect of temperature is then considered on the hydraulic oil viscosity and saturated vapour pressure. Additionally, an improved form of the Rayleigh–Plesset equation is developed. The effect of cavitation on the hydraulic oil temperature is experimentally studied and the effects of cavitation bubble collapse in the hydraulic system are summarised. Using the cone-type throttle valve as an example, a method to suppress cavitation is proposed.
J. Cent. South Univ. (2016) 23: 1657-1668
DOI: 10.1007/s11771-016-3220-z

SHEN Wei(沈伟)1, ZHANG Jian(张健)2, SUN Yi(孙毅)3, ZHANG Di-jia(张迪嘉)4, JIANG Ji-hai(姜继海)4
1. Department of Mechatronics Engineering, University of Shanghai for Science and Technology,
Shanghai 200093, China;
2. Department of Mechatronics Engineering, Harbin University of Commerce, Harbin 150000, China;
3. Beijing Institute of Precision Mechatronics and Control Equipment, Beijing 100076, China;
4. School of Mechatronics Engineering, Harbin Institute of Technology, Harbin 150000, China
 Central South University Press and Springer-Verlag Berlin Heidelberg 2016
Abstract: Cavitation bubble collapse has a great influence on the temperature of hydraulic oil. Herein, cone-type throttle valve experiments are carried out to study the thermodynamic processes of cavitation. First, the processes of growth and collapse are analysed, and the relationships between the hydraulic oil temperature and bubble growth and collapse are deduced. The effect of temperature is then considered on the hydraulic oil viscosity and saturated vapour pressure. Additionally, an improved form of the Rayleigh–Plesset equation is developed. The effect of cavitation on the hydraulic oil temperature is experimentally studied and the effects of cavitation bubble collapse in the hydraulic system are summarised. Using the cone-type throttle valve as an example, a method to suppress cavitation is proposed.
Key words: cavitation; bubble collapse; hydraulic oil temperature; Rayleigh–Plesset equation; cone-type throttle valve
1 Introduction
The occurrence of cavitation has highly unfavourable effects in hydraulic systems, such as efficiency reduction, vibration, noise and hydraulic pump failure [1-2]. Cavitation occurs in hydraulic systems when a partial low pressure region is formed where the pressure is below the hydraulic oil saturation vapour pressure which corresponds to the local working temperature. Bubble inception, growth and collapse are the typical phases of cavitation. The damage induced by cavitation bubble collapse was first identified in the 19th century [3]. Bubble collapse can cause extreme pressure and temperature, which can reach 4800 K and 150 MPa in the final stages of collapse, respectively [4]. Great attention has been paid to these extreme collapse conditions. The earliest in-depth theoretical and experimental research into bubble nucleation, growth and collapse was carried out by Rayleigh [5]. In the following fifty years, the damage of bubble collapse became better understood [6-7]. The current literature suggests that bubble clouds that continuously collapse can induce pressures higher than 1000 MPa, which can cause serious erosion at solid surfaces [8]. The unfavourable influence of the thermal characteristics of cavitation in the hydraulic system is enhanced at elevated hydraulic oil temperatures. The oil viscosity decreases with increasing temperature, which in turn increases leakage and decreases the volumetric efficiency. The increase in oil temperature also causes an increase in the Reynolds number. At high Reynolds numbers flow instabilities result in turbulence and induce strong pressure ripples. Additionally, an increase in hydraulic oil temperature decreases its bulk modulus. The bulk modulus is an important physical parameter which has a significant effect on the positional precision, power level, response time and stability of the hydraulic system [9].
The processes of bubble nucleation and collapse are extremely complex with many aspects requiring further investigation. Gaining a better understanding of the bubble collapse process is the objective of the present work. The changes in the hydraulic oil temperature caused by bubble collapse are studied and a relationship between the bubble radius and hydraulic oil temperature is determined. The results can provide a useful reference for suppressing cavitation.
2 Governing equation
The thermodynamic principle is firstly applied to improve the Rayleigh–Plesset equation and the relationship between the hydraulic oil temperature and bubble radius during collapse is deduced. The results show that the presence of micrometer-sized free gas nuclei in the hydraulic oil is a prerequisite for cavitation. The following assumptions are made for the nucleated cavitation bubbles.
1) The bubble maintains a spherical shape during growth;
2) During bubble growth, the thickness of the bubble wall is constant;
3) After the bubble is formed, the forces acting on it are in equilibrium;
4) The gas pressure in the bubble is uniformly distributed in the radial direction;
5) Free gas nuclei include hydraulic oil vapour and gas;
6) There are no chemical interactions in the bubble;
7) The hydraulic oil is incompressible.
When cavitation occurs, the pressure in bubble is
 (1)
(1)
where pv is the vapour pressure (Pa) and pg is the gas pressure (Pa).
The gas is considered to be an ideal gas. From the ideal gas equation, the following expression is obtained:
 (2)
(2)
where R0 is the initial bubble radius (m); R is the bubble radius at arbitrary time (m); pg0 is the initial pressure of the gas (Pa); γ is the polytropic exponent; γ=1 represents an isothermal process, and γ=1.4 represents an adiabatic process.
Taking into account the contribution of surface tension and static equilibrium, the following equation is obtained for the initial state:
 (3)
(3)
where p0 is the hydraulic oil pressure when a gas nucleus is in dynamic equilibrium at the initial time (Pa) and σ is the hydraulic oil surface tension coefficient (N/m).
Through the ideal gas equation, the following expression is also obtained:
 (4)
(4)
where Tb0 is the initial bubble temperature (K) and Tb is the bubble temperature at an arbitrary time (K).
According to the first law of thermodynamics, the following is obtained for the bubble growth process:
 (5)
(5)
where Qb is the heat absorbed in the bubble growth process (J); Ub is the internal energy of the bubble (J); and Vb is the bubble volume (m3).
Considering the thermodynamic characteristics of an ideal gas, the following is obtained:
 (6)
(6)
where cvg is the specific heat at a constant volume for the mixed gas (J/(kg·K)), and mb is the bubble mass (kg).
From Eqs. (1)–(6), the following is obtained:

 (7)
(7)
In light of the first law of thermodynamics, the heat absorbed by the bubble is equal to the heat generated from the hydraulic oil when the bubble grows, namely:
 (8)
(8)
 (9)
(9)
where Ul is the internal energy of the hydraulic oil (J); p∞ is the hydraulic oil pressure far from the bubble (Pa); and Vl is the hydraulic oil volume (m3).
Changes in the hydraulic oil volume and pressure are ignored leading to [10]
 (10)
(10)
where cvl is the specific heat at constant volume for the hydraulic oil (J/(kg·K)); ml is the hydraulic oil mass (kg); and Tl is the hydraulic oil temperature (K).
From Eqs. (7)–(10), the following is obtained:


 (11)
(11)
The specific heat at constant volume of the mixed gas changes with the change from the vapour to the liquid phase. From Ref. [11], the following equation is obtained
 (12)
(12)
where Ki is the mass fraction of I substance; cpi is the specific heat at constant pressure of I substance; Kv is the mass fraction of vapour; △V is the specific volume difference between vapour and hydraulic oil; and L is the latent heat of vaporization of the oil (J/kg).
Because the dissolved gas in the hydraulic oil is mainly air, the non-dissolved gas in bubbles is assumed to also be air, and the volume fraction between the air and the oil vapour is assumed to be 1:1. Thus, the mass fractions of air and oil vapour are 10.2% and 89.8%, respectively.
The density of air is 1.205 kg/m3 at 20°C. Thus, the density of the bubble is 5.9104 kg/m3.
The specific heat at constant volume of the mixed gas changes is
 (13)
(13)
where ρv0 is the initial hydraulic oil vapour density (kg/m3), and ρ is the oil density (kg/m3).
The bubble mass mb is
 (14)
(14)
where ρg is the density of gas in the bubble (kg/m3).
By substituting Eq. (13) and Eq. (14) into Eq. (11), the following expression for the hydraulic oil temperature during bubble growth process is obtained:


 (15)
(15)
The heat flux at the interface is supposed to be proportional to the temperature difference [12]:
 (16)
(16)
where h is the convective heat transfer coefficient of the bubble (W/(m2·K)).
In the absence of any validated correlation applicable to cavitating flows, the heat transfer coefficient is considered here as a tuning parameter.
The following equation is taken from Ref. [12]:
 (17)
(17)
where ρv is the hydraulic oil vapour density (kg/m3), and t is the time (s).
Because bubble collapse is extremely rapid this is often assumed to be an adiabatic process. However, this process is not perfectly adiabatic. It has been shown that the polytropic exponent (γ) is 1.3 [13].
The heat which is transferred from the bubble to the hydraulic oil by heat conduction is
 (18)
(18)
where λ is the heat conductivity of the oil (W/(m·K)); A is the bubble’s surface area (m2), A=4πR2; a is the thickness of the bubble wall (m); and △t is the time interval (s).
The heat transferred from the bubble to the hydraulic oil by heat convection is
 (19)
(19)
The heat transferred from the bubble to the hydraulic oil by heat radiation is
 (20)
(20)
where εl is the heat surface emissivity of the oil and σr is the Stefan–Boltzmann constant (5.67×10⁻⁸ W/(m2·K4)).
The total work done by the hydraulic oil on the bubble when the bubble collapses is
 (21)
(21)
At an arbitrary time, the hydraulic oil does work on the bubble, as given by
 (22)
(22)
Equation (23) is based on the first law of thermodynamics where the heat transferred from the oil to the surroundings is neglected. When the bubble temperature is lower than the oil temperature, the energy change of the oil is
 (23)
(23)
where △U is the change of the internal energy of the oil (J).
When the bubble temperature is higher than the hydraulic oil temperature
 (24)
(24)
 (25)
(25)
From Eq. (4) and Eqs. (18)-(25), the hydraulic oil temperature during the bubble collapse process is


 (26)
(26)
The bubble radius is obtained from the Rayleigh– Plesset equation accommodating heat effects [14]:

 (27)
(27)
where μ is the dynamic viscosity of the oil (Pa·s), pv(Tl) is the saturated vapour pressure of the oil at the oil temperature (Pa); and pv(Tb) is the saturated vapour pressure of the oil at the bubble temperature (Pa).
According to Ref. [15], it is obtained that
 (28)
(28)
Substituting Eq. (17) and Eq. (28) into Eq. (27) the following expression is obtained:
 (29)
(29)
Assuming the saturated vapour pressure of the oil varies linearly [16-17]:
 (30)
(30)
where T0 is the initial oil temperature (K).
According to the Clausius–Clapeyron equation:
 (31)
(31)
The Nusselt number is then introduced as [18]:
 (32)
(32)
where Re is the Reynolds number [19], expressed as
 (33)
(33)
The ratio of the kinematic viscosity to the thermal diffusivity is given by the Prandtl number:
 (34)
(34)
where cpl is the specific heat at constant pressure (J/(kg·K)).
The convective heat transfer coefficient of the bubble is
 (35)
(35)
The thermal diffusivity of the oil is
 (36)
(36)
From Eqs. (24)-(29), the following expression is obtained:
 (37)
(37)
Given the changes in the viscosity of the hydraulic oil with temperature and pressure, the dynamic viscosity can be expressed as [20]

 (38)
(38)
An improved Rayleigh–Plesset equation is derived from Eq. (29), Eq. (30), Eq. (37) and Eq. (38):


 (39)
(39)
The value of oil temperature Tl in Eq. (39) is obtained from Eq. (26).
3 Numerical analyses
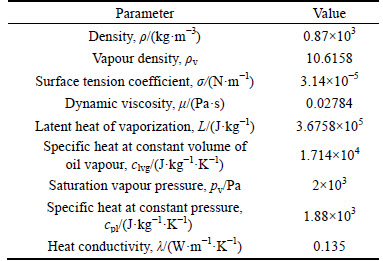
The fourth-order Runge–Kutta method is applied to the numerical computations. The commonly used antiwear hydraulic oil L-HM32 was chosen as the model hydraulic oil. The saturated vapour pressure of the oil was taken as pv=2 kPa [21]. The performance parameters of L-HM32 hydraulic oil at 20°C are listed in Table 1; for the purpose of the computations, it is assumed that they do not change with temperature.
Table 1 Performance parameters of L-HM32 hydraulic oil
When cavitation does not occur in the hydraulic system, the free gas nucleus is under static equilibrium. However, when the hydraulic system pressure is lower than the hydraulic oil saturation vapour pressure, namely, p∞
v, cavitation occurs. The gas nucleus is assumed to be in the critical condition before the occurrence of cavitation, with the pressure of the hydraulic system being equal to the oil saturation vapour pressure. The initial radius (RR0) of the free gas nucleus is set at 4.5μm [22]. The minimum bubble radius is 0.5μm [23]. pg0=13.9556 Pa can be obtained from Eq. (3). Because it is difficult to determine the thickness of the bubble wall (a), this is assumed to be 0.09 μm. The initial hydraulic oil temperature is assumed to be 293 K.
Because the pressure distribution of the hydraulic system is difficult to measure accurately after the onset of cavitation, the fluid-structure coupled finite element method (FEM) is chosen to simulate the pressure distribution. The throttle valve was chosen as the subject and the valve body was analysed by ADINA. ADINA is the abbreviation of Automatic Dynamic Incremental Nonlinear Analysis. ADINA is the product of ADINA R&D, Inc.. ADINA R&D, Inc.was founded in 1986 by Dr.K.J. Bathe. The exclusive mission of the company is the development of the ADINA System for linear and nonlinear finite element analysis of solids and structures, heat transfer, CFD and electromagnetics. ADINA also offers a comprehensive array of multiphysics capabilities including fluid-structure interaction and thermo- mechanical coupling. Some of the nonlinear structural analysis capabilities of ADINA are offered as Solution 601/701 of NX Nastran by Siemens PLM Software. The ADINA CFD program provides state-of-the-art finite element and control volume capabilities for incompressible and compressible flows. The flows may contain free surfaces and moving interfaces between fluids, and between fluids and structures. An arbitrary Langrangian-Eulerian (ALE)formulation is used.The procedure used in ADINA CFD is based on finite element and finite volume discretization schemes, with a most general and efficient solution approach. General flow conditions in arbitrary geometries can be solved. Figure 1 shows the valve flow channel condition.

Fig. 1 Schematic diagram of flow channel of valve body
The purpose of simulation is to get the pressure distribution of the valve flow channel, so the cavitation model isn’t involved in simulation.
Because the cross-sectional area decreases when the hydraulic oil flows through the valve port, the flow velocity will increase and the flow will become turbulent. The hydraulic oil is assumed to be incompressible. Thus, the standard k–ε turbulence model is used:
 (40)
(40)

 (41)
(41)
where k is the turbulent kinetic energy (kg·m2/s2); ε is the turbulent kinematic dissipation rate (m2/s3); U is the velocity vector matrix of the hydraulic oil (m/s); μt is the turbulent viscosity (Pa·s); and S is the average strain rate tensor.
The turbulent viscosity is
 (42)
(42)
The coefficients cμ, σk, σε, c1ε and c2ε in Eqs. (40)-(42) are adjustable constants; their values are cμ=0.09, σk=1, σε=1.3, C1ε=1.44 and C2ε=1.92 [24].
In ADINA, the turbulent kinetic energy k is
 (43)
(43)
 (44)
(44)
where u is the hydraulic oil velocity (m/s); X is the characteristic length (m); the value of X is equal to the pipe diameter; the value of k is taken as 1.5(0.05U)2.
The time step is set to 0.001.
The simulation parameters are listed in Table 2. Figure 2 shows the pressure and flow velocity distribution in the valve flow channel.
Table 2 Simulation parameters

Figure 2 shows that the highest flow velocity and the lowest pressure occur at the bottom of the valve core, indicating that cavitation is the strongest in this region. Thus, the change of pressure near the bottom of the valve core is chosen for the analysis.
We choose some points from the bottom of the valve core to the flow channel downstream. The pressure of these points is obtained. The simulation results show that the change of the hydraulic oil pressure is linear at the location of cavitation:

Fig. 2 Pressure (a) and velocity (b) distributions in flow channel
 (45)
(45)
When the valve opening is 10mm, the mass of the vertical channel is taken as the mass of the hydraulic oil, ml=1.2572×10⁻⁴kg.
The Eq. (45) is used to solve Eq. (39) in the numerical calculation.
The relationship between the bubble radius and time is shown in Fig. 3. In the expansion phase, the polytropic ratio (γ) is taken as 1.0001 and in compression phase, it is taken as 1.35 [12].
The classic Raleigh-Plesset equation acquires the relationship between the bubble radius and time, shown in Fig. 4. Comparing between Figs. 3 and 4, it can be obtained that the result from the modified Raleigh- Plesset equation is closer to the real situation under the same condition. The bubble radius from the classic Raleigh-Plesset equation is much bigger than it from the modified Raleigh-Plesset equation. So, the modified Raleigh-Plesset equation is superior to the classic Raleigh-Plesset equation.
The temperature of hydraulic oil in the expansion phase can be obtained from Eq. (15). Figure 5 shows the change of the hydraulic oil temperature under the influence of a single bubble during expansion.The temperature of the hydraulic oil at the end of bubblegrowth is the initial temperature of bubble collapse (Tl), which in this case is 292.3743K.

Fig. 3 Relationship between bubble radius with time during expansion (a) and compression (b)

Fig. 4 Relationship between the bubble radius with time during expansion (a) and compression (b) from classic Rayleigh– Plesset equation
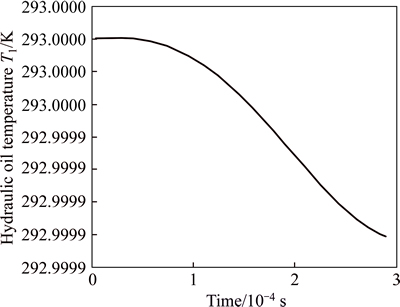
Fig. 5 Change of hydraulic oil temperature during bubble expansion
The temperature of hydraulic oil in the compression phase can be obtained from Eq. (26). Figure 6 shows the hydraulic oil temperature in the bubble during compression. It can be seen that the oil temperature decreases slightly in the initial stages of bubble collapse. In the initial stages of collapse, the hydraulic oil does work on the bubble. The bubble temperature decreases after expansion, resulting in hear transfer from the oil to the bubble and a decrease in the temperature of the oil. Figure 3(b) shows that the rate of compression is highest in the final stages of bubble collapse. Because the bubble radius reduces very quickly, the bubbles release a large amount of heat to the hydraulic oil, causing the temperature of the oil to increase. Figure 6 also shows that the temperature of the hydraulic oil around the bubble rapidly increases with the increase of the oil pressure. This indicates that in the hydraulic system, the faster the pressure increases around the bubble, the faster the temperature of the oil increases.

Fig. 6 Change of hydraulic oil temperature during bubble compression
4 Experimental results
To verify the influence of bubble collapse on the hydraulic oil temperature and to investigate the flow channel conditions of a practical industrial valve, polymethyl methacrylate (PMMA) was chosen to produce the model valve. The flow channel of the model valve was designed to be identical to the flow channel of a real valve. The design of the experimental system is shown in Fig. 7.
The opening of the valve can be adjusted using button 5. The control inlet pressure and the backpressure of the model valve can be controlled by adjusting the relief valve 3 and the throttle valve 11. The pressure is displayed on the pressure meters 2 and 9. Pressure transducers 4 and 8 detect the pressure in front of the model valve and the pressure in the planar straight flow channel of the model valve, respectively. Pressure transducer or temperature transducer 7 is used to measure the pressure or temperature in the vertical flow channel of the model valve. Flow transducer 10 detects the flow rate of the model valve. The pressure, temperature, and the flow rate data are transferred into a computer by a data acquisition system. The parameters
of the experimental system are listed in Table 3 and a photograph of the setup is shown in Fig. 8.

Fig. 7 Design of the experimental system:
Table 3 Parameters of experimental system


Fig. 8 Photograph of experimental system
The measurement range of pressure transducer is 0-15 MPa. The precision of pressure transducer is 0.1%. The measurement range of temperature transducer is 0-300 °C. The precision of temperature transducer is 0.5%. The measurement range of flow transducer is 0- 25 L/min. The precision of flow transducer is 0.5%. The normal pressure of vane pump is 6.3 MPa.
Figure 9 shows the cavitation phenomena under a valve with a 10 mm opening; the system pressure is 1- 5 MPa and the backpressure is 0. Figure10 shows the cavitation phenomena under a valve with a 12 mm opening; the system pressure is 1-5MPa and the backpressure is 0.

Fig. 9 Cavitation images under a valve with 10 mm opening at different pressures:
Figures 9 and 10 show that the cavitation intensity gradually increases with the increase of the system pressure and the opening of the valve. When the cavitation intensity is high, as shown in Figs. 9(d) and (e) and Figs. 10(d) and (e), luminescence appears, likely because of the temperature increase in the oil owing to the large number of collapsing bubbles. The flow rate increases with the increase of the opening of the valve, so the increase of the opening of the valve causes the increase of oil velocity. As the above-mention reasons, the cavitation increases with the opening of the valve.
Figure 11 shows the change of flow rate with backpressure of between 0-0.5 MPa and a system pressure of 5 MPa for both valve openings.

Fig. 10 Cavitation images under a valve with a 12 mm opening at different pressures:
Figure 11 shows that with increasing the opening of valve, the flow rate of system increases.
The region between the temperature measuring point and the valve core is shown in Fig. 12.
Figure 13 shows the change of temperature at the bottom of the valve core when the system pressure is adjusted from 1 to 5MPa for 10 and 12 mm valve openings.
Figure 14 shows the change in temperature at the bottom of valve core with backpressure of between 0-0.5 MPa and a system pressure of 5 MPa for both valve openings.
Figure 13 shows that with increasing system pressure, the cavitation intensity increases and the increase of the hydraulic oil temperature caused by bubble collapse is larger. Meanwhile, the trend of hydraulic oil temperature increasing becomes more obvious with increasing cavitation intensity. Figure 14 shows that the hydraulic oil temperature increases slightly with the increase of the backpressure. This is because when the backpressure is increased, the pressure around the bubble increases and the bubble collapse tends to be more violent. This is consistent with the simulation result. Figures 13 and 14 show that the change of the hydraulic oil temperature is lower than that from the simulation in the final stages of bubble collapse. This is because in the practical hydraulic system, the hydraulic oil continuously flows and the heat produced by the bubble collapse diffuses into the surrounding environment. Meanwhile, the pressure increases around bubble in the simulation faster than in the actual situation, which is indirectly confirmed by Fig. 14.

Fig. 11 Flow rate change with backpressure of 0-0.5 MPa and a system pressure of 5 MPa for both valve openings

Fig. 12 Region between temperature transducer and valve core

Fig. 13 Temperature change at bottom of valve core when system pressure is adjusted from 1 to 5 MPa for valve openings of 10 and 12 mm

Fig. 14 Temperature change at bottom of valve core with a backpressure of 0-0.5 MPa and a system pressure of 5MPa for valve openings of 10 and 12mm
The increase of the temperature of the hydraulic oil is closely related to the bubble collapse velocity. Namely, the higher the velocity of the bubble collapse, the higher the hydraulic oil temperature. To inhibit the influence of bubble collapse on the oil temperature, the backpressure of the hydraulic system should be adjusted to a reasonable value while still meeting the working requirements of the system. Through adjusting the backpressure, the pressure drop at the valve port is reduced, as well as the extent of cavitation.
The region between the pressure measuring point and the valve core is shown in Fig. 15.

Fig. 15 Region between pressure transducer and valve core
Figure 16 shows the change of pressure at the bottom of valve core with backpressure of between 0- 0.5 MPa and a system pressure of 5 MPa for both valve openings.
Figure 16 shows that the pressure at the bottom of valve core can appear negative value. Then it is proved that the pressure distribution shown in Figure 2 is credible.

Fig. 16 Pressure change change with backpressure of between 0-0.5 MPa and a system pressure of 5 MPa for both valve openings
5 Conclusions
1) The effect of temperature is considered on the hydraulic oil viscosity and saturated vapour pressure, and an improved form of the Rayleigh–Plesset equation is developed.
2) The relationships between the hydraulic oil temperature and the bubble growth and collapse processes are deduced.
3) The bubble collapse has a great influence on the hydraulic oil temperature, which is most pronounced during the final stages of collapse when the velocity is highest.
4) In terms of the throttle valve, to inhibit the influence of bubble collapse on the hydraulic oil temperature, the backpressure of the hydraulic system should be adjusted to a reasonable value while meeting the working requirements of the system. Through adjusting the backpressure, both the pressure drop at the valve port and the occurrence of cavitation are reduced.
References
[1] DING Hai-bo, VISSER F C, JIANG Y, Furmanczyk M. Demonstration and validation of a 3D CFD simulation tool predicting pump performance and cavitation for industrial applications [J]. Journal of Fluids Engineering, 2011, 133(1): 11101-11114.
[2] SHEN Wei, Mai Yun-fei, Su Xiao-yu, ZHAO Jin-bao, JIANG Ji-hai. A new electric hydraulic actuator adopted the variable displacement pump[J]. Asian Journal of Control, 2016,18(1): 178-191.
[3] Lind S, Phillips T. Bubble collapse in compressible fluids using a spectral element marker particle method. Part 2. Viscoelastic fluids [J]. International Journal for Numerical Methods in Fluids, 2013, 71(9): 1103-1130.
[4] Merouani S, Hamdaoui O, Rezgui Y, Guemini M. Energy analysis during acoustic bubble oscillations: Relationship between bubble energy and sonochemical parameters [J]. Ultrasonics, 2014, 54(1): 227-232.
[5] Rayleigh L. On the pressure developed in a liquid during the collapse of a spherical cavity [J]. Philosophical Magazine, 1917, 34: 94-98.
[6] Lind S, Phillips T. The influence of viscoelasticity on the collapse of cavitation bubbles near a rigid boundary [J]. Theoretical and Computational Fluid Dynamics, 2012, 26(1): 245-277.
[7] ZHOU Jun-jie, VACCA A, CASOLI P. A novel approach for predicting the operation of external gear pumps under cavitating conditions [J]. Simulation Modelling Practice and Theory, 2014, 45: 35-49.
[8] Singh R, Tiwari S, Mishra S. Cavitation erosion in hydraulic turbine components and mitigation by coatings: Current status and future needs [J]. Journal of Materials Engineering and Performance, 2011: 1-13.
[9] SHEN Wei, JIANG Ji-hai, SU Xiao-yu, KARIMI H R. Control strategy analysis of the hydrualic hybrid excavator[J]. Journal of The Franklin Institute, 2015, 352(2):541-561.
[10] Ahn K, Anh H. Inverse double NARX fuzzy modeling for system identification [J]. Mechatronics, IEEE/ASME Transactions on, 2010, 15(1): 136-148.
[11] XU Kai, LU Wen-qiang. Research on specific heat at constant pressure of non-equilibrium phase transitions in vapour-liquid two phase system [J]. Chinese Science Bulletin, 2007, 52(8): 875-879.
[12] Franc J, Pellone C. Analysis of thermal effects in a cavitating inducer using Rayleigh equation [J]. Journal of Fluids Engineering, 2007, 129(8): 974-983.
[13] TIAN Hong, YANG Chen. Thermophysics model influence on the first closed characteristics of the collapse final stage of cavitation bubble [J]. Journal of Chongqing University, 2011, 34(6): 51-59. (in Chinese)
[14] Rodio M, Giorgi M, Ficarella A. Influence of convective heat transfer modelling on the estimation of thermal effects in cryogenic cavitating flows [J]. International Journal of Heat and Mass Transfer, 2012, 55: 6538-6554.
[15] Brennen C. Cavitation and bubble dynamics [M]. Oxford City: Oxford University Press, 1995.
[16] Goncalvès E, Patella R. Numerical study of cavitating flows with thermodynamic effect [J]. Computers & Fluids, 2010, 39(1): 99-113.
[17] Goncalvès E, Patella R. Constraints on equation of state for cavitating flows with thermodynamic effects [J]. Applied Mathematics and Computation, 2011, 217(11): 5095-5102.
[18] Ranz W, Marshall W. Evaporation from drops. Part I & II [J]. Chem Eng Prog, 1952(48): 141-146.
[19] Lind S J, Phillips T N. Spherical bubble collapse in viscoelastic fluids [J]. Journal of Non-newtonian Fluid Mechanics, 2010, 165(1/2): 56-64.
[20] MA Ji-en. Study on flow ripple and valve plate optimization of axial piston pump [D]. Hangzhou: Zhejiang University, 2009. (in Chinese)
[21] FAN Cun-de. Hydraulic technology handbook [M]. Shenyang: Liaoning Science and Technology Press, 2004: 57-62. (in Chinese)
[22] LOFSTEDT R, BARBER B P, PUTTERMAN S J. Toward a hydrodynamic theory of sonoluminescence [J]. Physics of Fluids: A-Fluid Dynamics, 1993, 5(11): 2911-2928.
[23] Bradley P. Barber R A H R. Defining the unknowns of sonoluminescence [J]. Physics Reports, 1997, 281: 65-143.
[24] LAUNDER B, SPALDING D. The numerical computation of turbulent flows [J]. Computer Methods in Applied Mechanics and Engineering, 1974, 3(2): 269-289.
(Edited by DENG Lü-xiang)
Foundation item: Projects(51505289, 51275123) supported by the National Natural Science Foundation of China
Received date: 2015-04-02; Accepted date: 2015-07-28
Corresponding author: SHEN Wei, PhD; Tel: +86-21-55270389; E-mail: shenwei@usst.edu.cn

