An early warning method for water inrush in Dongjiahe coal mine based on microseismic moment tensor
来源期刊:中南大学学报(英文版)2020年第10期
论文作者:马克 孙兴业 唐春安 王苏健 原富珍 彭宜霖 刘凯
文章页码:3133 - 3148
Key words:moment tensor inversion; water inrush; fault recognition; realistic failure process analysis
Abstract: Dongjiahe Coal Mine belongs to the Carboniferous Permian coal field which has a high degree of karst and fissure development. This paper takes the working face of Dongjiahe Coal Mine as an example; through the microseismic(MS) monitoring system arranged on the working face, the moment tensor theory was used to invert the focal mechanism solution of the anomalous area of the floor MS event; combining the numerical simulation and field data, the underlying floor faults were identified by the stress inversion method. The results show that: 1) Moment tensors were decomposed into three components and the main type of rupture in this area is mixed failure according to the relative criterion; 2) The hidden fault belongs to the reversed fault, its dip angle is approximately 70°, and the rupture length is 21 m determined by the inversion method of the initial dynamic polarity and stress in the focal mechanism; 3) The failure process of the fault is divided into three stages by numerical simulation method combined with the temporal and spatial distribution of MS events. The results can provide a reference for early warning and evaluation of similar coal mine water inrush risks.
Cite this article as: MA Ke, SUN Xing-ye, TANG Chun-an, WANG Su-jian, YUAN Fu-zhen, PENG Yi-lin, LIU Kai. An early warning method for water inrush in Dongjiahe coal mine based on microseismic moment tensor [J]. Journal of Central South University, 2020, 27(10): 3133-3148. DOI: https://doi.org/10.1007/s11771-020-4534-4.

J. Cent. South Univ. (2020) 27: 3133-3148
DOI: https://doi.org/10.1007/s11771-020-4534-4

MA Ke(马克)1, 2, SUN Xing-ye(孙兴业)1, 2, TANG Chun-an(唐春安)1, 2, WANG Su-jian(王苏健)3,
YUAN Fu-zhen(原富珍)1, 2, 4, PENG Yi-lin(彭宜霖)2, 5, LIU Kai(刘凯)6
1. State Key Laboratory of Coastal and Offshore Engineering, Dalian University of Technology,Dalian 116024, China;
2. Institute of Rock Instability and Seismicity Research, Dalian University of Technology,Dalian 116024, China;
3. Shannxi Coal and Chemical Technology Institute Company Limited, Xi’an 710065, China;
4. China Petroleum Pipeline Engineering Corporation, Langfang 065000, China;
5. School of Environmental Science, University of Liverpool, Liverpool L69 3BX, United Kingdom;
6. Department of Engineering Science, University of Oxford, Parks Road, OX1 3PJ, United Kingdom
 Central South University Press and Springer-Verlag GmbH Germany, part of Springer Nature 2020
Abstract: Dongjiahe Coal Mine belongs to the Carboniferous Permian coal field which has a high degree of karst and fissure development. This paper takes the working face of Dongjiahe Coal Mine as an example; through the microseismic(MS) monitoring system arranged on the working face, the moment tensor theory was used to invert the focal mechanism solution of the anomalous area of the floor MS event; combining the numerical simulation and field data, the underlying floor faults were identified by the stress inversion method. The results show that: 1) Moment tensors were decomposed into three components and the main type of rupture in this area is mixed failure according to the relative criterion; 2) The hidden fault belongs to the reversed fault, its dip angle is approximately 70°, and the rupture length is 21 m determined by the inversion method of the initial dynamic polarity and stress in the focal mechanism; 3) The failure process of the fault is divided into three stages by numerical simulation method combined with the temporal and spatial distribution of MS events. The results can provide a reference for early warning and evaluation of similar coal mine water inrush risks.
Key words: moment tensor inversion; water inrush; fault recognition; realistic failure process analysis
Cite this article as: MA Ke, SUN Xing-ye, TANG Chun-an, WANG Su-jian, YUAN Fu-zhen, PENG Yi-lin, LIU Kai. An early warning method for water inrush in Dongjiahe coal mine based on microseismic moment tensor [J]. Journal of Central South University, 2020, 27(10): 3133-3148. DOI: https://doi.org/10.1007/s11771-020-4534-4.
1 Introduction
As we all know, “water, fire, gas, dust, roof” are the five major disasters that seriously affect the safe and efficient production of coal mines. Nearly 50% of mine accidents are related to groundwater according to statistics [1, 2]. In recent years, the adverse effects of high-pressure water aquifers have attracted people’s attention due to increasing mining depth. Currently, there are roughly 16 billion tons of coal mines at risk of water inrush in northern China [3, 4]. Taking the Chenghe mining area in Shaanxi, China as an example [5], on March 24, 1999, a water inrush disaster occurred in the main flat of Huangling No. 1 Mine of Huangling Mining Company. The No. 1 mine had been shut down for 6 months, resulting in direct economic losses of more than 34 million yuan. On April 2, 2004, due to mining stress, the roof of Huangling No. 1 mine broke, and a water inrush disaster occurred between the working face and the aquifer, causing working face #402 and nearby areas to be flooded and direct economic loss of 48 million yuan. From 2010 to 2012, Tongchuan Mining Company Yuhua Coal Mine suffered a total of 6 water inrush disasters, and the instantaneous water inrush reached a maximum of 2000 m3/h, which caused serious threat to the normal production of the mine and the safety of personnel life.
At present, the research methods for water inrush can be classified into three categories, namely physical test, numerical simulation, and on-site monitoring. As a reliable research method, the physical test method is widely used in the research work of parameter sensitivity analysis and crack propagation path analysis. LI et al [6] proposed “triangle” water-inrush mode based on sidewall fracturing water-inrush mode and conducted similar simulation experiment to explore the position and formation process of water-inrush channel of collapse column. HU et al [7] established a laboratory water inrush test model of the fracture zone floor with a syncline axis based on the measured data of Baizhuang Coal Mine in China, and analyzed the permeability, sand inrush and Reynolds number during the water inrush. LIU et al [8] proposed that water inrush will occur when the value of fractal dimension of acoustic emission (FDAE) reaches the threshold and determined this value through the similar experiment of undersea mining. Above studies have analyzed the important parameters of water inrush process in detail, which provides an important theoretical basis for the prevention and control of water inrush.
The numerical simulation method can be divided into three categories: continuous method, discrete method and continuous-discrete coupling method according to different theory. LU et al [9] proposed a micro-mechanical model based on damage-seepage coupling and used a continuous finite element method to study the progressive development of cracks and water seepage in the floor during failure process. POULSEN et al [10] used PFC to establish a full-size longwall face model and studied the changes in permeability caused by cracks generated during mining. For the continuous coupling method, YAN et al [11] proposed a 2D seepage stress full coupling model based on the continuous-discrete method and verified the correctness through an example, which can be used in the field of coal mine water inrush.
The on-site monitoring method can more intuitively reflect the rock mass situation near the working face and thus evaluate the risk of water inrush. Scholars applied distributed optical fiber sensing technology, three-dimensional resistivity method and transient electromagnetic method to analyze the destruction characteristics and damage depth of coal seam floor [12, 13]. However, the distributed optical fiber sensing technology monitors the traditional strain; the monitoring range of the three-dimensional resistivity method depends on the layout of the borehole and the transient electromagnetic method cannot provide reliable monitoring results for certain rock layers, such as low resistance layers. Microseismic monitoring technology utilizes the acoustic properties of rock masses. It can continuously “catch” the fracture position of rock masses as a three-dimensional monitoring method, and its detection range and applicability are superior to the above methods. Therefore, microseismic monitoring technology has been applied by many scholars to study rock engineering problems [14-17]. Regarding the problem of coal mine water inrush, LI et al [18] analyzed the water inrush event of Laohutai Coal Mine in Fushun, China through microseismic monitoring, and found that the wave velocity ratio, amplitude, and frequency of microseismic event before the accident was obviously abnormal. CHENG et al [19] analyzed the microseismic signal of water inrush channel through wavelet theory and energy principle and found that the frequency of background noise is in the range of 0-1 kHz where the upper limit of effective signal frequency is 1250 kHz. However, the above applications only remain in the analysis of source distribution, waveform spectrum, etc., which lack in in-depth exploration of the source mechanism.
In recent years, moment tensor inversion has fully demonstrated its advantages in studying the focal mechanism in seismological research, and scholars have begun introducing it into the field of rock mechanics to study the focal mechanism information of rock internal fracture. OHTSU [20, 21] developed the SiGMA program for location of acoustic emission of signals and inversion of moment tensor for indoor rock experiments, and successfully applied it to bending test and hydraulic fracturing process of reinforced concrete. CHANG et al [22] used moment tensor analysis and motion point regression techniques to obtain the AE and strain data for uniaxial and triaxial compression experiments, and confirmed the failure mechanism is shear failure at microscopic scale of marble and granite in uniaxial compression experiments from the perspective of moment tensor. By using the initial motion polarity method and the moment tensor inversion method, GRAHAM et al [23] analyzed the distribution, proportion and change of different types of acoustic emission events of granite in the triaxial test from the perspective of time and space. ZHOU et al [24] proposed the unit model of rock mass damage characterization based on moment tensor on Shirengou iron mine, which can effectively evaluate the process of rock mass damage. However, in the field of coal mine water inrush, the research using microseismic monitoring technology combined with moment tensor inversion is still slightly insufficient.
In this paper, the moment tensor theory is used to invert the focal mechanism solution and obtain the fracture type of the rock mass for the anomalous area of microseismic event on the floor of working face #22517 of Dongjiahe Coal Mine in Shaanxi Province, China. We utilized the calculated data to identify the hidden fault information of the floor. In addition, based on the information of hidden faults obtained by inversion, a numerical simulation model of working face excavation was established, and the activation process of hidden faults was explored and the risk of water inrush was evaluated based on the results of microseismic detection. Finally, the above results are verified in combination with on-site water inflow data and geological data, in order to provide a certain reference for the prevention and control of coal mine floor water and its early warning.
2 Moment tensor and focal mechanism inversion method
2.1 Theory and calculation method of moment tensor
According to the displacement representation theorem, for a finite source, the solution of the Navier equation in elastic dynamics on the inner surface of an object can be expressed as [25]:
 (1)
(1)
where u is the coordinate (x, y, z); t is time of displacement; mpq is the moment tensor density; * represents the convolution operation; G is the Green function; and Σ is the inner surface area of the object. The source is regarded as a point source in space, so Eq. (1) is transformed into:
 (2)
(2)
where Mpq is a second-order moment tensor, assuming that the components of the seismic moment tensor are synchronized with time, then Mpq(t)=Mpq・S(t); S(t) is a function of the source time. When the source duration is very small compared with the period range of the data, S(t) can be approximated as a δ function. Therefore, Eq. (2) is transformed into:
 (3)
(3)
Because the P wave velocity is greater than the S wave velocity, the P wave is received by the sensor before the S wave and does not contain S wave and surface wave components. Therefore, P wave data are used in the process of inverting the moment tensor. The point source hypothesis and P wave far-field displacement formula are used for the inversion calculation. Equation (3) is written into a matrix as follows:
 (4)
(4)
where pin=1 when the position of the relevant sensor is tensile when the microseismic wave is arrival. On the contrary, when the position of the relevant sensor is compressed, pin=-1. upin represents the P wave displacement component in the i direction measured by the nth sensor (i=1, 2, 3); γin is the direction cosine of the nth sensor in the i direction and the formula is expressed as γin=(xin-ξi)/rn, where xin is the coordinates of the nth sensors in the i direction, ξi is the coordinates of the source in the i direction and rn is the distance between the two in space.
 where α is the P wave velocity, f is the pulse main frequency, Qp is the quality factor, and ρ is the rock mass density. To ensure that the linear equations are solvable, at least 6 sensors are required to participate in the calculation, as shown in Figure 1. The moment tensor M is expressed as:
 (5)
(5)
At present, the moment tensor is usually decomposed into three parts: isotropic component (ISO), double couple component (DC) and compensated linear vector dipole component (CLVD) [26]. The formula is as follows:

 (6)
(6)
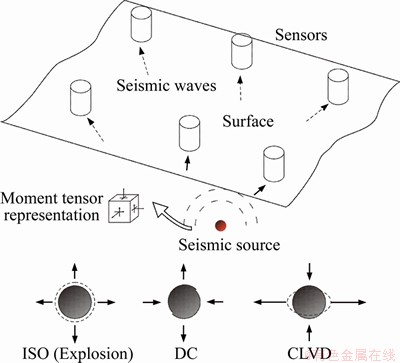
Figure 1 Geometry model of moment tensor inversion and focal mechanisms
In this formula, the ISO part characterizes the volume change of the source area and the DC part characterizes the displacement of the source area without volume change. The CLVD part characterizes the deformation other than shear deformation without body strain.
2.2 Criterion of fracture type and its corresponding fracture surface characteristics
The purpose of moment tensor decomposition is to determine the fracture type of rock mass by the proportion of different components. After finding the corresponding eigenvalues of the moment tensor, solve the system of linear equations by expanding Eq. (6) to find the size of each component:
 (7)
(7)
where M1, M2 and M3 represent the maximum eigenvalue, middle eigenvalue, and minimum eigenvalue of the moment tensor after diagonalization, respectively. The rupture type is determined by the proportion of MDC and MISO. During the diagonalization of the moment tensor, due to the difference in magnitude of M2 and M3 compared with M1, the calculated components may produce negative values, which affects the rupture type. The method of taking the absolute value to calculate and account for the proportion is adopted [27]:
 (8)
(8)
When PDC=1, the rupture type of the source is pure shear failure. When PDC=0, the rupture type of the source is pure tensile failure. When PDC≥60%, the type of failure is classified as shear failure; when PISO≥60%, the type of failure is classified as tensile failure; and when PDC<60% while PISO<60%, the type of failure is classified as mixed failure.
The moment tensor can obtain not only the fault properties at the source, but also the fault direction at the source. The normal vector and motion vector of the fault plane corresponding to the source can be obtained from the eigenvalue and eigenvector corresponding to the moment tensor [28, 29]:
 (9)
(9)
where n is the normal vector of the fault plane; v is the motion vector of the fault plane; and e1, e3 are the eigenvectors corresponding to the maximum and minimum eigenvalues, respectively. The specific parameters of the fault plane can be further obtained through n and v:
 (10)
(10)
 (11)
(11)
where φ, δ, λ and α represent the strike direction, dip angle, slip angle and slope of the fault plane, respectively. According to the above data, the spatial orientation information of the fault plane can be represented in the beach ball. It should be noted that because the moment tensor is a symmetric second-order tensor, n and v have ambiguity, that is, the interchange of n and v directions still corresponds to the moment tensor, and the corresponding two planes are called primary fault plane and auxiliary fault plane. The geometric parameters in this paragraph can be seen in Figure 2.
3 Engineering background
3.1 Project overview
Dongjiahe Coal Mine of China Chenghe Mining Company is located about 3.5 km southwest of Chengcheng County, Weinan City in Shaanxi Province, China. The area where it is located does not have a large geological structure and it belongs to the Chenghe mining area, as shown in Figure 3. Dongjiahe Coal Mine has more than 30 years of mining history since its completion and production. In recent years, the output has stabilized at about 550000 t. This paper mainly studies the working face #22517 at the second level. Its buried depth is about 425-475 m, with an average of 450 m, located east of conveyer belt in the second excavation of second level. This region belongs to a continental semi-arid climate, with little rainfall and high evaporation. The inclination angle of #22517 working face is about 3°, which belongs to near- horizontal coal seam, with an average thickness of 3.3 m, and its occurrence is relatively stable. The working face moves towards 1217 m and tends to 185 m, mining from west to east, using comprehensive mechanized long-wall coal mining technology, and all roofs are managed by the collapse method.
The main aquifers of the mines in this mining area include: loose water aquifers of the Quaternary system, fissure aquifers of the Permian sandstone, limestone aquifers of the Upper Carboniferous Taiyuan Formation and limestone aquifers of the Middle Ordovician Fengfeng Formation. Beddings between each aquifer play the role of relative aquitard, cutting off the direct hydraulic connection between aquifers. It is worth mentioning that the Middle Ordovician Fengfeng Formation limestone aquifer, which is located about 35 m below the working face, has the water head elevation of 381.3-384.8 m and a high head pressure. Therefore, once the hidden small faults are encountered during the excavation process, there may be a danger of submerging the working face.
3.2 Site layout of microseismic monitoring system
The microseismic monitoring system produced by the Canadian ESG (Engineering Seismology Group) company is used to monitor the microseismic events of the surrounding rock of the floor. The system is mainly composed of microseismic sensors, Paladin digital signal acquisition system, and Hyperion digital signal processing system. The sampling frequency of the system is 5000 Hz. The type of microseismic sensor is single axis geophone. The response frequency of the sensor ranges from 15 to 1000 Hz, and the sensitivity is 43.3 V/(m・s).
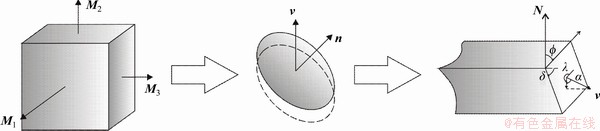
Figure 2 Crack motion and equivalent parameters of fault-plane
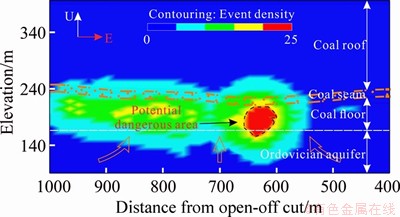
Figure 3 Contour of MS events density
The sensors are arranged on the coal seam floor of the track working and the transportation working in the area to be monitored respectively. One sensor is arranged every 100 m, and one every 60 m in the water-rich area. The sensor is installed in the borehole located in the bedrock of the bottom floor. The vertical depth of the borehole is not less than 3 m, and tools are used to transport the sensor to the bottom of the borehole so that it is in close contact with the rock. After passing through the sensor, the hole is finally filled with cement, and the goaf cable is protected by casing and landfill to ensure the normal transmission of the signal after the goaf collapses.
4 Moment tensor inversion and analysis
4.1 Moment tensor calculation process
Face #22517 was put into production on October 5, 2014. The microseismic system was installed on November 25, 2014 and began monitoring. The monitoring duration was about 2 years. A total of 88 microseismic events were detected on the bottom floor. Figure 3 shows the density map of microseismic events on the bottom floor. After simplification of the rock layers, the coal seam roof, coal seam, coal seam floor and Ordovician confined water layer are in order from top to bottom. According to the density map of microseismic events, the density of microseismic events is the largest at the distance of 600-650 m from the open-off cut. There are more than 20 microseismic events gathered here, which can be inferred as a potentially dangerous area. The microseismic events in this area are selected for analysis.
Moment tensor was used to solve the 22 microseismic events at this area, and the effective microseismic waveform event waveform file monitored by the sensor was imported into Matlab. The initial motion polarity and P wave displacement were obtained by picking up the P wave amplitude of the waveform (as shown in Figure 4). By recording the sensor coordinates corresponding to the effective microseismic waveform, consider the inherent attenuation of the P wave, calculate the Green’s function, and finally find the moment tensor corresponding to the source. The above calculation process is realized by programming on the Matlab platform, using one of the moment tensors results as example:
 (12)
(12)
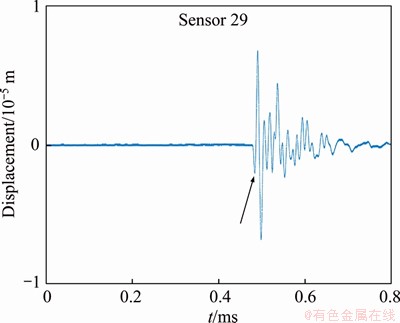
Figure 4 Microseismic waveform signal and displacement of P waves
Further decomposing Eq. (12) according to Eq. (6), the isotropic component ISO, double couple component DC, and compensated linear vector dipole component CLVD were obtained.
 (13)
(13)
 (14)
(14)
 (15)
(15)
According to Eq. (8), the proportion of shear component PDC=0.50, and the proportion of tensile component PISO=0.17 are obtained. It can be known that the rupture type of the source belongs to mixed failure. According to Eq. (9), the spatial parameters of the fault plane generated by the source were calculated. The process of solving the moment tensor of the remaining 21 microseismic events is the same as above and will not be repeated here. The information of fault plane with moment magnitude greater than 0 are shown in Table 1.
4.2 Inversion results of moment tensor
After solving the moment tensor, the spatial parameters of primary fault plane and auxiliary fault plane corresponding to the microseismic event are calculated by further using Eqs. (10) and (11), and the beach ball projection diagram method is applied to the spatial parameters of primary fault plane and auxiliary fault plane visualization, as shown in Figure 5. The figure shows 12 beach ball graphics with moment magnitude greater than 0. The two arcs in the beach ball represent the polarized erythroid projections of primary fault plane and auxiliary fault plane. The shaded area indicates the initial movement of P wave ray at the sensor, which is the stretching quadrant; the non-shaded area indicates that the P wave ray is generated at the sensor and the downward motion is the compression quadrant. T is the tensile axis, indicating the direction of the feature vector corresponding to the largest eigenvalue, located inside the shaded area; B is the intermediate axis, indicating the direction of the feature vector corresponding to the intermediate eigenvalue, located at the intersection of the two arcs; P is the compression axis, indicating the direction of the feature vector corresponding to the smallest feature value, and it is located inside the non-shaded area [30]. The type of fault can be judged by the initial movement polarity. If the inside of the arc is filled with color, it means that the upper wall tends to recede relative to the lower wall. If the outside of the arc is filled with color, it means that the fault is a normal fault. Except for event 12 in Figure 5, all the small faults generated by microseisms tend to thrust, so it can be judged quantitatively that the type of the hidden fault is reversed fault.
The geometric parameters of the corresponding primary fault plane and auxiliary fault plane are obtained by solving the moment tensor of the microseismic event above, but the real earthquake only produces one fault plane, so it is necessary to select the true fault plane from the primary fault plane and auxiliary fault plane. Here, the method proposed by LUND et al [31] is used to select the real fault plane by defining the instability coefficient I of the nodal plane:
 (16)
(16)
where τ is the shear stress on the joint surface; μ is the friction coefficient; σn is the normal stress on the joint surface. The stress on the joint surface is calculated by the linear stress inversion method proposed by MICHAEL [32] and the specific process can be seen in the appendix A. The calculated τ and σn are substituted into Eq. (16), and the fault plane with the larger I value is taken as the true fault plane. After determining the rupture type and spatial occurrence of the fault plane, it is necessary to visualize the fracture plane to evaluate the occurrence and scale of the fault. In the three-dimensional network model, it is often shown by a thin disc surface for the simplification of the discontinuous surface [33]. The center of thin disc surface corresponds to the positioning coordinates of the microseismic event, and its radius can be expressed as [34]:
 (17)
(17)
where Kc is a constant that depends on the source model, and the recommended value of the Madariaga model is 1.32; vs is the S-wave velocity; fc is the corner frequency. The corner frequency is obtained by FFT transforming the time-domain signal into its frequency domain, which means the intersection point of the high-frequency attenuation signal spectrum level. Figure 6(a) represents total rupture surfaces in the potentially dangerous area. According to the calculation results, the rupture surface inferred by the microseismic event has reached the Ordovician limestone aquifer, which is a potential water inrush channel, and there is a risk of further water inrush disaster. The dip angle of the true fracture surface is counted, and the dip angle of the fault is approximately equal to the average value of the dip angle of each fracture surface. The calculated dip angle of the fault is about 70°.
Table 1 Fault parameters and their rupture types
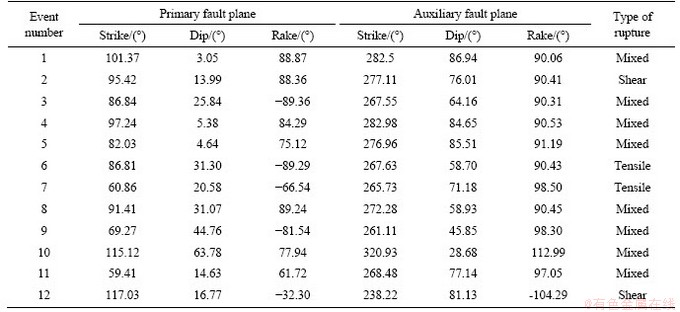
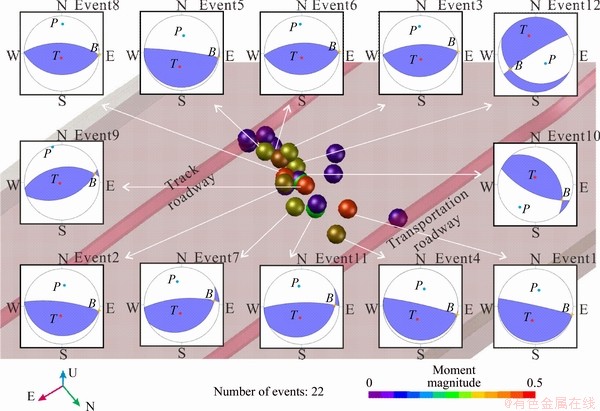
Figure 5 Beach balls and model
The length of the fault must be determined by the spatial and temporal distribution of the microseismic event and the rupture radius. By collating the advancement data of the working face, on June 29, 2015, the advancement of the working face was 529 m, and the distance from the fault was 80 m. A total of 6 microseismic events occurred in this area, as shown in Figure 6(b). A total of 12 microseismic events occurred in July. It can be considered that the stress redistribution caused by the excavation after July resulted the expansion of the fault, thereby increasing the number of microseismic events. Therefore, the action length of the fault is the distance from the rupture surface formed by the 6 microseismic events before July to the coal floor, which is calculated to be about 21 m.
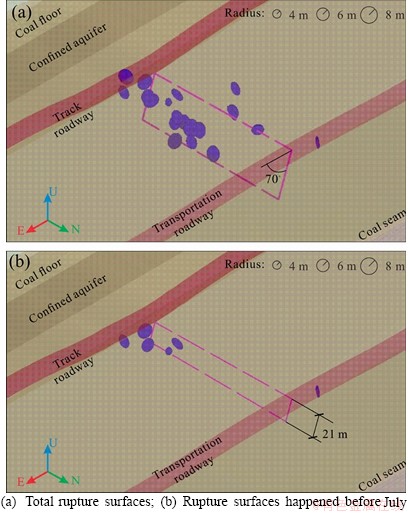
Figure 6 Distribution of rupture surfaces:
5 Numerical simulation
5.1 Advantages of realistic failure process analysis (RFPA)
This paper selects RFPA-2D software to simulate the activation process of hidden faults. The RFPA-2D software assumes that the element is an elastic-brittle material with residual strength. The mechanical behavior of the loading process conforms to the elastic damage theory [35]. The yield criterion of the element is controlled by the maximum tensile strength criterion and the Mohr-Coulomb criterion. The mining process is mainly achieved by replacing the solid elements with empty elements. For the problem of distributed excavation, in order to prevent the calculation result from too much sudden damage and causing the calculation result not to converge, RFPA-2D software introduced step function to visualize the progressive damage of elements.
In the seepage calculation, without considering the effect of temperature changes, it is assumed that the seepage process of rock satisfies the Biot seepage theory and the modified Terzaghi effective stress principle. The seepage equation and coupling equation are as follows:
 (18)
(18)
where k represents the permeability of the rock mass element; Δ is the Laplace operator; α represents the pore pressure coefficient; εv represents the body strain; k0 is the initial value of rock permeability coefficient; β represents the coupling coefficient; σ0 represents the average stress. For the low porosity material such as rock, SCHULZE et al [36] and SOULEY et al [37] all pointed out that when the rock enters the yield stage during the full stress and strain process, with the initiation and expansion of new cracks, the permeability of the rock will increase dramatically throughout a series of activities. Based on the above knowledge, RFPA-2D uses the negative exponential equation proposed by LOUIS [38] to express the change of permeability coefficient, and considering the increase in permeability after rock element yield, the following function is used to express the change of permeability of rock element:
 (19)
(19)
where ξ is the increase coefficient and D is the damage variable. The element is judged by the maximum tensile strength criterion and the Mohr-Coulomb criterion as damage thresholds. When the element reaches any of the above two strength criteria, it indicates that the element is damaged, that is, D>0; otherwise, D=0.
5.2 Model building
The numerical simulation model is established based on the comprehensive borehole histogram. The geometrical parameters of the fault refer to the results in Section 4.2, that is, the fault angle is 70° and the length is 21 m. The model has a length of 320 m, a height of 160 m, and a coal seam thickness of 3 m. The model is composed of square elements with a total of 51200 elements, as shown in Figure 7. The boundary condition of the model is that both directions of the bottom are constrained by displacement, and each side of the model is constrained in the horizontal direction. The top boundary is free, and the load of 4 MPa is applied to the top to simulate the weight of overburden. A fixed head of 300 m is applied to the Ordovician limestone layer, and the bottom seepage boundary is the boundary of fixed pore pressure. The specific information of the rock formation in the model can be seen in the Table 2. The first and seventh layers belong to fine-grained sandstone. The second, fourth, eighth, sixteenth layers belong to coarse siltstone. The third, sixth, eleventh, thirteenth layers belong to fine siltstone. The category of the fifth layer is medium grain sandstone. The coal seam is situated at the ninth layer. The tenth, twelfth, fifteenth, seventeenth layers belong to quartz sandstone. The category of the fourteenth layer is quartz conglomerate. The eighteenth layer is aluminum mudstone and the nineteenth layer is Ordovician limestone.
The excavation process of the working face is simulated by distributed excavation; the empty element is set as the impermeable element; the first step is not excavated; the original ground stress field of the model is calculated and the excavation begins at the second step. The excavation location is 120 m away from the right-side boundary. The excavation distance of each step is 10 m for a total of 13 steps. The excavation direction is from right to left, and the cumulative excavation is 120 m.
5.3 Law of fault failure
As shown in Figure 8, the red dot indicates that the stress state of the element reached the maximum tensile strength criterion and failed; the white dot indicates that the stress state of the element reached the Mohr-Coulomb criterion and failed, and the black dot indicates that the failed element occurred in the prior calculation steps. As shown in Figures 8(a) and (b), when the working face is located 10 m before the fault, the element in the middle of the fault will be destroyed first, and the trend of the damage will extend below the fault in the next calculation step. When the working face advances to the fault, as shown in Figure 9(a), the damage of the element at the fault is further intensified, and the number of damage element is increased sharply. When the excavation is completed, as shown in Figure 9(b), some elements in the upper rock layer of confined aquifer are damaged due to the influence of water pressure, but the micro-fracture at the fault does not penetrate the confined aquifer to form a large water inrush accident. It can be summarized from Figures 8 and 9 that the element failure trend at the fault is that the middle of the fault is the first to fail, 7-18 m away from the bottom plate. As the excavation progresses, the destruction trend expands downward, the destruction depth is 22 m away from the bottom plate, and finally the destruction trend leads to the working face. This rule is consistent with the elevation distribution of microseismic events at that location. As shown in Figure 10, the discrete points represent microseismic events, the horizontal axis represents the date, and the vertical axis on the left represents the elevation of microseismic event. The solid colored line represents the polynomial curve fitted according to the elevation of microseismic event. The trend of this curve is the same as the numerical simulation of fault destruction. The ordinate on the right represents the excavation distance of the working face. The hidden fault is about 620 m far away from the open-off cut. According to the data in the figure, when the working surface is 40 m away from the fault on August 17, 2015, the above 20 microseismic events have already occurred. Obviously, microseismic monitoring has the role of advanced prediction. In addition, according to the results of numerical simulations, the failure properties of the element at the fault are not a single tensile or shear failure, but a mixed failure mode. This result is consistent with the source failure type of moment tensor inversion.
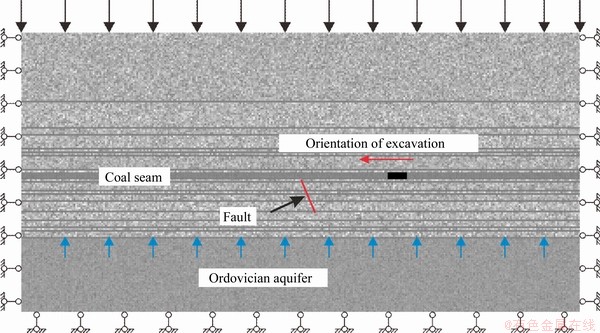
Figure 7 Numerical model diagram
Table 2 Physical and mechanical parameters of rock formation
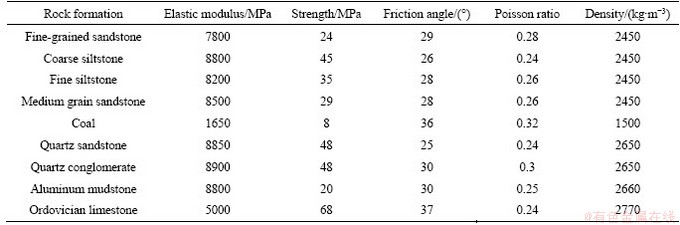
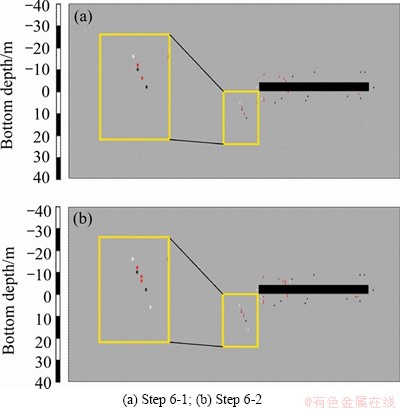
Figure 8 Failure diagram when excavating 50 m:
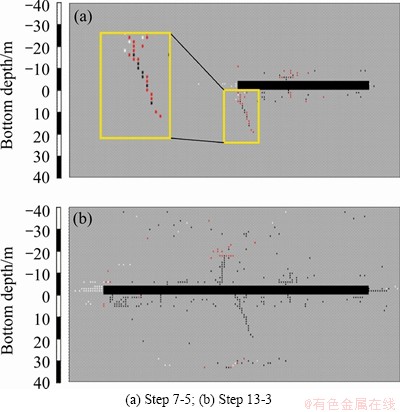
Figure 9 Failure diagram when excavating 60 m and 120 m:
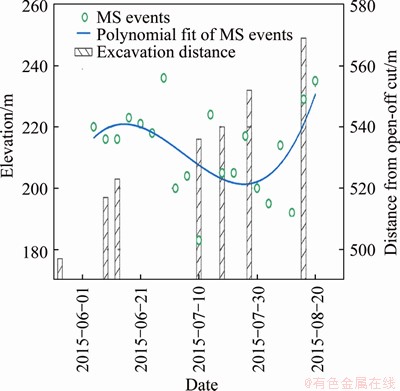
Figure 10 Figure of microseismic events’elevation and excavation distance
5.4 Analysis of fault stress evolution
The following analysis is the law of fault propagation from the perspective of stress.Figure 11 shows the minimum principal stress contour of the model. The negative value represents tensile stress. Figure 11(a) shows the minimum principal stress distribution when the working face is excavated 40 m. The negative value in RFPA-2D software represents the tensile stress. The minimum principal stress distribution of the bottom plate is roughly “inverted saddle” shape; stress concentration occurs near the working face and spreads to the surroundings. Since the fault location is far away from the working surface at this time, almost no tensile stress is generated at the fault. When the working face continues to advance to 50 m, the minimum principal stress cloud is shown in Figure 11(b). The tensile stress appears in the middle of the fault, causing the middle of the fault to fail first. In addition, as the excavation distance increases, the range of stress diffusion under the floor also gradually increases. As the working face continues to advance, the minimum principal stress of diffusion causes tensile stress below the fault, as shown in Figure 11(c). The RFPA-2D software simulates the damaged element by reducing the strength of the element. After the element is damaged, the program will recalculate the stress of the model, and the stress concentration appears above the fault, as shown in Figure 11(d). After the redistribution of stress, the upper end of the fault eventually fails.
6 Analysis of water inflow and geological data at working face
In this paper, the data of water inflow from August 20, 2015 to October 30, 2015 are selected for analysis. From Figure 12, the horizontal axis represents the date, the left ordinate represents the excavation distance, and the right ordinate represents the working face water flow. The location of the fault is about 620 m away from the opening. The working face was excavated to the vicinity of the fault on September 15, 2015, and the amount of water inflow increased slightly from 68 to 71. This is because the excavation increased the permeability of surrounding rock in the fault, but in general, the water inflow at the working face is stable at about 70, indicating that the fault does not penetrate through the limestone aquifer to form a water inrush accident. This result is consistent with Figure 9(b).
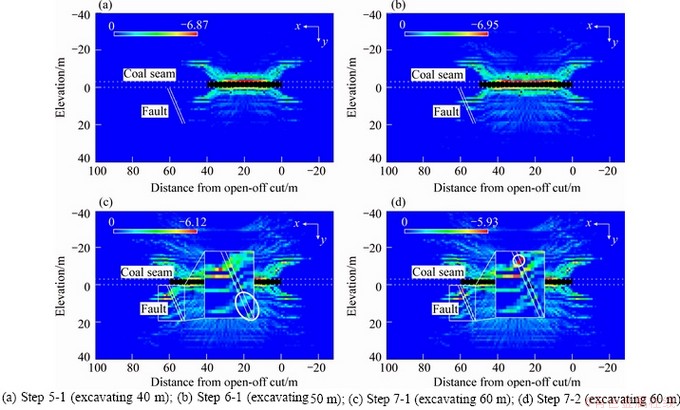
Figure 11 Contour of minimum principal stress (unit: MPa):
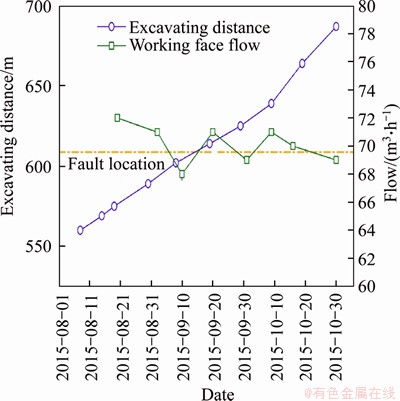
Figure 12 Data of excavating distance and flow
Figure 13(a) shows the contour map of coal seam floor. The horizontal axis represents the distance from the open-off cut. From this figure, it can be found that there is a small syncline near the open-off cut from 600 to 700 m. The maximum height difference between them is about 2 m. The core part is usually prone to damage under the influence of tectonic stress and mining stress, forming a hidden fault, which explains reasons for the gathering of floor microseismic events here. Figure 13(b) shows a comprehensive histogram below the coal seam floor. Through drilling samples there, it is found that there is an aluminum mudstone layer with a thickness of about 4 m above the Ordovician confined aquifer. The rock layer has good integrity and low porosity. As the floor water-proof layer, the aluminum mudstone effectively prevents the rise of the pressurized water and avoids the occurrence of water inrush accidents.
7 Conclusions
In this paper, through the microseismic monitoring system of floor layout of Dongjiahe working face #22517, the program is designed to calculate the moment tensor of events in the potentially dangerous area based on MATLAB platform. The stress inversion method is used to identify the hidden faults of the floor, and the floor stress field obtained by RFPA analyzes the activation process of the hidden faults in the bottom floor. The main conclusions are as follows:
1) The potentially dangerous area in the coal floor is recognized using the density contour of MS events and the moment tensor of the MS event in this area is solved. On this basis, each moment tensor is decomposed into three parts: isotropic (ISO) component, double-couple (DC) component and compensated linear vector dipole (CLVD) component. According to the relative criterion, the main rupture type in this area is mixed failure.
2) The spatial parameters of the primary fault plane and auxiliary fault plane are further obtained from the moment tensor data, and the beach ball diagram is drawn. Based on the distribution of initial motion polarity, the hidden fault belongs to the reversed fault. In addition, the instability coefficient of fracture surface was calculated by the stress inversion method, and the direction of true fracture surface was determined. The inclination of the fault was approximately 70° and the fracture length was 21 m.
3) The obtained geometric parameters of the hidden fault are applied to the modeling process of numerical simulation. We use RFPA-2D to simulate the activation process of the hidden fault, and combine the temporal and spatial distribution of the microseismic events to divide the failure process of the fault into three stages: first, the middle of the fault failed in 7-18 m away from the base floor; second, and the destruction trend expands downward, the destruction depth is 22 m away from the bottom floor; finally, the destruction trend leads to the working face.
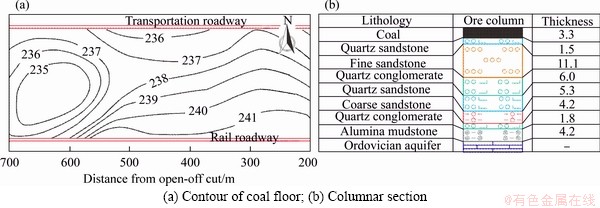
Figure 13 Contour of coal floor and columnar section (unit: m):
4) Through the data of floor water inflow, floor contour map and borehole histogram, etc., the location and distribution of hidden fault obtained by MTI (moment tensor inversion) are verified. Furthermore, the main rupture type calculated from MTI is also consistent with the numerical simulation result. It shows that microseismic monitoring and moment tensor inversion methods have good development prospects in the field of coal mine water inrush.
Appendix A: Linear stress inversion method
In this method, the relative deviatoric stress magnitudes can be obtained by utilizing the fault parameters, including dip direction, dip, rake. The basis of this technique is that the direction of the tangential traction on the fault’s plane tends to be parallel to the fault’s slip direction. Besides, the absolute magnitude of tangential traction is assumed to be 1. According to the above assumptions, the following normal equation is derived:
 (A1)
(A1)
where A is the 3×5 matrix calculated from a single fault normal vector n, expressed as:
 (A2)
(A2)
Σ is the vector of deviatoric stress tensor elements, expressed as:
 (A3)
(A3)
and s is the unit direction of the slip vector. Generally, this method constraines one of the principle stress axes to be vertical. In this way, σ13 and σ23 are equal to 0. The vector s and n can be obtained by Eqs. (11) and (12) using fault parameters. A least squares criterion is used to solve Eq. (A1) and we can obtain the relative deviatoric stress magnitudes.
Contributors
The frame of research goals was developed by MA Ke and SUN Xing-ye. TANG Chun-an provided the funding acquisition and resources. WANG Su-jian and YUAN Fu-zhen produced metadata and were responsible for data curation. SUN Xing-ye designed computer programs. The initial draft of the manuscript was written by SUN Xing-ye and MA Ke. PENG Yi-lin and LIU Kai reviewed and modified the manuscript.
Conflict of interest
MA Ke, SUN Xing-ye, TANG Chun-nan, WANG Su-jian, YUAN Fu-zhen, PENG Yi-lin, and LIU Kai declare that they have no conflict of interest.
References
[1] ZHANGJin-cai. Investigations of water inrushes from aquifers under coal seams [J]. International Journal of Rock Mechanics and Mining Sciences, 2005, 42(3): 350-360. DOI: 10.1016/j.ijrmms.2004.11.010.
[2] ZHANGJin-cai, SHENBao-hong. Coal mining under aquifers in China:acase study [J]. International Journal of Rock Mechanics and Mining Sciences, 2004, 41(4): 629-639. DOI: 10.1016/ j.ijrmms.2003.01.005.
[3] WUQiang, LIUYuan-zhang, WUXiao-li,LIUShou-qiang, SUN Wen-jie, ZENG Yi-fan. Assessment of groundwater inrush from underlying aquifers in Tunbai coal mine, ShanxiProvince, China [J]. Environmental Earth Sciences, 2016, 75(9):737. DOI:10.1007/s12665-016-5542-4.
[4] QIU Mei, SHI Long-qing, TENG Chao, ZHOU Yan. Assessment of water inrush risk using the fuzzyDelphi analytic hierarchy process and grey relational analysis in theLiangzhuang coal mine, China [J]. Mine Water and the Environment, 2017, 36(1): 39-50. DOI: 10.1007/s10230- 016-0391-7.
[5] CHENG Guan-wen. Study on microseismic monitoring technique for micro-fracture precursor information of water inrush [D]. Dalian: Dalian University of Technology, 2017. (in Chinese)
[6] LIZhen-hua, FENGGuo-rui, ZHAIChang-zhi. Study on “triangle” water-inrush mode of strong water-guide collapse column [J]. Journal of Central South University, 2016, 23(9): 2402-2409. DOI: 10.1007/s11771-016-3299-2.
[7] HU Yan-bo, LIWen-ping, WANG Qi-qing, LIU Shi-liang, WANG Zhen-kang. Evolution of floor water inrush from a structural fractured zone with confined water [J]. Mine Water and the Environment, 2019, 38(2): 252-260. DOI: 10.1007/s10230-019-00599-0.
[8] LIU Zhi-xiang, HAN Ke-wen, YANG Shan, LIU Yu-xi. Fractal evolution mechanism ofrock fracturein undersea metal mining [J]. Journal of Central South University, 2020, 27(4): 1320-1333. DOI: 10.1007/s11771-020-4369-z.
[9] LU Y L, ELSWORTH D, WANG L G. Microcrack-based coupled damage and flow modeling of fracturing evolution in permeable brittle rocks [J]. Computers and Geotechnics, 2013, 49: 226-244. DOI: 10.1016/j.compgeo.2012.11.009.
[10] POULSEN B A, ADHIKARY D, GUO H. Simulating mining-induced strata permeability changes [J]. Engineering Geology, 2018, 237: 208-216. DOI: 10.1016/j.enggeo.2018. 03.001.
[11] YANCheng-zeng, JIAOYu-yong. A 2D fully coupled hydro-mechanical finite-discrete element model with real pore seepage for simulating the deformation and fracture of porous medium driven by fluid [J]. Computers & Structures, 2018, 196: 311-326. DOI: 10.1016/j.compstruc.2017.10.005.
[12] ZHOUWen-long, ZHANGPing-song, WU Rong-xin, HU Xiang-yun. Dynamic monitoring the deformation and failure of extra-thick coal seam floor in deep mining [J]. Journal of Applied Geophysics, 2019, 163: 132-138. DOI: 10.1016/ j.jappgeo.2019.02.007.
[13] LI Hao, BAI Hai-bo, WU Jian-jun, MENG Qing-bin, MA Kai, WU Lu-yuan, MENG Fan-fei, WANG Shao-jie. A set of methods to predict water inrush from anOrdovician karst aquifer:Acase study from theChengzhuang mine, China [J]. Mine Water and the Environment, 2019, 38(1): 39-48. DOI: 10.1007/s10230- 018-00572-3.
[14] CAO An-ye, DOU Lin-ming, LUO Xun, ZHENG Yi-dong, HUANG Jun-li, ANDREW K. Seismic effort of blasting wave transmitted in coal-rock mass associated with mining operation [J]. Journal of Central South University, 2012, 19(9): 2604-2610. DOI: 10.1007/s11771-012-1317-6.
[15] MA K, TANG C A, XU N W, LIU F, XU J W. Failure precursor of surrounding rock mass aroundcross tunnel in high-steep rock slope [J]. Journal of Central South University, 2013, 20(1): 207-217.
[16] LI Zhen-lei, DOU Lin-ming, WANG Gui-feng, CAI Wu, HEJiang, DING Yan-lu. Risk evaluation of rock burst through theory of staticand dynamicstresses superposition [J]. Journal of Central South University, 2015, 22(2): 676- 683. DOI: 10.1007/s11771-015-2570-2.
[17] HONG Yi-du, LIN Bai-quan, ZHU Chuan-jie, WANG Zheng, LIU Jin-quan, SAFFARI P, NIE Wen. Image and ultrasonic analysis-based investigation of coal core fracturing by microwave energy [J]. International Journal of Rock Mechanics and Mining Sciences, 2020, 127: 104232. DOI:10.1016/j.ijrmms.2020.104232.
[18] LI T, MEITing-ting, SUNXue-hui,LVY, SHENG Ji-quan, CAI M. A study on a water-inrush incident at Laohutai coalmine [J]. International Journal of Rock Mechanics and Mining Sciences, 2013, 59: 151-159. DOI: 10.1016/j.ijrmms. 2012.12.002.
[19] CHENG Shuai, LI Shu-cai, LI Li-ping, SHI Shao-shuai, ZHOU Zong-qing, WANG Jing. Study on energy band characteristic of microseismic signals in water inrush channel [J]. Journal of Geophysics and Engineering, 2018, 15(5): 1826-1834. DOI: 10.1088/1742-2140/aaba28.
[20] OHTSU M. Acoustic emission theory for moment tensor analysis [J]. Research in Nondestructive Evaluation, 1995, 6(1): 169-184. DOI: 10.1007/ BF01606380.
[21] OHTSU M, UDDIN F A K M. Mechanisms of corrosion- induced cracks in concrete at meso- and macro-scales [J]. Journal of Advanced Concrete Technology, 2008, 6(3): 419-429. DOI: 10.3151/jact.6.419.
[22] CHANG S H, LEE C I. Estimation of cracking and damage mechanisms in rock under triaxial compression by moment tensor analysis of acoustic emission [J]. International Journal of Rock Mechanics and Mining Sciences, 2004, 41(7): 1069-1086. DOI: 10.1016/j.ijrmms.2004.04.006.
[23] GRAHAM C C, STANCHITS S, MAIN I G,DRESENG. Comparison of polarity and moment tensor inversion methods for source analysis of acoustic emission data [J]. International Journal of Rock Mechanics and Mining Sciences, 2010, 47(1): 161-169. DOI: 10.1016/j.ijrmms. 2009.05.002.
[24] ZHOU Jing-ren, WEI Jiong, YANG Tian-hong, ZHU Wan-cheng, LI Lian-chong, ZHANG Peng-hai. Damage analysis of rock mass coupling joints, water and microseismicity [J]. Tunnelling and Underground Space Technology, 2018, 71: 366-381. DOI: 10.1016/j.tust.2017. 09.006.
[25] AKI K, RICHARDS P. Quantitative seismology [M]. 2nd ed. Sauashito: University Science Books, 2002.
[26] KNOPOFF L, RANDALL M J. The compensated linear- vector dipole:Apossible mechanism for deep earthquakes [J]. Journal of Geophysical Research, 1970, 75(26): 4957- 4963. DOI: 10.1029/JB075i026p04957.
[27] TANG Li-zhong, JIAN Ying-hua, LI Di-yuan, WANG C. Analysis of damage mechanism for surrounding rock based on microseismic moment tensor [J]. Rock and Soil Mechanics, 2017, 38(5): 1436-1444. DOI: 10.16285/j.rsm. 2017.05.026. (in Chinese)
[28] VAVRYCUK V. Focal mechanisms in anisotropic media [J]. Geophysical Journal International, 2005, 161(2): 334-346. DOI: 10.1111/j.1365-246X.2005.02585.x.
[29] VAVRYCUK V. Tensile earthquakes: Theory, modeling, and inversion [J].JournalofGeophysical Research: Solid Earth, 2011, 116(B12): B12320. DOI: 10.1029/2011JB0087 70.
[30] LAY T, WALLACE T C. Modern global seismology (Vol. 58) [M]. Elsevier, 1995.
[31] LUND B, SLUNGA R. Stress tensor inversion using detailed microearthquake information and stability constraints: Application toOlfus in southwest Iceland [J]. Journal of Geophysical Research: Solid Earth, 1999, 104(B7): 14947- 14964. DOI: 10.1029/1999JB900111.
[32] MICHAEL A J. Determination of stress from slip data: Faults and folds [J]. Journal of Geophysical Research: Solid Earth, 1984, 89(B13): 11517-11526. DOI: 10.1029/JB089 iB13p11517.
[33] OHTSU M. Prospective applications of AE measurements to infra-dock of concrete structures [J]. Construction and Building Materials, 2018, 158: 1134-1142. DOI: 10.1016/ j.conbuildmat.2017.09.145.
[34] MADARIAGA R. Dynamics of an expanding circular fault [J]. Bulletin of the Seismological Society of America, 1976, 66(3): 639-666.
[35] TANGC A, THAM L G, LEE P K K,YANGT H, LI L C. Coupled analysis of flow, stress and damage (FSD) in rock failure [J]. International Journal of Rock Mechanics and Mining Sciences, 2002, 39(4): 477-489. DOI: 10.1016/ S1365- 1609(02)00023-0.
[36] SCHULZE O, POPP T, KERN H. Development of damage and permeability in deforming rock salt [J]. Engineering Geology, 2001,61(2, 3): 163-180. DOI: 10.1016/S0013- 7952(01)00051-5.
[37] SOULEY M, HOMAND F, PEPA S,HOXHAD. Damage- induced permeability changes in granite:Acase example at the URL in Canada [J]. International Journal of Rock Mechanics and Mining Sciences, 2001, 38(2): 297-310. DOI: 10.1016/ S1365-1609(01)00002-8.
[38] LOUIS C, MAINI Y N. Determination of in-situ hydraulic parameters in jointed rock [J]. International Society of Rock Mechanics Proceedings, 1970, 1(1-19): 235-245.
(Edited by HE Yun-bin)
中文导读
基于微震矩张量反演的中国董家河煤矿突水预警方法研究
摘要:董家河煤矿属于中国华北石炭二叠纪煤田,该区域的岩溶、裂隙发育程度较高,其水害治理问题一直受到学者们的广泛关注。本文以董家河煤矿工作面为例,通过工作面布置的微震监测系统,采用矩张量理论反演了底板微震事件异常区域的震源机制解,通过应力反演方法识别了底板隐伏断层,并结合数值模拟获取了底板的应力场。结果表明:1)通过传感器拾取的有效微震波形计算了突水危险区域的矩张量,并在此基础上将矩张量分解为三部分并结合相关判据得出该区域的主要破裂类型为混合破坏。2)通过震源机制中的初动极性和应力反演方法,确定了断层的主要属性,该隐伏断层属于逆断层,其倾角大致为70°,破裂长度为21 m。3)通过数值模拟方法结合微震事件的时空分布将断层的破坏过程分为3个阶段。其结果可为类似煤矿突水风险的预警和评估提供参考。
关键词:矩张量反演;突水;断层识别;岩石破裂过程分析
Foundation item: Project(2017YFC1503103) supported by the National Key Research and Development Plan of China; Projects(51774064, 51974055, 41941018) supported by the National Natural Science Foundation of China; Project(DUT20GJ216) supported by the Fundamental Research Funds for the Central Universities, China; Project(51627804) supported by the Special-Funded Program on National Key Scientific Instruments and Equipment Development, China
Received date: 2020-07-08; Accepted date: 2020-08-27
Corresponding author: MA Ke, PhD, Associate Professor; Tel: +86-18600952046; E-mail: mark1983@dult.edu.cn; ORCID: https://orcid. org/0000-0003-2977-896X

