J. Cent. South Univ. (2016) 23: 44-51
DOI: 10.1007/s11771-016-3047-7

Numerical simulation of chemical vapor deposition reaction in polysilicon reduction furnace
XIA Xiao-xia(夏小霞)1, 2, WANG Zhi-qi(王志奇)1, LIU Bin(刘斌)1
1. Institute of Mechanical Engineering, Xiangtan University, Xiangtan 411105, China;
2. School of Energy Science and Engineering, Central South University, Changsha 410083, China
 Central South University Press and Springer-Verlag Berlin Heidelberg 2016
Abstract: Three-dimensional model of chemical vapor deposition reaction in polysilicon reduction furnace was established by considering mass, momentum and energy transfer simultaneously. Then, CFD software was used to simulate the flow, heat transfer and chemical reaction process in reduction furnace and to analyze the change law of deposition characteristic along with the H2 mole fraction, silicon rod height and silicon rod diameter. The results show that with the increase of H2 mole fraction, silicon growth rate increases firstly and then decreases. On the contrary, SiHCl3 conversion rate and unit energy consumption decrease firstly and then increase. Silicon production rate increases constantly. The optimal H2 mole fraction is 0.8-0.85. With the growth of silicon rod height, SiHCl3 conversion rate, silicon production rate and silicon growth rate increase, while unit energy consumption decreases. In terms of chemical reaction, the higher the silicon rod is, the better the performance is. In the view of the top-heavy situation, the actual silicon rod height is limited to be below 3 m. With the increase of silicon rod diameter, silicon growth rate decreases firstly and then increases. Besides, SiHCl3 conversion rate and silicon production rate increase, while unit energy consumption first decreases sharply, then becomes steady. In practice, the bigger silicon rod diameter is more suitable. The optimal silicon rod diameter must be over 120 mm.
Key words: polysilicon reduction furnace; chemical vapor deposition; silicon growth rate
1 Introduction
Polysilicon is main raw material in solar energy utilization. In recent years, polysilicon industry has entered the winter period because of the falling demand and excess production capacity [1]. In order to save costs, it is necessary to develop advanced production technology and equipment. In the solar grade silicon production, about 80% of the world’s total output is based on the modified Siemens method [2-3]. Reduction furnace is the key device in polysilicon production process as it accounts for more than 60% of the whole energy consumption [4]. To improve polysilicon production device and reduce energy consumption is an urgent task in solar photovoltaic industry.
The production process in polysilicon reduction furnace, including the flow, heat transfer, gas phase chemical reaction and surface chemical reaction, is very complex and influenced by many factors [5]. However, a complete theory is not enough to analyze all the influence factors systematically. Now, the researches on reduction furnace are mainly focused on numerical simulation of physical field without considering chemical reactions, which deviate greatly from the real conditions [6-11]. Even though some researchers simulated the chemical vapor deposition [12-16], their studies were only concentrated on the influence of operating parameter on silicon deposition rate, lack of analysis on the influence of structure parameters. In addition, there is no analysis of SiHCl3 conversion rate, silicon production rate and unit energy consumption.
In order to simulate the process in reduction furnace, CFD software was used to simulate the flow, heat transfer and chemical reaction process in reduction furnace and to analyze the change law of silicon deposition rate, SiHCl3 conversion rate, silicon production rate and unit energy consumption along with H2 mole fraction, silicon rod height and silicon rod diameter. The results can provide basis and reference for the practical production.
2 Mechanism of chemical reactions
After distillation and purification, SiHCl3 enters the silicon reduction furnace and is reduced by H2. Chemical vapor deposition reaction occurs and polysilicon deposes on the surface of silicon rod. The mechanism of gas phase reactions and surface reactions in polysilicon reduction furnace is listed in Table 1 and Table 2, respectively [15-16], where A is pre-exponential factors, E is molecular activation energy and α is temperature exponent in the Arrehnius reaction rate formula.
Table 1 Mechanism of gas phase reactions in polysilicon reduction furnace

Table 2 Mechanism of surface reactions in polysilicon reduction furnace

3 Numerical simulation of chemical vapor deposition reaction
3.1 Geometric model
Taking 18 pairs of silicon rods for example, the structure of polysilicon reduction furnace is shown in Fig. 1. The subject of the furnace is bell-jar type. The silicon rods are uniformity arranged along circumference with three circles. The inlet and outlet are uniformly distributed on the chassis. The whole shell and chassis are equipped with cooling water jacket. The wall temperature retains stable through being cooled by circulating water.

Fig. 1 Structure of reduction furnace
With the consideration of the complexity of real model, we need to simplify the structure of reduction furnace. The assumptions are as follows: the flow and chemical reaction around each silicon rod are almost the same. Annular cylinder is taken as flowing space. Internal cylindrical surface is the deposition surface and external cylindrical surface is the boundary between silicon rods. Gas mixture enters through the upper surface and exhaust gas discharges from the lower surface.
The geometric model established in this work is shown in Fig. 2. The height of cylinder is 1500 mm and the diameter is 300 mm. The silicon rod diameter is 100 mm. The division of grid is completed by using structured grids. The near-wall grid is densified and the settled grid number is 94000. After the test of grid independence, grid density has already met the accuracy requirement.

Fig. 2 Simplified geometric model
3.2 Mathematical model
The transport process of mass, momentum and energy in the reduction furnace is considered simultaneously.
Mass conservation equation:
 (1)
(1)
Momentum conservation equation:
 (2)
(2)
 (3)
(3)
 (4)
(4)
Energy conservation:
 (5)
(5)
Component mass conservation equation:
 (6)
(6)
where ρ is density; u and u, v, w are velocity vector and its three velocity components separately; μ is viscosity; p is pressure; S is source term; T is thermodynamic temperature; λ is thermal conductivity; cp is specific heat capacity at constant pressure; ci is mole fraction of component i; Di is diffusion coefficient of component i.
3.3 Numerical calculation methods and boundary conditions
The chosen pressure-velocity coupling arithmetic is SIMPLE and turbulence model is k-ε model. The chemical reaction is solved by EDC model. The mechanism of chemical reaction is imported by chemical reaction kinetics software. The gas mixture is taken as an ideal incompressible gas. Both mass diffusion coefficient and thermal diffusion coefficient follow the dynamics theorem. Density, thermal conductivity and viscosity are calculated by ideal gas mixing model. The thermodynamic properties, such as specific heat, diffusion coefficient and viscosity are all calculated by temperature polynomial model.
The inlet velocity is 0.67 m/s and the inlet temperature is 773 K. The H2 mole fraction of gas mixture is 0.83. The outlet is under the condition of outflow boundary. The temperature on the silicon rod surface is 1373 K and the wall is under the condition of adiabatic boundary.
3.4 Reliability verification of model
To insure the reliability of model results, the same geometric model and boundary condition as references [15-19] are adopted (as mentioned). The calculation results compared with the results of literature are shown in Fig. 3.

Fig. 3 Comparison of silicon growth rate between current model result and results given in literatures
It can be seen that the results of numerical simulation are in agreement with the results given in the literatures. It shows that the calculation model in this paper is reliable and can be used for numerical simulation of chemical vapor deposition reaction in polysilicon reduction furnace.
4 Analysis of simulation results
4.1 Result analysis of flow field
Figure 4 shows the contour of velocity in cross section (z=0.3, 0.6, 0.9, 1.2, 1.5 m).

Fig. 4 Contour of velocity in cross section
As can be seen from fig. 4, flow velocity in the annular channel is relatively high except for the area near the silicon rod and wall. The gas velocity increases with the growth of height and the maximum velocity is 1.25 m/s. This is mainly because the volume flow rate of gas increases with the growth of height caused by chemical reaction. This result is just opposite to the result in Ref. [11] without considering chemical reactions. Further, it confirms that the results ignoring chemical reactions deviate from its actual situation largely.
4.2 Result analysis of temperature field
Figure 5 shows the contour of temperature in cross section (z=0.3, 0.6, 0.9, 1.2, 1.5 m).
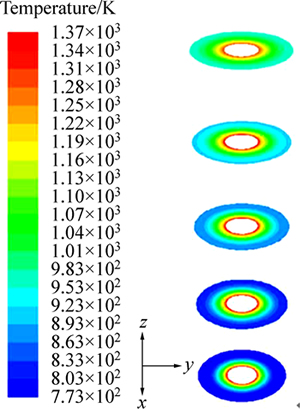
Fig. 5 Contour of temperature in cross section
It is evident from Fig. 5 that the temperature near the silicon rod is higher and the temperature decreases as the distance increases away from the silicon rod. The average temperature of wall is 847 K. The gas is heated and high temperature area expands continually when the silicon rod height increases. The average temperature in the outlet is 1043 K.
4.3 Result analysis of species concentration field
Figure 6 shows the contour of mole fraction of SiHCl3, HCl and SiCl4 in cross section (z=0.3, 0.6, 0.9, 1.2, 1.5 m), respectively.
It is evident from Fig. 6 that the mole fraction of SiHCl3 (as reactant) near the silicon rod is smaller and it increases with the distance from the silicon rod. It is because the temperature is higher and the reaction rate is faster near the silicon rod. SiHCl3 is consumed and the mole fraction of SiHCl3 decreases with the growth of silicon rod height. The changing trend of HCl and SiCl4 (as product) is in contrast to that of SiHCl3. HCl and SiCl4 are generated and the mole fraction of HCl increases when the silicon rod height is increasing.
4.4 Result analysis of silicon deposition rate
Figure 7 shows the curve of silicon surface deposition rate along the silicon rod height.
As can be seen from Fig. 7, silicon surface deposition rate increases sharply at first (z<0.4 m) and then changes a little with the growth of silicon rod height (z>1.0 m). This illustrates that gas phase diffusion is the main controlling factor of chemical vapor deposition reaction are the high temperature of 1373 K. The gas velocity is bigger and the temperature is higher in upper area. So, silicon surface deposition rate increases with the growth of silicon rod height. The situation of top-heavy, which means that that the lower silicon rod is thinner and the upper silicon rod is thicker, will appear during the growing process of the silicon rod. When the thickness difference reaches a certain extent, there is a danger of silicon rod collapse [20]. The average silicon deposition rate on silicon rod surface is about 2.871× 10⁻⁴ kg/(m2・s) (7.39 μm/min), which is consistent with practical production.

Fig. 6 Contour of species mole fraction in cross section:
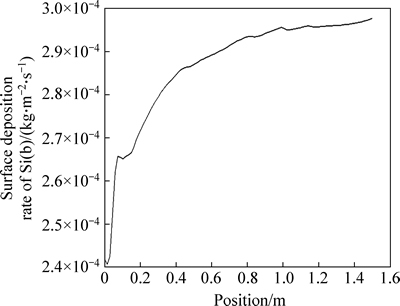
Fig. 7 Curve of silicon surface deposition rate with silicon rod height
5 Analysis of deposition characteristic
5.1 Influence of gas component in inlet
Different H2 mole fraction of gas mixture in the inlet is selected to analyze the influence of gas component on deposition characteristic. Figure 8 shows the change law of silicon growth rate, SiHCl3 conversion rate, silicon production rate and unit energy consumption with the H2 mole fraction. Here, SiHCl3 conversion rate is the ratio of SiHCl3 participating in chemical reactions to SiHCl3 entering the reduction furnace. Silicon production rate is the ratio of silicon depositing on the surface of silicon rod to silicon entering the reduction furnace. Unit energy consumption is the ratio of total energy consumption to silicon production.
The figure shows that as H2 mole fraction increases, silicon growth rate first increases constantly and reaches the maximum when H2 mole fraction is 0.8-0.85. Subsequently, it decreases. However, SiHCl3 conversion rate and unit energy consumption decrease firstly and then increase. It is mainly because at low H2 concentration (high SiHCl3 concentration), silicon growth rate is limited by chemical reactions. In a high concentration environment SiHCl3 is prone to thermal decomposition reaction to generate SiCl4. So, silicon growth rate decreases and SiHCl3 conversion rate increases with the increase of SiHCl3 mole fraction. Otherwise, at high H2 concentration (low SiHCl3 concentration) silicon growth rate is limited by mass; SiHCl3 conversion rate increases with the decrease of SiHCl3 mole fraction. Total energy consumption is almost steady with the growth of H2 mole fraction, so unit energy consumption firstly decreases and then transports. There is a lack of SiHCl3 on the surface.Therefore, silicon growth rate lineally decreases and increases, which also shows a contrary tendency with silicon growth rate. Firstly, silicon depositing on the surface increases and silicon entering the reduction furnace decreases with the growth of H2 mole fraction. So, silicon production rate increases constantly. Then, silicon depositing on the surface and silicon entering the reduction furnace both decrease and the decrease rate of the latter is higher than that of the former, which leads to the further increase of silicon production rate.
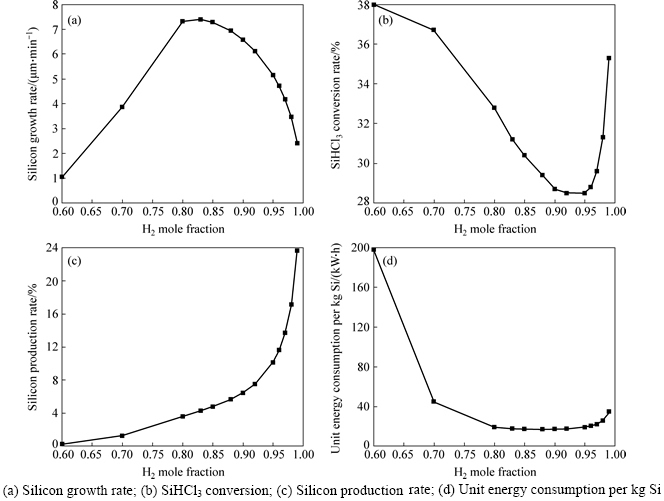
Fig. 8 Curve of deposition properties with H2 mole fraction:
Taking into account of all factors, such as silicon growth rate, SiHCl3 conversion rate, silicon production rate and unit energy consumption, the optimal H2 mole fraction is 0.8-0.85.
5.2 Influence of silicon rod height
All other conditions (such as H2 molar fraction, mass flow rate and temperature of gas mixture in the inlet, surface temperature and diameter of silicon rod) remaining the same, the effect of silicon rod height on deposition properties is studied with silicon rod height from 1.5 m to 4 m. Figure 9 shows the curve of SiHCl3 conversion rate, silicon production rate, silicon growth rate and unit energy consumption with silicon rod height.
From Fig. 9, it is evident that SiHCl3 conversion rate, silicon production rate and silicon growth rate increase with the growth of silicon rod height. It is mainly because the gas velocity, temperature and reaction rate are higher in upper area. The results are in agreement with the above change law of silicon surface deposition rate with silicon rod height. However, unit energy consumption decreases sharply, which coincides with the increase of silicon output with the growth of silicon rod height.
All indexes show that the higher silicon rod is better. But the higher the silicon rod is, the higher the gravity center becomes. The top-heavy situation caused by the different deposition rate up and down will become worse and it will raise the possibility of collapse of silicon rod in actual production. Considering the above situation, now the actual silicon rod height is limited to be below 3 m.
5.3 Influence of silicon rod diameter
All other conditions (such as H2 molar fraction, mass flow rate and temperature of gas mixture in the inlet, surface temperature and height of silicon rod) remaining the same, the effect of silicon rod diameter on deposition properties is studied with silicon rod diameter from 20 mm to 200 mm. Figure 10 shows the curve of deposition characteristic with silicon rod diameter.
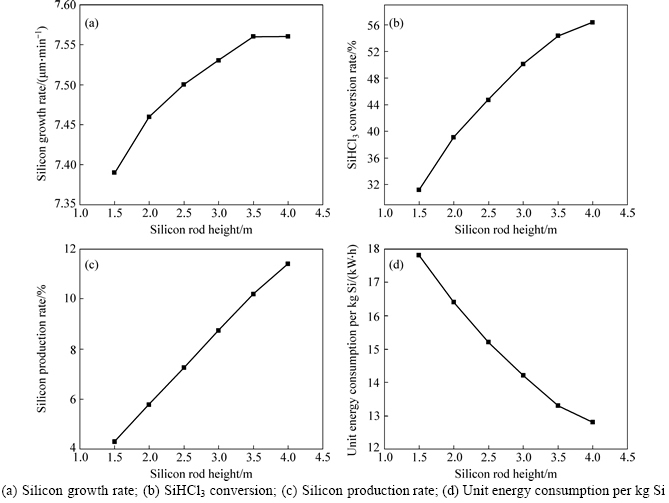
Fig. 9 Curve of deposition properties with silicon rod height:

Fig. 10 Curve of deposition properties with silicon rod diameter:
From fig. 10 we can see that SiHCl3 conversion rate and silicon production rate increase with the growth of silicon rod diameter due to the increase of deposition area. While silicon growth rate decreases firstly and then increases. It is mainly because the increase rate of deposition area is higher than silicon production rate when the silicon rod diameter is below 120 mm. After the silicon rod diameter is over 120 mm, the relationship between the increase rate of deposition area and the increase rate of silicon production is exactly the opposite. With the growth of silicon rod diameter, unit energy consumption first decreases sharply, then becomes steady. It is mainly because the increase rate of total energy consumption is lower than silicon production rate when the silicon rod diameter is below 120 mm.
Considering all the factors, the bigger silicon rod diameter is better. The optimal silicon rod diameter must be over 120 mm. The uneven phenomenon of silicon growth rate on silicon rod surface will become more serious during the process of practical production. At present, the silicon rod diameter is about 150 mm. The increase of reaction area and silicon production mainly depends on the number of silicon rods.
6 Conclusions
1) The flow, heat transfer and chemical reaction process in polysilicon reduction furnace are simulated by CFD software. The influence of H2 mole fraction, silicon rod height and silicon rod diameter on deposition characteristic is analyzed.
2) The results show that the gas velocity is bigger and the temperature is higher in upper area. As H2 mole fraction increases, silicon growth rate increases firstly and then decreases. The optimal H2 mole fraction is 0.8-0.85. Silicon growth rate increases with the growth of silicon rod height. Based on the reaction, the higher silicon rod is better. The situation of top-heavy will appear during the growing process of silicon rod, so the actual silicon rod height is limited to be below 3 m. With the increase of silicon rod diameter, silicon growth rate decreases firstly and then increases. In theory, the bigger silicon rod diameter is better. The optimal silicon rod diameter must be over 120 mm. The research results can be used to conduct practical production.
References
[1] JIANG Xiao, JIANG Rong-hua, ZHOU Hong-wei. A very competitive polysilicon industry throughout the world [J]. Advanced Materials Industry, 2012(6): 28-36. (in Chinese)
[2] LUQUE A. Handbook of photovohaic science and engineering [M]. New York: John Wiley & Sons Inc, 2010: 167-172.
[3] LIU Xiao-feng, WANG Ling. Analysis and comparison of the chemical preparation methods of polysilicon [J]. Advanced Materials Industry, 2011(6): 65-69. (in Chinese)
[4] COSO G D, CANIZO C D, LUQUE A. Disclosing the polysilicon deposition process [C]// The 25th European Photovoltaic Solar Energy Conference and Exhibition/5th World Conference on Photovoltaic Energy Conversion. Valencia, 2010: 1216-1219.
[5] HE En, XIE Gang, HOU Yan-qing, LIN Yan, YU Xiao-hua. Thermo-dynamic analysis of SiHCl3 hydrogen reduction process [J]. Chemical Engineering, 2011, 39(11): 39-43. (in Chinese)
[6] GUAN Jian, LAI Xi-de, LIU Dong-qi, WANG Jian-lu. The temperature simulation in large-scale polycrystalline silicon furnace [J]. Machinery Design & Manufacture, 2009(4): 95-97. (in Chinese)
[7] LING Meng, LAI Xi-de, LIU Dong-qi. The research of the radiative heat transfer models for the hearth inside polycrystalline silicon reduction furnace [J]. Machinery Design & Manufacture, 2009(4): 125-127. (in Chinese)
[8] YAO Xin, WANG Shao-fen, YAN Da-zhou. Three-dimensional numerical simulation and optimization of polysilicon reduction furnace based on fluent [J]. Energy Saving of Non-ferrous Metallurgy, 2011(4): 48-52, 56. (in Chinese)
[9] WANG Zi-song, HUANG Zhi-jun, QIN Pan, LEI Li-guang, YIN Yong-xiang, DAI Xiao-yan. Numerical simulation of polysilicon rods’ growth environment in Siemens CVD reactor [J]. Journal of Synthetic Crystals, 2012, 41(2): 507-512. (in Chinese)
[10] HUANG Zhe-qing, LIU Chun-jiang, YUAN Xi-gang. Numerical simulation of flow and heat transfer in a novel polysilicon reduction furnace [J]. CIESC Jorunal, 2013, 64(2): 484-489. (in Chinese)
[11] SUN Peng. Study on polysilicon reduction furnace’s flow field and temperature field through numerical simulation and energy analysis [D]. Wuhan: Huazhong University of Science and Technology, 2012. (in Chinese)
[12] ZHANG Hua-qin, MAO Lu-rong, ZHOU Ji-wei, CHEN Jia-biao. Numerical simulation and process improvement of polysilicon reduction furnace’s flow field [J]. China’s Solar Energy, 2009(7): 37-40. (in Chinese)
[13] ZHANG Pan, WANG Wei-wen, DONG Hai-hong, WU Yu-lei, CHEN Guang-hui, LI Jian-long. Numerical simulation of the chemical vapor deposition of polocrystalline silicon in a trichlorosilane and hydrogen system [J]. Journal of Synthetic Crystals, 2010, 39(2): 494-499. (in Chinese)
[14] ZHANG Pan, WANG Wei-wen, FAN Jun-ling, CHEN Guang-hui, LI Jian-long. Numerical simulation of the chemical vapor deposition of polycrystalline silicon in a 3D furnace [J]. Acta Energiae Solaris Sinica, 2012, 33(3): 511-516. (in Chinese)
[15] HUANG Guo-qiang, MAO Jun-nan, WANG Hong-xing, HUA Chao. 3-D CVD model of polysilicon in trichlorosilane-hydrogen system [J]. Journal of Synthetic Crystals, 2012, 41(3): 680-686. (in Chinese)
[16] MAO Jun-nan. Simulation and optimization of polysilicon reduction process [D]. Tianjin: Tianjin University, 2012. (in Chinese)
[17] COSO G D, CANIZO C D, LUQUE A. Chemical vapor deposition model of polysilicon in a trichlorosilane and hydrogen system [J]. Electrochem Society, 2008, 155(6): 485-491.
[18] HABUKA H, NAGOYA T, MAYUSUMI M, KATAYAMA M, SHIMADA M, OKUYAMA K. Model on transport phenomena and epitaxial growth of silicon thin film in SiHC13-H2 system under atmospheric pressure [J].Crystal Growth, 1996, 169(1): 61-72.
[19] HABUKA H, AOYAMA Y, AKIYAMA S, OTSUKA T, QU Wei-feng, SHIMADA M, OKUYAMA K. Chemical process of silicon epitaxial growth in a SiHC13-H2 system [J]. Crystal Growth, 1999, 207(1/2): 77-86.
[20] KE Zeng-peng, YANG Zhi-guo, LIU Xin, ZONG Wen-ting. Downfallen of polysilicon filaments in polycrystailine silicon CVD reactor [J]. Semiconductor Technology, 2010, 35(10): 994-998. (in Chinese)
(Edited by YANG Hua)
Foundation item: Project(12C0379) supported by Scientific Research Fund of Hunan Province, China
Received date: 2014-11-24; Accepted date: 2015-05-07
Corresponding author: XIA Xiao-xia, lecture, Doctoral candidate; Tel: +86-731-58292215; E-mail: xiaxiaoxia620@163.com

