�����ܱ���AA5052-H32��ĵij�����
��Դ�ڿ����й���ɫ����ѧ��(Ӣ�İ�)2020���3��
�������ߣ�S. K. BARIK R. G. NARAYANAN N. SAHOO
����ҳ�룺603 - 618
�ؼ��ʣ�����������������ԤӦ����������
Key words��shock wave; impact; bending pre-strain; formability
ժ Ҫ�����ü������о�����ԤӦ���ѹ����AA5052-H32��ij�����Ϊ��Ӱ�졣�������ι��θ߶ȡ���ЧӦ���Ӧ���ֲ���Ӳ�Ⱥ;����ߴ��ݱ�ȸ��ֳ��β������ڰ����ӡ��Բ��������Hill��s 1948�����������ЧӦ��ֲ���ͨ��Hollomon�ݴζ��ɼ�����ЧӦ���ֲ����ڰ�ĵ��м�λ�ð�װһӦ��Ƭ�Լ����ι�����Ӧ����ݻ���Ӧ��-ʱ��ͼ֤ʵ��ֵӦ��ļ������������ڽϸߵ�ѹ�����������ӡ����β����ı仯֤ʵ������û��Ӧ��ֲ���������±��������졣��ѧ����֯��ʾ���ᾧ�ڳ�����κ���չ����������ˣ����ϵij�����Ϊ��ȡ����ԤӦ��Ĵ�С��Ҳȡ����ѹ���ı仯��
Abstract: The effect of bending pre-strain and pressure on the forming behavior of AA5052-H32 sheets has been studied using a shock tube. Various forming parameters like dome height, effective strain and stress distribution, hardness, and grain size evolution have been measured. Circular grids are printed on the sheets and Hill��s 1948 yield criterion is used to calculate the effective strain distribution. The effective stress distribution is calculated by using the Hollomon��s power law. The strain evolution during the forming process is monitored by mounting a strain rosette at the mid location of the sheet. The strain-time graph confirms the sharp rise in the peak strain and it increases significantly at higher pressure. The variation in the forming parameters asserts that the material stretches uniformly without strain localization. The optical microstructures also depict that the equiaxed grains are stretched and elongated after the shock deformation. This analysis confirms that the forming behavior of the material is dependent both on the degree of pre-strain and the change in pressure.
Trans. Nonferrous Met. Soc. China 30(2020) 603-618
S. K. BARIK, R. G. NARAYANAN, N. SAHOO
Department of Mechanical Engineering, Indian Institute of Technology Guwahati, Guwahati 781039, India
Received 31 May 2019; accepted 12 November 2019
Abstract: The effect of bending pre-strain and pressure on the forming behavior of AA5052-H32 sheets has been studied using a shock tube. Various forming parameters like dome height, effective strain and stress distribution, hardness, and grain size evolution have been measured. Circular grids are printed on the sheets and Hill��s 1948 yield criterion is used to calculate the effective strain distribution. The effective stress distribution is calculated by using the Hollomon��s power law. The strain evolution during the forming process is monitored by mounting a strain rosette at the mid location of the sheet. The strain-time graph confirms the sharp rise in the peak strain and it increases significantly at higher pressure. The variation in the forming parameters asserts that the material stretches uniformly without strain localization. The optical microstructures also depict that the equiaxed grains are stretched and elongated after the shock deformation. This analysis confirms that the forming behavior of the material is dependent both on the degree of pre-strain and the change in pressure.
Key words: shock wave; impact; bending pre-strain; formability
1 Introduction
Due to the increasing awareness of global warming, there are efforts shown by the aerospace and other industries towards the reduction in fuel consumption and green-house emission. One such effort is the use of lightweight materials of higher strength. It has been observed from the review of JOOST [1] that the fuel efficiency can be improved by 6%-8% for each 10% reduction in weight. While FRIDLYANDER et al [2] have shown that weight savings of 20%-25% can be achieved by replacing the steel surface body of the automobile with lightweight materials such as aluminium or magnesium alloys. However, aluminium alloys are generally preferable because of their ease of availability, higher specific strength, increased resistance to corrosion, acceptable formability and better recycling potential. Despite several advantages, their inferior formability at room temperature conditions restricts their application. The formability of aluminium alloys can be increased either by forming at elevated temperature or by conducting the forming process at higher strain rates [3-6]. AHMED et al [7] have observed that if the forming process is performed by high energy rate forming (HERF) processes, the formability can be enhanced significantly.
The strain rate has a significant effect on the material behavior during the deformation process as well as on the final properties of the product. Almost all materials are strain-rate dependent above a threshold [3,6-10]. Therefore, determining the material properties at higher strain rates is vital. Traditionally, for the sheet materials, quasi-static tensile test and split Hopkinson pressure bar (SHPB) test are widely used to extract material properties at lower and higher strain rates, respectively. However, the tests are limited to deformation in the uniaxial direction. In order to understand the forming behavior of a material in multi-axial direction, quasi-static bulge test in different strain rate ranges, drop hammer rig, and modified SHPB tests are utilized [11-14].
In addition, various HERF processes like electro-magnetic forming (EMF), electro-hydraulic forming (EHF), and explosive forming (EF) are used to evaluate formability at different strain rates. These high velocity forming processes significantly increase the limiting strain by improving the formability of sheets [15-17]. In these forming processes, the most influencing factor is the inertial stabilization [16-18]. The inertial forces generated due to high-velocity forming helps the material to avoid sharp local velocity gradient on the material which produces additional tensile stress in the safe region of the sheet and helps in further stretching by stabilizing the neck growth. AHMED et al [7] assessed the formability of AA5052 alloys by an EHF process in terms of forming limit diagram (FLD) and compared it with the conventional forming results. It was confirmed that the limit strains were increased by nearly 45%-50% due to the inertial stabilization. Another important factor is the material constitutive behavior which correlates the increment in formability by flow stress, strain, strain-rate, temperature and other microstructural quantities [4,19-21]. The high- velocity forming can also be achieved by explosive forming to understand the material FLD at different rates [17]. GREY and HUANG [22] have examined the response of thin aluminium during blast loading by using explosives. Besides several advantages in the above referred HERF processes, the most common limitations are higher capital cost, complexity in instrumentation and difficulties in handling.
In order to minimize the above limitations, a shock tube has been used in various studies to explore the dynamic response of thin metallic sheets [23,24]. In the shock tube, the initiation of the shock wave is caused by the rapid release of air. It is a pneumatically controlled device where a high-pressure chamber is separated from a low-pressure chamber by a diaphragm. When the pressure difference reaches a critical value, the diaphragm ruptures and a high-velocity shock wave is generated and it travels down the shock tube and hits the sheet. Using this method, KUMAR et al [25] studied the effect of plate curvature on blast response of aluminium panels using a shock tube. STOFFEL [26] performed experimental studies on steel, copper and aluminium plates, and modeled a mathematical relation by considering elasto-plastic behavior, kinematic hardening and strain rate sensitivity. JUSTUSSON et al [27] used a shock tube to extract the bi-axial rate-dependent properties of aluminium. The out-of-plane deflection and strain fields were recorded by using digital image correlation (DIC) technique. While studying the effect of high-velocity shock wave on the microstructure and texture evolution, RAY et al [28] observed the intra-granular misorientation of the microstructure in AA5086 aluminium alloys when it is deformed by the shock wave. A similar attempt was performed by BISHT et al [29] on pure Cu material. Deformation bands and deformation twins were observed in the microstructure.
Since the shock tube has been used in several studies to perform plastic deformation of the sheet and sandwich materials, it is proposed as a good alternative device to study the forming behavior of the sheet material at different rates of loading conditions. However, the effect of pre-strain on the forming behavior of the material during shock- wave based deformation has not been studied. The forming behavior of the pre-strained sheets needs to be understood under different pressure loading conditions.
Hence, the present study aims to understand the forming behavior of AA5052-H32 sheets of 1 mm in thickness at different pressures and pre-strain (bending) levels. The forming responses monitored are dome height, strain evolution, effective strain and stress distribution, hardness and grain size, after deformation. Generally, in high- velocity impact testing, high-speed 3D DIC system has been used to determine the deformation history [24,25]. However, it has been observed that the strain gauge can also be used to measure the strain rate and the results are validated with the DIC results [30]. Hence, in this work, strain rosette has been mounted at the mid-location of the sheet to measure the strain evolution. Furthermore, circular grids printed on the sheets have been used to measure the effective strain and stress distribution after the deformation. The pre-strain is achieved by bending the sheets to different radii of curvatures as it shows improved formability [31,32].
2 Experimental
2.1 Specimen geometry and material
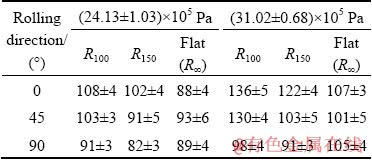
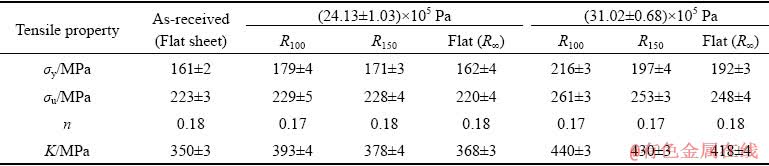
In the present work, in order to demonstrate different levels of pre-straining, sheets are bent to different curvatures by using a sheet rolling machine. Three different radii of curvatures such as flat plate (R��), 150 mm radius of curvature (R150) and 100 mm radius of curvature (R100) are chosen, as shown in Fig. 1. The curved specimens are 240 mm long and 210 mm wide, and the flat specimens are 210 mm long and 210 mm wide. AA5052-H32 sheets of 1 mm in thickness are considered during this study. All the samples have the same free area to deform with dimensions of 180 mm (length) �� 180 mm width. In order to characterize the material properties, tensile tests are performed in accordance with ASTM-E8. ASTM-E517 is followed to measure the plastic strain ratio (r) across 0��, 45�� and 90�� to the rolling direction. The tensile tests are conducted in a 200 kN universal testing machine with a crosshead speed of 1 mm/min. All the tests are conducted thrice to ensure the repeatability. The mechanical properties are summarized in Table 1. The chemical composition of the base material is obtained by EDX analysis and the elemental distribution is shown in Table 2. In order to evaluate the forming behavior like effective strain and effective stress distribution in the deformed region, circular grids with dimension of (1.924��0.013) mm are printed on the surface of all the samples prior to the bending by screen printing method, as shown in Fig. 2.
2.2 Shock tube as impact gas loading device
In the present work, a shock tube has been introduced to apply shock loading on the sheet materials. A shock tube is a device, which generates a gas flow condition that is difficult to attain in normal gas flowing devices. It is a laboratorydevice for producing high-velocity, pressure and temperature condition for a very short time period, which enables its application in the aerodynamic and thermo-chemical engineering field. It consists of a long rigid cylinder that is divided into a high-pressure driver section and a low pressure driven section. Both the sections are separated by a diaphragm made of a metal sheet or by the layers of thin Mylar sheet. When the pressure difference across both the driver and driven section reaches a threshold value, the diaphragm ruptures, and it creates a rapid release of gas, which generates a shock wave inside the tube. It propagates along the driven section with a Mach number (Ms) greater than one. The details of shock tube facility established at Indian Institute of Technology Guwahati, India, are given in Ref. [33].
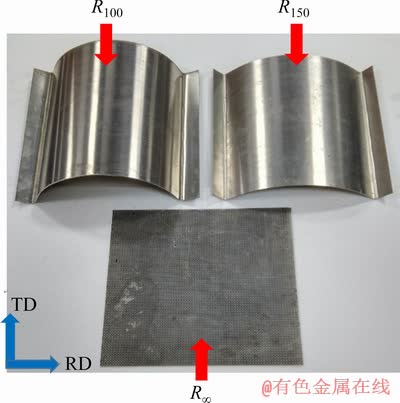
Fig. 1 AA5052 with different radii of curvature
Table 1 Initial mechanical properties of AA5052-H32 sheet

Table 2 Chemical composition of AA5052-H32 base sheet (wt.%)
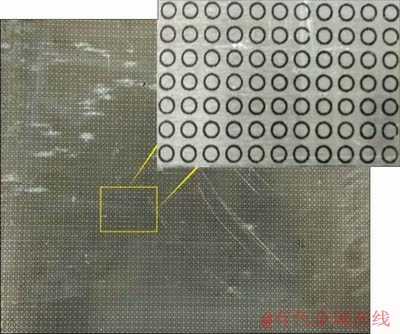
Fig. 2 Circular grids printed on surface of specimen by screen printing method
In a shock tube, the high-pressure field zone is created in a very short interval of time after the incident shock wave is reflected back. The equations describing the change in pressure and temperature with respect to the speed of the shock wave are well described in Ref. [25]. This advantage can be integrated to perform standard bulge test at different strain rates by replacing the end wall of the shock tube with a sheet material. This is equivalent to perform a bulge test using the forced air instead of a hydraulic fluid. Generally, hydraulic bulge tests are limited to low strain rate whereas, in shock tube, it can be used to study the material properties at intermediate, and at high strain rates, either by changing the diaphragm thickness or the driver gas.
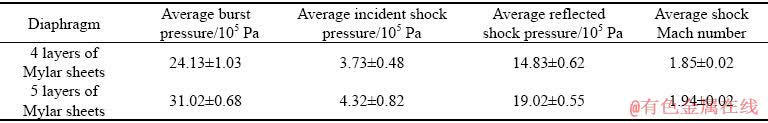
In the present work, a shock tube has been used having an overall length of 4 m, consisting of a 2 m driver section and 2 m of driven section, as shown in Fig. 3. The inner diameter of the driver section and the driven section is 55 mm with a thickness of 10 mm. Mylar sheets with a thickness of 0.25 mm are chosen as the diaphragm due to its strength and ability to rupture at a consistent bursting pressure. Two different bursting pressures have been attained by rupturing a stack of 4 and 5 layers of Mylar sheet. A digital pressure gauge is installed in the driver section to measure the bursting pressure. In the case of 4 layers of Mylar sheet, an average bursting pressure of (24.13��1.03)��105 Pa has been attained, whereas (31.02��0.68)��105 Pa of bursting pressure has been obtained when 5 layers of Mylar sheet are bursted. The burst pressures and plate curvature are run in triplicate to ensure repeatability.
2.3 Shock tube experiments
As the present study is carried out to understand the forming behavior of the pre-strained (curved) sheets in comparison with the flat sheets, the specimens are clamped such that the convex surface of the specimens faces towards the shock tube (Fig. 3). In all the curved fixture units, sufficient forming area with dimensions of 180 mm �� 180 mm is provided, such that there should not be any restriction to the free forming of the samples. The final out-of-plane deflection of the specimens is measured by a vertical height measuring dial gauge having precision of ��0.01 mm. For convenience, the rolling direction of all the samples has been considered as X-axis, whereas transverse direction has been considered as Y-axis.
In order to witness the variation in hardness and grain size, the deformed sheets are cut from three different locations, as shown in Fig. 4. Vickers hardness has been measured by applying 0.49 N load for 10 s. The deformed samples are perfectly polished and chemically etched by Keller��s reagent under ambient conditions to reveal the micro- structure of the deformed region. The average grain size has been measured by line intercept method as per ASTM E1382.
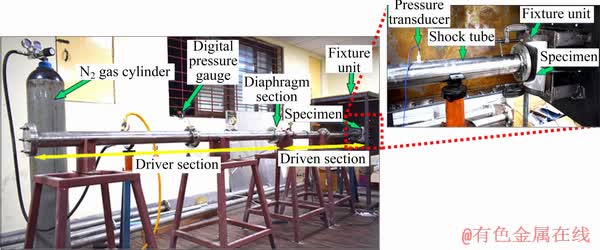
Fig. 3 Shock tube facility used for experiments
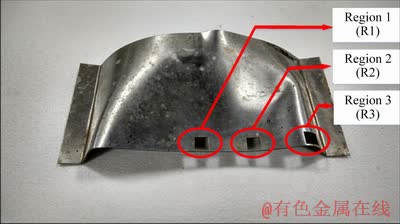
Fig. 4 Regions considered for grain size and hardness measurement
2.4 Strain evolution measurement
In order to measure the strain evolution generated on the sample due to the impact of the shock wave, rectangular strain rosettes are mounted closer to the center of the testing samples opposite to the loading direction. The strain rosette is able to generate results along 0��, 45�� and 90�� to the rolling direction. Each strain gauge has a gauge length of 6.35 mm and a resistance of (350��2) ��. The strain rosettes have a gauge factor of 2.01. Three strain gauges of a rosette are connected to three Wheatstone quarter bridge circuits separately (Fig. 5). For the strain gauge application, Wheatstone bridge circuit is used as a sensing circuit due to its ability to detect small changes in resistance when the load is applied.
In order to balance the circuit, a variable resistance potentiometer is connected which helps to nullify the initial residual voltage present in the circuit. When a load is applied at the opposite surface to the strain gauge, due to the tension on the surface of the material, the resistance changes and it results in a particular voltage output at the end of the circuit. The output of the Wheatstone bridge can be related to the strain produced over the specimen by the relation [34]:
 (1)
(1)
where Vmeas is the measured voltage output from the Wheatstone bridge circuit, Vin is the input voltage to the Wheatstone bridge circuit, FG is the gauge factor of the strain gauge and �� is the in-plane strain generated on the specimen. The output strain response from the strain gauge is in terms of voltage from the Wheatstone bridge and has very low strength. Hence, a voltage amplifier (INA 128) has been used to magnify the response. The voltage amplifier has a provision of gain factor 500 and 1000 with an operating bandwidth frequency in the range of 1-40 kHz, which is sufficient to capture the strain signal developed due to shock loading using an oscilloscope. The strain response has been captured thrice for a single set of the experiment in order to ensure its repeatability.
2.5 Strain and stress distribution
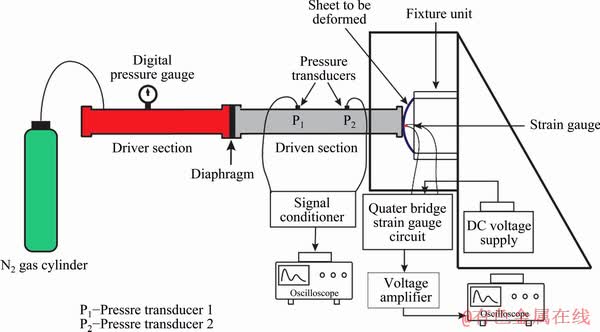
Fig. 5 Schematic of shock tube with instrumentation
In order to analyze the sheet deformation, effective strain and effective stress are measured for different pre-strained sheets under different pressure conditions. Circular grids with diameter of (1.924��0.013) mm are printed by keeping an equal distance of 1 mm between the two circles. The circle diameter before and after sheet deformation has been measured by a surface profile projector which has a precision of ��0.001 mm.
Since the material is anisotropic, Hill��s 1948 yield criterion has been used to calculate the effective strain distribution generated over the deformed surface after shock loading [35]. In Hill��s 1948 yield function, the major strain, minor strain and the thickness strain (d��1, d��2, d��3) are evaluated from experiments for each circle in the deformed region after the shock loading across both X and Y axes. The anisotropic coefficients, F=rRD (anisotropic coefficient across rolling direction), G=rTD (anisotropic coefficient across transverse direction) and H=rRDrTD are also evaluated experimentally (Table 1). All these values are given as input to the Hill��s 1948 yield function to calculate the effective strain ( ) distribution after shock deformation. The effective stress (
 ) is calculated by assuming the material to follow the power law of strain hardening,
  , where K and n are strength coefficient and strain hardening exponent, respectively. The K and n values of the parent sheet (as given in Table 1) cannot be used for effective stress () evaluation, as the values would have changed after shock deformation. For this reason, tensile samples having gauge length of 25 mm are cut from the deformed sheets along the rolling direction by the wire electron discharge machine. It is believed that the K and n values calculated from the deformed samples would ensure the correct evolution of effective stress. The deformed tensile samples are tested in a universal testing machine with a cross-head speed of 1 mm/min.
3 Results and discussion
3.1 Calibration of shock tube pressures
Shock tube experiments are conducted thrice to ensure the repeatability in the bursting pressure by rupturing four and five layers of Mylar sheet. In order to obtain the pressure variation inside the shock tube due to the propagation of the shock wave, three pressure transducers (PCB Piezotronic; USA; Model 113B22) having sensitivity of 14.62��10-5 mV/Pa are mounted in the experimental set-up, as illustrated in Fig. 6. Two pressure transducers are mounted in the driven section to track the pressure profile of the incident and the reflected shock wave and the third one is mounted on a calibration plate to measure the magnitude of the pressure encountered by the experimental specimens. The signals from pressure transducers are sent through a signal conditioner (PCB Piezotronics Model 482C) before getting recorded by the Yokogawa DLM2022 digital oscilloscope (Fig. 6). The pressure signals sensed by the pressure transducers are depicted in Fig. 7. The data have been filtered using a low pass filter code using MATLAB to allow for better visualization. The average incident and reflected pressure for two different experimental conditions are given in Table 3. Since thin sheets are formed during this experiment, pressure transducers are not mounted on the samples for the risk of damage. However, it is observed from the literature that the maximum pressure experienced by the experimental specimen is equivalent to the magnitude of reflected pressure generated during experiment [23].
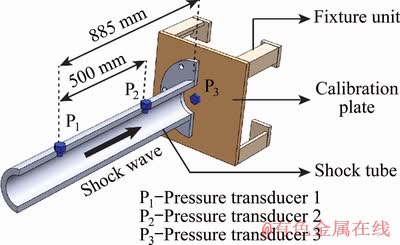
Fig. 6 Location of pressure transducers for calibration of shock tube pressures
3.2 Effect of radius of curvature on out-of-plane deformation
To show the effect of radius of curvature, the X-axis and Y-axis deflection data for the bursting pressure of 31.02��105 Pa is plotted in Fig. 8. From the results, it is illustrated that under the same loading condition, the final out-of-plane deflection for R100 sheet is larger than that for the other two radii of curvature. The flat sheet (R��) shows the least deflection along both the axes. In order to observe the effect of pre-strain (or radii of curvature) on sheet deformation, two distinct types of deformation phenomena, i.e. indentation and flexural mode, are introduced by KUMAR et al [25]. When an external impulsive load acts on a specimen, a localized deformation starts to form at the beginning of deformation. This phenomenon is termed as indentation mode of deformation.
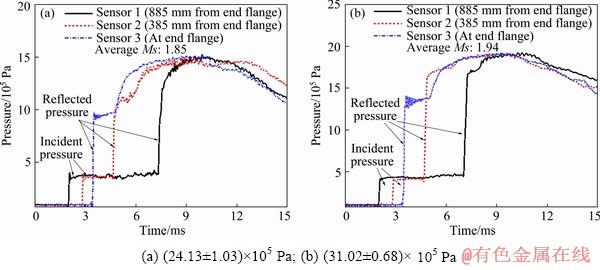
Fig. 7 Pressure jumping across shock wave at different bursting pressures
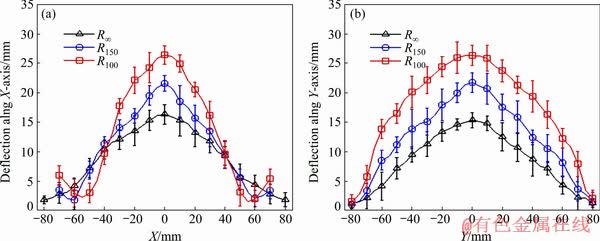
Fig. 8 Deflections along X-axis (a) and Y-axis (b) at (31.02��0.68)��105 Pa of bursting pressure
Table 3 Average pressures obtained from experiments
Together with this, the inertial effect developed due to the impulsive loading generates additional tensile stress on the material which transmits through the specimen progressively and expands the deforming area by superposing over the local deforming region which is termed as flexural deformation. The two different phenomena are illustrated as Stage 2 and Stage 3 of the deformation in Fig. 9.
The different modes of deformation are dependent on various parameters such as pressure, thickness of the sheet and the degree of pre-strain. Due to less rigidity of the sheet, both the indentation mode and flexural mode of deformation are encountered by the sheets during sheet metal forming. However, the predominance of either one results in a significant difference in the final out-of- plane deflection. From Fig. 8, it can be visualized that under the same loading condition, the rate of deformation increases significantly at the mid location with the decrease in radius of curvature (increase in degree of pre-strain). When the high- velocity pressure wave imparts the pre-strained sheets, in the beginning, the deformation takes place due to the indentation. However, with the time, the generated stress wave transmits through the specimen and turns into flexural deformation. With the increase in bending pre-strain (or decrease in radii of curvature), the dominance of indentation mode is larger than the flexural mode before it reaches the plateau region. The final deformed sheets can be visualized from Fig. 10. In the case of R100 sheet, the indentation mode of deformation superposes over the flexural deformation for a longer duration before the sheet reaches the plateau region. Due to the indentation, there is a sharp rise in deformation in R100 sheet than the other two sheets. With the progress of time, the flexural deformation expands the localized indent with the support of the inertial effect in the free-to-deform area. This results in higher out-of-plane deformation. On the other hand, in the case of flat sheet (R��), the deformation is mainly caused by the flexural mode which tries to stretch the sheet throughout the exposed region. In this case, the sheet reaches the plateau region without significant deformation. For R150 sample, because of the influence of both indentation and flexural deformation, the sheet stretches significantly, but the deformation is less than that of R100 sample.
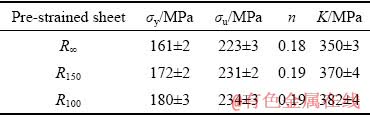
In order to observe the effect of the bending pre-strain on the mechanical properties of the material, tensile tests are performed for the different pre-strained sheets and the results are enlisted in Table 4. The results indicate that the ��y, ��u and K of the material increase with the increase in pre-strain. It is found from existing studies that the pre-strain induces additional strain hardening [20,32], which is responsible for the increase in mechanical strength. The variation of strain hardening exponent (n) is insignificant, though a slight increase is observed in higher degree of pre-strain.
3.3 Effect of pressure on out-of-plane deformation

Fig. 9 Deformation mechanisms of three different radii of curvature samples

Fig. 10 Deformed sheets with different degrees of pre-strain at two different pressures
Table 4 Tensile properties of pre-strained sheets
It is observed from Fig. 10 that R100 sheet has maximum mid-point deformation whereas flat sheet (R��) has the least deformation and the mode of deformation in both cases is different as well. Hence, R100 and flat sheet (R��) are considered for the analysis to understand the effect of pressure on the out-of-plane deformation. Figure 11 clearly illustrates that the final out-of-plane deformation of both sheets increases monotonically with the rise in pressure. The deformation mechanism may be different for both sheets, but the magnitude of deformation is significant. If the percentage of rise in deformation is considered, it is nearly 30%-35% for all the pre-strained sheets. The significant rise in deformation is influenced by the inertial effect developed in the material due to the impulsive nature of shock loading. At higher pressure, the impulsive shock wave generates a larger indent on the specimen at the beginning. With the progress of time, the induced inertial forces are stabilized by generating additional tensile stresses on the material which stretch the specimen uniformly without strain localization. This results in high magnitude of deformation in the exposed region. The sharp rise in deformation at the mid location (Fig. 11) ensures that the initial indentation deformation has significant effect on the final magnitude of deformation. The effect of indentation deformation is significant in R100 sheet whereas flat sheet experiences least because of the dominance of flexural deformation.
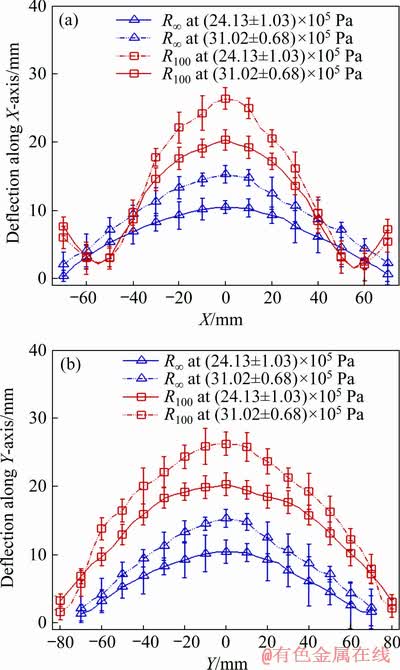
Fig. 11 Deflections along X-axis (a) and Y-axis (b) for flat sheet (R��) and R100 sheet at two different bursting pressures
3.4 Effect of radius of curvature (pre-strain) on strain evolution
The effect of radius of curvature on the strain evolution for a bursting pressure of (31.02��0.68)�� 105 Pa is analyzed and the strain-time histories are illustrated in Fig. 12. The results depict a sharp rise in strain along all the three directions. It is because of the high velocity forming characteristic of the shock tube experiments, in which the material deforms uniformly at a higher rate of strain. The strain-time histories clearly indicate that the deformation process is stretching- dominated. Because of the strain limit of the strain gauges, the final magnitude of strain generated in the material after deformation cannot be confirmed from the results. However, from the strain-time histories, the rate of stretching (strain rate) during the metal forming process can be elucidated. Figure 13 depicts the strain rate generated along 0��, 45�� and 90�� to the rolling direction during the high velocity forming of R100 sheet. The strain rate generated during all the set of experiments conducted during this study is illustrated in Table 5.
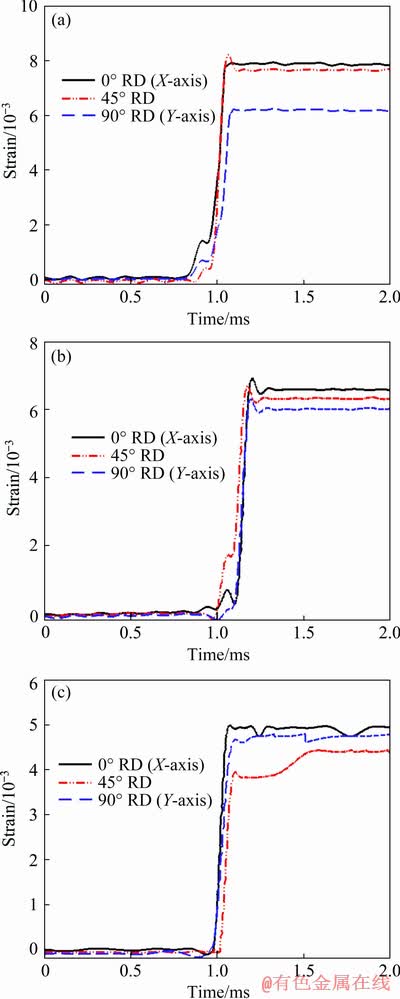
Fig. 12 Strain evolution for R100 (a), R150 (b) and flat (R��) (c) sheet at (31.02��0.68)��105 Pa
The effect of pre-strain on the strain evolution is also illustrated in Fig. 12. The strain generated in the material also depends on the magnitude of deformation. Due to the dominance of indentation mode of deformation in the pre-strained sheets, the strain achieved is larger as compared to the flat sheet. However, during the comparison between the pre-strained sheets, the strain evolution in the case of R100 sheet is sharper and higher in magnitude than that of R150. It is caused by the dominance of indentation mode of deformation for a longer duration in the case of R100 sheet, which helps to stretch the material more than R150 in the mid location before the sheet reaches the plateau region. By comparing the strain magnitude across three different directions to the rolling plane (0��, 45�� and 90��), along 0�� to the rolling direction (X-axis), the magnitude of strain is higher for all the pre-strained sheets. When the pre-strained sheets are deformed plastically, the shock wave generates an elliptical indent at the beginning and it expands with respect to the propagation of the stress wave. This results in significant deformation across X-axis (0�� to the rolling direction). Less strain is evolved across Y-axis (90�� to the rolling direction) and an intermediate value of strain is generated across 45�� to the rolling direction. A similar variation is observed in the case of strain rate calculation from the strain histories, as depicted in Table 5. For all the pre-strained sheets, due to the presence of local deformation, the material stretches sharply at the mid location. In the case of flat sheet, due to the dominance of flexural deformation, biaxial stretching is observed over the exposed area, which results in lower fluctuation of strain across three different directions.
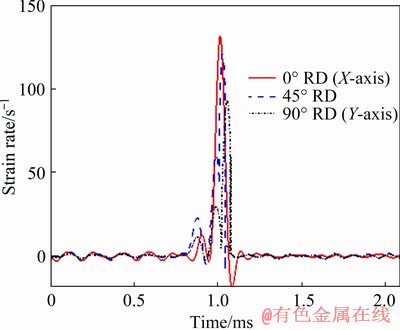
Fig. 13 Strain rate during forming of R100 specimen at (31.02��0.68)��105 Pa
Table 5 Strain rates (s-1) generated during experiments conducted under different loading conditions
3.5 Effect of pressure on strain evolution
The effect of pressure on the strain evolution for different pre-strained sheets (radii of curvature) is analyzed and it is observed that with the increase in pressure, the peak strain generated in the material increases monotonically, as shown in Fig. 14. However, this also depends on the degree of pre-strain. For R100 and R150 cases, the peak strain has increased by 50%-55% with the rise in pressure. Under the same condition, the rise in strain is about 30%-35% for the flat sheet. This increase in strain is affected by two different reasons such as mode of deformation and the inertial effect generated because of the impulsive nature of the shock wave. When the shock wave imparts at a higher pressure, the localized indentation deforms the sheet for a longer duration and this results in higher stretching at the mid-region of the sheets. In the case of the pre-strained sheet, this phenomenon dominates for a longer duration before it changes into the flexural deformation. Together with this, the higher pressure conditions develop higher magnitude of inertial forces which accelerate the deformation mechanism and generate additional tensile strain.
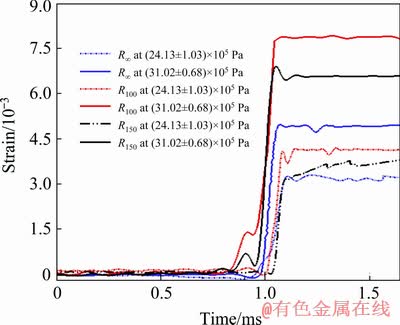
Fig. 14 Evolution of strain at different pressures for different curvature of sheets (0�� RD)
3.6 Effective strain and effective stress distribution
The effective strain distributions across the rolling direction (X-axis) and the transverse direction (Y-axis) are obtained under two different loading conditions. This is obtained by measuring the strains from the circular grids printed on the surface of the specimen after deformation. The mechanical properties, n and K values obtained from the tensile tests of the deformed sheets are used in Hollomon��s power law equation to calculate the effective stress along both the axes. The mechanical properties of the deformed region after the shock loading are given in Table 6.
Due to the contribution of the inertial effect during shock deformation, the material deforms uniformly without strain localization. The additional tensile stresses developed due to the inertial forces help to increase ��y and ��u of the sheets in comparison to the parent sheet irrespective of the degree of pre-strain. The variation in n is not that significant, but K increases significantly after the deformation as compared to the parent sheet. The observation correlates well with the work of LATIF et al [21]. WANG et al [9] also observed the similar behavior in AA5052 sheets when it is deformed by high-speed electromagnetic forming. They showed that a large number of dislocation bands were nucleated and piled up near the grain walls of the material, which results in increase in mechanical strength.
The effects of pressure and pre-strain on the effective strain and stress distribution are shown in Fig. 15 and Fig. 16. With respect to the increase in the degree of pre-strain, the material deforms more in the mid-region due to the dominance of localized indentation. This results in larger material stretching at the mid location and attributes to larger magnitude of effective strain as compared to the flat sheet. However, with respect to the progress of time, the flexural deformation superposes over the local indent, which helps to stretch the sheet uniformly throughout the exposed region. At higher degree of pre-strain, the dominance of indentation mode of deformation is more and this results in more strain for R100 sheet than for R150 sheet. The flexural deformation creates uniform distribution of strain in both X-axis and Y-axis for the flat sheet, whereas due to the presence of local indent, the strain distribution slightly deviates near the indent edge along the X-axis of the pre-strained sheets. The effective stress distribution also follows a similar behavior for all the pre-strained sheets.
Table 6 Tensile properties obtained from sheets subjected to shock deformation with different bursting pressures
3.7 Hardness and grain size distribution
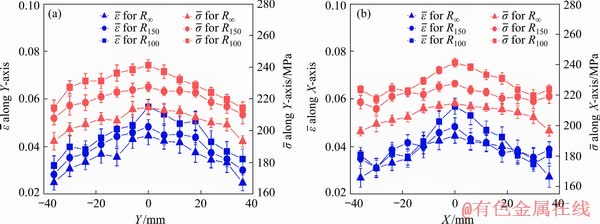
Fig. 15 Effective strain and stress distributions along Y-axis (a) and X-axis (b) at (24.13��1.03)��105 Pa
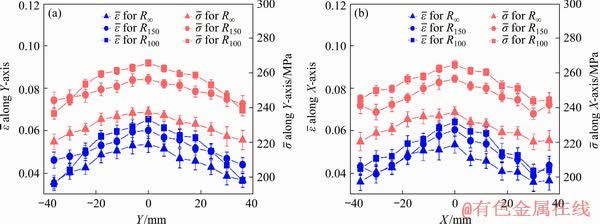
Fig. 16 Effective strain and stress distributions along Y-axis (a) and X-axis (b) at (31.02��0.68)��105 Pa
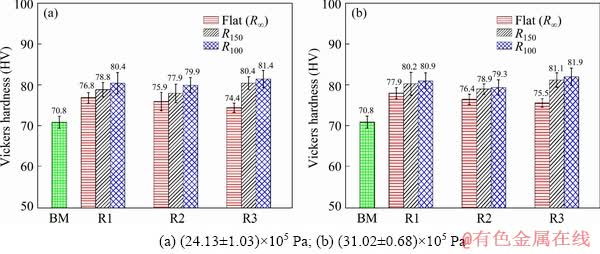
Fig. 17 Variation of hardness at different regions at two different pressures (BM-Base material; R1-Region 1; R2-Region 2; R3-Region 3)
The variation of hardness for all the deformed sheets under two different pressure conditions are depicted in Fig. 17. The hardness of the deformed sample increases as compared to that of the parent sheet. This agrees well with the work of WANG et al [9]. This is mainly attributed to the strain hardening of the sheet. HUSKIN et al [36] quoted dislocation wall strengthening as the dominant mechanism in 5XXX alloys. The (31.02��0.68)�� 105 Pa bar of bursting pressure generates larger hardness at different regions as compared to (24.13��0.1.03)��105 Pa, but the difference is not much significant. The hardness distribution from region R1 to R3 is also uniform and the variation is insignificant. The hardness distribution is insensitive to the locations, R1 to R3, unlike strain and stress distribution. The effect of radius of curvature (pre-strain) on the hardness variation is also insignificant, though R100 shows slightly larger hardness in all the regions as compared to R150 and flat sheet (R��) (Fig. 17). Due to the combined effect of indentation and flexural deformation during forming, the plastic deformation is higher in case of R100 sample as compared to the other two cases. This is responsible for higher hardness as well.
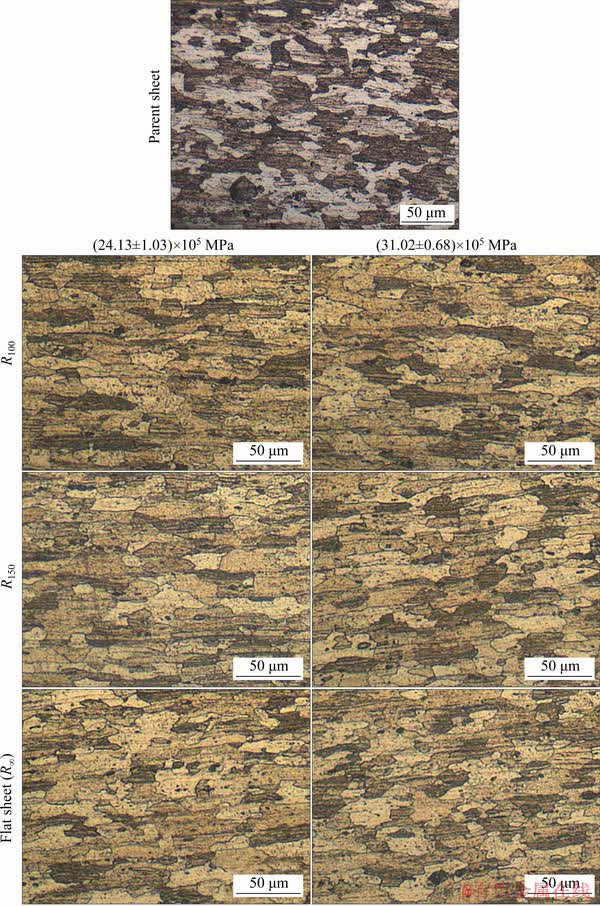
Fig. 18 Grain distributions of pre-strained sheets after deformation
The grain structure after deformation of all the pre-strained sheets is depicted in Fig. 18. It is observed that due to shock loading, the equiaxed grains of the base sheets are stretched and form an elongated grain structure. Similar type of observations were made by LIU et al [20] where the grains were stretched and a number of new grains were generated due to high velocity plastic deformation in EMF process. Since the shock based deformation is conducted at room temperature, instead of grain refinement that is generally seen at elevated temperature, the grains are stretched and elongated. The grain size of the sheets has increased in all the deformed sheets as compared to the base sheet, as illustrated in Fig. 19. However, the variation of grain size at different locations of the sheet, R1 to R3, and with respect to the different bursting pressures is not much significant. The grain size of R100 sheet is larger than that of R150 and flat sheet. It is mainly because of the combined effect of both indentation and flexural mode of deflection generated in the pre-strained sheet. Moreover, the indentation mode of deformation is prominent in R100 sheet which increases the grain size.
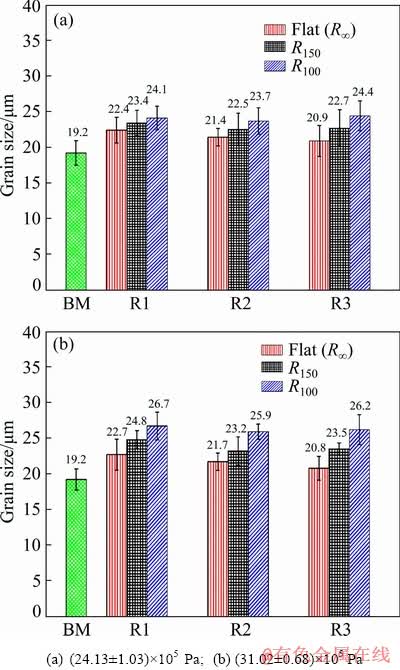
Fig. 19 Variations of grain size of all sheets at two different pressures (BM-Base material; R1-Region 1; R2-Region 2; R3-Region 3)
4 Conclusions
(1) The final out-of-plane deformation of R100 sheet is the maximum among three radii of curvature sheets irrespective of the rise in pressure. This is caused by the indentation mode of deformation which superposes for a longer duration before it changes into flexural deformation. The flat sheet has undergone less deformation.
(2) With respect to the increase in pressure, the mid-point deformation is increased monotonically by 30%-35% without strain localization. The effective stress and strain distribution also follow a similar behavior after deformation. This significant increase in deformation is influenced by the inertial effect developed due to the shock wave inducing impulsive loading.
(3) A sharp rise in strain evolution during deformation accentuates the uniform stretching of the material at a higher rate of strain. With respect to the rise in pressure, the peak strain generated near the mid location of the sheets also increases significantly in order to accommodate the inertial stabilization.
(4) ��y, ��u and K of the material increase significantly after deformation as compared to those of the parent material in all the pre-strained sheets. The variation of n of the sheet is not significant though slight variation is observed in the case of R100 sheet.
(5) The hardness of the deformed region of the material increases as compared to that of the parent sheet due to strain hardening. The variation of hardness is insensitive to various locations of the sheets. Similar variation has been observed in the grain size as well. The equiaxed grains of the parent sheets are stretched and elongated due to shock loading and this results in larger grain size.
Acknowledgments
The authors are highly grateful to ����Aeronautical Research and Development Board (AR & DB) India�� for the financial support towards the fabrication of the shock tube experimental facility at IIT Guwahati.
References
[1] JOOST W J. Reducing vehicle weight and improving US energy efficiency using integrated computational materials engineering [J]. JOM, 2012, 64: 1032-1038.
[2] FRIDLYANDER I N, SISTER V G, GRUSHKO O E, BERSTENEV V V, SHEVELEVA L M, IVANOVA L A. Aluminum alloys: Promising materials in the automotive industry [J]. Metal Science and Heat Treatment, 2002, 44: 365-370.
[3] SMERD R, WINKLER S, SALISBURY C, WORSWICK M, LLOYD D, FINN M. High strain rate tensile testing of automotive aluminum alloy sheet [J]. International Journal of Impact Engineering, 2006, 32: 541-560.
[4] LIU Da-hai, YU Hai-ping, LI Chun-feng. Quasi-static- dynamic formability of AA5052-O sheet under uniaxial and plane-strain tension [J]. Transactions of Nonferrous Metals Society of China, 2009, 19: 318-325.
[5] WANG Li-fei, HUANG Guang-sheng, LI Hong-cheng, ZHANG Hua. Influence of strain rate on microstructure and formability of AZ31B magnesium alloy sheets [J]. Transactions of Nonferrous Metals Society of China, 2013, 23: 916-922.
[6] ZHANG Xin-ming, LI Hui-jie, LI Hui-zhong, GAO Hui. Dynamic property evaluation of aluminum alloy 2519A by split Hopkinson pressure bar [J]. Transactions of Nonferrous Metals Society of China, 2008, 18: 1-5.
[7] AHMED M, KUMAR D R, NABI M. Enhancement of formability of AA5052 alloy sheets by electrohydraulic forming process [J]. Journal of Materials Engineering and Performance, 2017, 26: 439-452.
[8] GUO W G, ZHANG X Q, SU J, SU Y, ZENG Z Y, SHAO X J. The characteristics of plastic flow and a physically-based model for 3003 Al-Mn alloy upon a wide range of strain rates and temperatures [J]. European Journal of Mechanics A: Solids, 2011, 30: 54-62.
[9] WANG Du-zhen, LI Ning, HAN Xiao-tao, LIANG Li, LIU Lin. Effect of electromagnetic bulging on fatigue behavior of 5052 aluminum alloy [J]. Transactions of Nonferrous Metals Society of China, 2017, 27: 1224-1232.
[10] YANG Yang, WANG Jun-liang, CHEN Ya-dong, HU Hai-bo. Effect of strain rate on microstructural evolution and thermal stability of 1050 commercial pure aluminum [J]. Transactions of Nonferrous Metals Society of China, 2018, 28: 1-8.
[11] BROOMHEAD P, GRIEVE R J. The effect of strain rate on the strain to fracture of a sheet steel under biaxial tensile stress conditions [J]. Journal of Engineering Materials and Technology, 1982, 104: 102-106.
[12] GROLLEAU V, GARY G, MOHR D. Biaxial testing of sheet materials at high strain rates using viscoelastic bars [J]. Experimental Mechanics, 2008, 48: 293-306.
[13] GAO Tie-jun, LIU Ying, CHEN Peng, WANG Zhong-jin. Analysis of bulging process of aluminum alloy by overlapping sheet metal and its formability [J]. Transactions of Nonferrous Metals Society of China, 2015, 25: 1050-1055.
[14] LIU Jian-guang, XUE Wei. Formability of AA5052/ polyethylene/AA5052 sandwich sheets [J]. Transactions of Nonferrous Metals Society of China, 2013, 23: 964-969.
[15] OLIVEIRA D A, WORSWICK M J, FINN M, NEWMAN D. Electromagnetic forming of aluminum alloy sheet: Free-form and cavity fill experiments and model [J]. Journal of Materials Processing Technology, 2005, 170: 350-362.
[16] BALANETHIRAM V S, DAEHN G S. Enhanced formability of interstitial free iron at high strain rates [J]. Scripta Metallurgica et Materialia, 1992, 27: 1783-1788.
[17] DARIANI B M, LIAGHAT G H, GERDOOEI M. Experimental investigation of sheet metal formability under various strain rates [J]. Proceedings of the Institution of Mechanical Engineers, Part B: Journal of Engineering Manufacture, 2009, 223: 703-712.
[18] XU J R, YU H P, LI C F. An experiment on magnetic pulse uniaxial tension of AZ31 magnesium alloy sheet at room temperature [J]. Journal Material Engineering Performance, 2013, 22: 1179-1185.
[19] CHANDRA N. Constitutive behavior of superplastic materials [J]. International Journal of Non-Linear Mechanics, 2001, 37: 461-484.
[20] LIU D H, YU H P, LI C F. Comparative study of the microstructure of 5052 aluminum alloy sheets under quasi-static and high-velocity tension [J]. Materials Science and Engineering A, 2012, 551: 280-287.
[21] LATIF N A, SAJURI Z, SYARIF J, MUTOH Y. Effect of strain rate on tensile strength and work hardening for Al-Zn magnesium alloys [C]//Recent Trends in Nanotechnology and Materials Science. Springer, MOIME, 2013: 77-91.
[22] GRAY III G T, HUANG J C. Influence of repeated shock loading on the substructure evolution of 99.99 wt.% aluminum [J]. Materials Science and Engineering A, 1991, 145: 21-35.
[23] WANG E, SHUKLA A. Analytical and experimental evaluation of energies during shock wave loading [J]. International Journal of Impact Engineering, 2010, 37: 1188-1196.
[24] AUNE V, VALSAMOS G, CASADEI F, LANGSETH M, BoRVIK T. On the dynamic response of blast-loaded steel plates with and without pre-formed holes [J]. International Journal of Impact Engineering, 2017, 108: 27-46.
[25] KUMAR P, LEBLANC J, STARGEL D S, SHUKLA A. Effect of plate curvature on blast response of aluminum panels [J]. International Journal of Impact Engineering, 2012, 46: 74-85.
[26] STOFFEL M. An experimental method to validate viscoplastic constitutive equations in the dynamic response of plates [J]. Mechanics of Materials, 2005, 37: 1210-1222.
[27] JUSTUSSON B, PANKOW M, HEINRICH C, RUDOLPH M, WAAS A M. Use of a shock tube to determine the bi-axial yield of an aluminum alloy under high rates [J]. International Journal of Impact Engineering, 2013, 58: 55-65.
[28] RAY N, JAGADEESH G, SUWAS S. Response of shock wave deformation in AA5086 aluminum alloy [J]. Materials Science and Engineering A, 2014, 622: 219-227.
[29] BISHT A, RAY N, JAGADEESH G, SUWAS S. Microstructural and crystallographic response of shock- loaded pure copper [J]. Journal of Materials Research, 2017, 32: 1484-1498.
[30] LOUAR M A, BELKASSEM B, OUSJI H, SPRANGHERS K, KAKOGIANNIS D, PYL L, VANTOMME J. Explosive driven shock tube loading of aluminium plates: Experimental study [J]. International Journal of Impact Engineering, 2015, 86: 111-123.
[31] LIU D, YU H, LI C. Experimental observations of quasi- static-dynamic formability in biaxially strained AA5052-O [J]. Journal of Materials Engineering and Performance, 2011, 20: 223-230.
[32] LI C, LIU D, YU H, JI Z. Research on formability of 5052 aluminum alloy sheet in a quasi-static�Cdynamic tensile process [J]. International Journal of Machine Tools and Manufacture, 2009, 49: 117-124.
[33] NANDA S R, AGARWAL S, KULKARNI V, SAHOO N. Shock tube as an impulsive application device [J]. International Journal of Aerospace Engineering, 2017, 1: 1-12.
[34] National Instruments. Strain gauge measurement-A Tutorial [R]. Appl Note 078, 1998: 1-12.
[35] HOSFORD W F, CADDELL R M. Metal forming: Mechanics and metallurgy [M]. Cambridge: Cambridge University Press, 2011.
[36] HUSKINS E L, CAO B, RAMESH K T. Strengthening mechanisms in an Al-Mg alloy [J]. Materials Science and Engineering A, 2010, 527: 1292-1298.
S. K. BARIK, R. G. NARAYANAN, N. SAHOO
Department of Mechanical Engineering, Indian Institute of Technology Guwahati, Guwahati 781039, India
ժ Ҫ�����ü������о�����ԤӦ���ѹ����AA5052-H32��ij�����Ϊ��Ӱ�졣�������ι��θ߶ȡ���ЧӦ���Ӧ���ֲ���Ӳ�Ⱥ;����ߴ��ݱ�ȸ��ֳ��β������ڰ����ӡ��Բ��������Hill��s 1948�����������ЧӦ��ֲ���ͨ��Hollomon�ݴζ��ɼ�����ЧӦ���ֲ����ڰ�ĵ��м�λ�ð�װһӦ��Ƭ�Լ����ι�����Ӧ����ݻ���Ӧ��-ʱ��ͼ֤ʵ��ֵӦ��ļ������������ڽϸߵ�ѹ�����������ӡ����β����ı仯֤ʵ������û��Ӧ��ֲ���������±��������졣��ѧ����֯��ʾ���ᾧ�ڳ�����κ���չ����������ˣ����ϵij�����Ϊ��ȡ����ԤӦ��Ĵ�С��Ҳȡ����ѹ���ı仯��
�ؼ��ʣ�����������������ԤӦ����������
(Edited by Bing YANG)
Corresponding author: R. G. NARAYANAN; Tel: +91-361-2582669; E-mail: ganu@iitg.ac.in
DOI: 10.1016/S1003-6326(20)65239-6

