��Ȼ��п��/����п��������п�������ֲ��Ķ��ȷ��
��Դ�ڿ����й���ɫ����ѧ��(Ӣ�İ�)2020���5��
�������ߣ����� �˾�˧ ������ ������ ������
����ҳ�룺1364 - 1374
�ؼ��ʣ���п������п��Fe��Zn����������������
Key words��sphalerite; marmatite; Fe; Zn; analysis methods; imaging
ժ Ҫ�����û�ѧ�ζ�������(��ЯʽX����ӫ�����(P-XRF)������̽������ɫɢ����(EPMA-EDS)������̽�벨��ɫɢ����(EPMA-WDS)�ͷ���ʱ�������������(ToF-SIMS))�ⶨ��Ȼ��п����Ʒ��Fe��Zn�ĺ����� ���⣬����EPMA-WDS�����ToF-SIMS���������п����Ʒ��Fe��Zn�ķֲ�������������������ⶨ��Fe��Zn�����뻯ѧ�ζ����ⶨ��Fe��Zn�����������õ����Թ�ϵ(R2>0.77)������������Fe��R2ֵ����Zn��R2ֵ������������������Fe��Zn����п���зֲ������ȡ�
Abstract: The contents of Fe and Zn in natural sphalerite samples were determined by chemical titration and spectroscopic techniques (portable X-ray fluorescence (P-XRF) spectrometry, electron probe microanalysis with energy dispersive spectroscopy (EPMA-EDS), electron probe microanalysis with wavelength dispersive spectroscopy (EPMA-WDS), and time-of-flight secondary ion mass spectrometry (ToF-SIMS)). Besides, the distribution of Fe and Zn in sphalerite samples was analyzed by imaging EPMA-WDS and imaging ToF-SIMS. The results show that Fe and Zn contents determined by each spectroscopic technique have good linearity with those determined by chemical titration (R2>0.77), and the R2 values of Fe are generally greater than those of Zn. The imaging analysis results revealed that Fe and Zn are not uniformly distributed in the sphalerite.
Trans. Nonferrous Met. Soc. China 30(2020) 1364-1374
Hao LAI1, Jiu-shuai DENG2, Zi-long LIU3, Shu-ming WEN1, Ling-yun HUANG1
1. State Key Laboratory of Complex Nonferrous Metal Resources Clean Utilization, Faculty of Land Resource Engineering, Kunming University of Science and Technology, Kunming 650093, China;
2. School of Chemical & Environmental Engineering, China University of Mining and Technology (Beijing), Beijing 100083, China;
3. Tibet Huatailong Mining Development Co., Ltd., Lhasa 850200, China
Received 19 June 2019; accepted 27 March 2020
Abstract: The contents of Fe and Zn in natural sphalerite samples were determined by chemical titration and spectroscopic techniques (portable X-ray fluorescence (P-XRF) spectrometry, electron probe microanalysis with energy dispersive spectroscopy (EPMA-EDS), electron probe microanalysis with wavelength dispersive spectroscopy (EPMA-WDS), and time-of-flight secondary ion mass spectrometry (ToF-SIMS)). Besides, the distribution of Fe and Zn in sphalerite samples was analyzed by imaging EPMA-WDS and imaging ToF-SIMS. The results show that Fe and Zn contents determined by each spectroscopic technique have good linearity with those determined by chemical titration (R2>0.77), and the R2 values of Fe are generally greater than those of Zn. The imaging analysis results revealed that Fe and Zn are not uniformly distributed in the sphalerite.
Key words: sphalerite; marmatite; Fe; Zn; analysis methods; imaging
1 Introduction
Zn-bearing sulfide minerals in nature include sphalerite, marmatite and wurtzite [1]. Wherein, sphalerite is the most important source of Zn as well as one of the common minerals in polymetallic ores [2,3]. Sphalerite is a cubic crystal mineral that crystallizes in the  space group with a unit cell edge (a) of (5.4093��0.0002)
  [2]. The sphalerite with Fe content of more than 6% (up to 25% or even more) is called marmatite [4,5]. Marmatite is formed when Fe atoms substitute Zn atoms of sphalerite during mineralization [6]. The crystal structure and cell parameters of marmatite remain consistent with those of sphalerite [7]. In general, the sphalerite in the high-medium temperature hydrothermal deposit has the highest Fe content, followed by the medium-temperature and low-temperature hydrothermal deposits. Natural sphalerite contains different chemical elements that substitute Zn in tetrahedral coordination, these elements include Fe, Cd, Mn, Cu, Co, Ni, Ge, and In [3], but the most common substitution is Fe, which forms extensive solid solutions of (FexZn1-x)S. Analysis of Fe and Zn contents and distribution in sphalerite can help to understand its metallogenic background [4,8,9].
Information about the Fe content presented in sphalerite is compulsory in studying its physical or chemical properties. The Fe content in sphalerite directly affects the crystal structure, and increase of the Fe content leads to increased cell parameters, reflectance, and specific susceptibility as well as the reduced microhardness [10]. Fe content in sphalerite can be considered as a controlling factor for internal reflection color. The internal reflection of sphalerite grains containing less than 10% Fe is whitish yellow, which becomes reddish brown when Fe rises to above 10% to 17% [11,12]. Like other nonferrous metallic minerals such as chalcopyrite, galena, and smithsonite, sphalerite is often recovered by flotation [13-18]. Some scholars have pointed out that a higher Fe content means a lower floatability of sphalerite [7,19,20]. Furthermore, the determination of the Fe and Zn contents in sphalerite can be used for the correct estimation of the Zn content within an ore deposit [9,19].
The composition of the elements in minerals can be determined by one of the following methods, namely, chemical titration, X-ray fluorescence (XRF), energy dispersive spectroscopy (EDS), wavelength dispersive spectroscopy (WDS), inductively coupled plasma (ICP), energy dispersed X-ray analysis (EDAX), and X-ray photoelectron spectroscopy (XPS), etc. In the past, the contents of Fe and Zn in sphalerite were usually determined by Raman spectroscopy, X-ray diffraction (XRD), and scanning electron microscopy with energy dispersive spectroscopy (SEM-EDS) [6,9,21-23]. Most previous studies only used 2-3 methods to determine the content of Fe or Zn in natural sphalerite, and rarely compared the difference between the results of different methods. Besides, no research was found on the spatial distribution state of Fe and Zn in sphalerite. Although time-of- flight secondary ion mass spectrometry (ToF-SIMS) has been used for sphalerite analysis for several decades [24-26], no research has evaluated the accuracy of test data of Fe and Zn contents in sphalerite using ToF-SIMS.
The different test methods have their advantages and limitations. For example, it is not easy to apply ToF-SIMS for semi-quantitative or quantitative analysis due to the matrix effects [27]. Therefore, the present work aimed to compare and evaluate the chemical titration, portable X-ray fluorescence (P-XRF) spectrometry, electron probe microanalysis with energy dispersive spectroscopy (EPMA-EDS), electron probe microanalysis with wavelength dispersive spectroscopy (EPMA�CWDS), and ToF-SIMS for the semi-quantitative or quantitative element analysis of Fe and Zn in natural sphalerite. The distribution characteristics of Fe and Zn in sphalerite samples from five different deposits were also analyzed by imaging EPMA- WDS and imaging ToF-SIMS. It is worth mentioning that this work is the first to evaluate the feasibility of ToF-SIMS for the determination of Fe and Zn contents in sphalerite. This study can provide a reference for the determination of Fe and Zn contents in sphalerite, and help to understand the mineral properties of natural sphalerite.
2 Experimental
2.1 Materials
In this study, sphalerite samples with different Fe contents were collected from different deposits. The information of these samples is shown in Table 1. To ensure pure minerals were used in this study, sphalerite crystals were manually selected from the raw samples to remove the associated galena, quartz, calcite, and other gangues. Figure 1 shows the X-ray diffractometry (XRD) (X'Pert3 Powder, PANalytical BV, Netherlands) patterns of the purified sphalerite samples. In this XRD pattern, the three strongest peaks appearing at 2�� about 28.7��, 48.1�� and 56.2��, which are (111), (220) and (311) planes of sphalerite phase, respectively [28], indicating that the main mineral phase in the samples is sphalerite.
Table 1 Information of various sphalerite samples
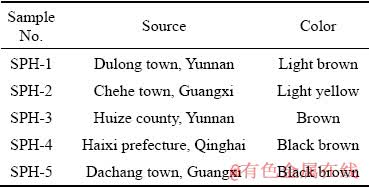
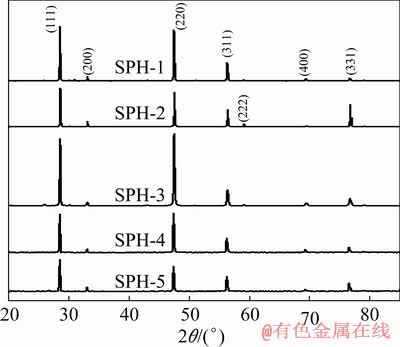
Fig. 1 XRD patterns of sphalerite samples
2.2 Chemical titration
Five purified sphalerite samples were separately ground using a three-head grinder with an agate mortar and pestle (XPM-��120 mm��3 mm, China) and dry screened (0.038 mm to -0.075 mm size fraction) respectively. Then the contents of Fe and Zn in samples were determined by chemical titration, and each element was analyzed three times. Specifically, the method for the determination of Zn content is as follows: the sample was dissolved with nitric acid and potassium chlorate, and then ammonium sulfate, potassium fluoride, ethanol, and ammonia were used to precipitate and separate elements such as Fe, Al, and Pb. Finally, in an acetate-sodium acetate buffer solution at pH 5-6, sodium thiosulfate, potassium thiocyanate, and sodium sulfite were added as masking agents, xylenol orange was added as an indicator, and the content of Zn was titrated with an EDTA solution. The method for the determination of Fe content is as follows: the sample was dissolved with sulfuric acid and phosphoric acid, and then sodium tungstate was used as an indicator, titanium trichloride was added to reduce Fe(III) to Fe(II), after that, copper sulfate was added to eliminate the interference of Ti(III). Finally, sodium diphenylamine sulfonate was used as an indicator, and the content of Fe was titrated with potassium dichromate solution. The error ranges of Fe and Zn content determination are (0.02-0.2) wt.% and (0.5-0.7) wt.%, respectively.
2.3 P-XRF
A P-XRF (Innov-x, Alpha-6000, Olympus, USA) was used to obtain the contents of Fe and Zn in sphalerite samples (0.038 mm to -0.075 mm size fraction). The P-XRF contains a 40 kV X-ray tube and is quantified by a silicon drift detector (resolution <280 eV) that allows for the detection of elements ranging from P to U in parts per million (10-6). Tests were performed in triplicate in analytical mode, and one complete scan of a given sample is completed in 180 s. Before performing tests, the P-XRF was calibrated with a standard 316 metal alloy target placed in front of the aperture. In this work, the error ranges of P-XRF for determining Fe and Zn were (0.0076-0.0405) wt.% and (0.0705-0.0735) wt.%, respectively.
2.4 EPMA
EPMA analyses were conducted using a JXA-8230 (JEOL, Japan) instrument. The samples were cut into rectangular shaped pieces approximately 1 cm �� 1 cm �� 0.5 cm in length, width and depth, using a fine slow diamond saw. The cut samples were polished with wet silicon carbide paper in a sequence of 600, 1000, 2000 and 4000 meshes. The polished samples were further polished with 2 ��m alumina powder suspensions. The freshly polished samples were ultrasonically cleaned for 5 min each in Milli-Q water, absolute ethanol, and Milli-Q water, and finally, the cleaned samples were dried by high-purity nitrogen. The Zn and Fe contents of the five freshly prepared samples were determined by EPMA equipped with WDS or EDS. For the EDS test, three points were tested for each sample.
2.5 ToF-SIMS
ToF-SIMS is a highly surface sensitive (sampling depth 1-1.5 nm [29]) analytical technique for probe of elements and the acquisition of molecular information from the surface of a material with high spatial and mass resolution. Its working principle is that a finely focused, pulsed primary ion beam is rastered across the surface of the sample and the secondary ions emitted at each pixel are extracted into a time-of-flight mass spectrometer, mass filtered and counted [30]. In this study, ToF-SIMS analyses were conducted using a ToF-SIMS V (ION-TOF GmbH, M��nster, Germany) instrument. The samples preparation procedure is the same as EPMA. A pulsed 30 kV Bi3+ primary ion beam was used in the spectrometry mode for data acquisition. Spectra and ion images were acquired in positive ion mode from three separate 500 ��m �� 500 ��m areas on each sample surface using a pixel density of 256��256. Each spectrum was acquired from 0 to 816 m/z with 4 min of data collection time. Before statistical analysis, the peak intensities of Fe+ and Zn+ were normalized by total ion counts.
3 Results and discussion
3.1 Fe and Zn contents by chemical titration
Figure 2 shows the results of Fe and Zn contents in the five samples determined by chemical titration. The Fe content in the five samples gradually increases with the decrease of Zn content. Fe and Zn contents obtained by chemical titration, which have a small standard deviation, are used as standard values to compare the quantitative analysis of P-XRF, EPMA-EDS, EPMA-WDS, and ToF-SIMS.
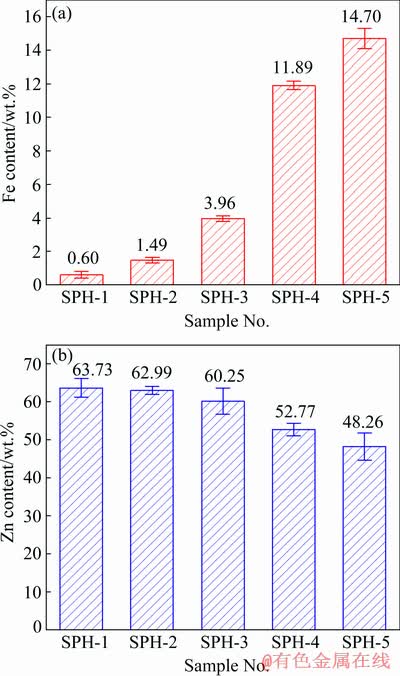
Fig. 2 Results of Fe (a) and Zn (b) contents obtained by chemical titration
3.2 Fe and Zn contents by P-XRF
Figure 3 shows the linear correlation analysis between the Fe and Zn contents determined by P-XRF and those determined by chemical titration. The results showed that the quantitative analysis of Fe by P-XRF was well consistent with the results of the chemical titration. For the sphalerites with low Fe content, the measurement standard deviation of Fe content is less than that of the sphalerites with high Fe content. Compared with Zn, the quantitative results of Fe are more consistent with the results of the chemical titration.

Fig. 3 Correlation analysis of Fe (a) and Zn (b) contents determined by P-XRF
3.3 Fe and Zn contents by EPMA-EDS
Three points were selected in the different areas of each polished sphalerite for EPMA-EDS analysis. Figure 4 shows the energy spectra and Fig. 5 shows the linear correlation analysis between the quantitative results obtained by EPMA-EDS and the results of the chemical titration. All of the five samples have strong Zn peaks (see Fig. 4). The measured results of Fe and Zn contents are both in good agreement with the results of chemical titration (see Fig. 5). The test standard deviations of Fe and Zn contents of SPH-3 are greater than those of other samples.
3.4 EPMA-WDS imaging analysis
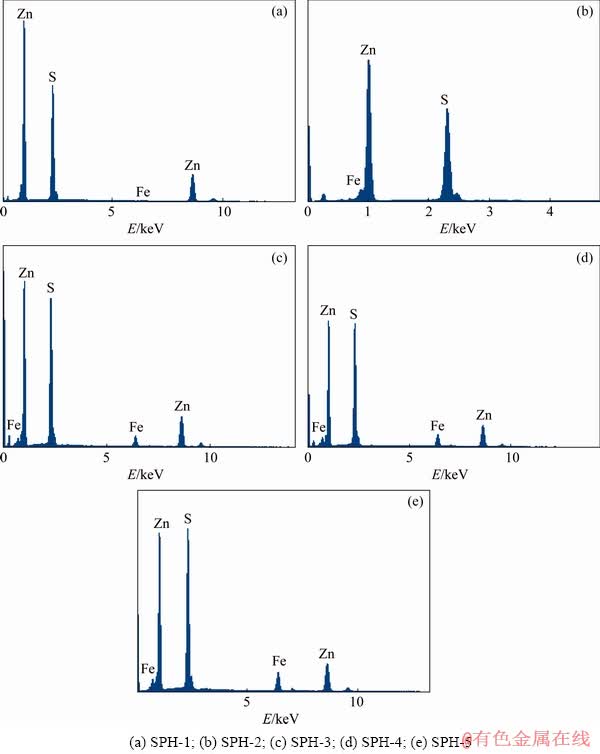
Fig. 4 EMPA-EDS spectra of samples

Fig. 5 Correlation analysis of Fe (a) and Zn (b) contents determined by EPMA-EDS
Fe and Zn on the sphalerite polished surface were imaged by EPMA-WDS. The distribution characteristics of Fe and Zn are shown in Fig. 6. The results show that the distribution diagrams of Fe and Zn of the five samples all change from blue to red. The variation ranges of Fe and Zn contents on the sphalerite surfaces are shown in Table 2. From Fig. 6 and Table 2, it is obvious that the distribution of Fe and Zn on the surfaces of the five samples are not uniform. For SPH-1, SPH-2, SPH-4, and SPH-5, the regions with high/low content of Fe and Zn are scattered, with no apparent concentration area of Fe or Zn element. SPH-3 shows the concentrated areas of low content of Fe (blue region) or Zn (yellow region), as well as the concentrated area of high content of Fe (cyan region) or Zn (red region). Moreover, the regions with high Fe content have low Zn content. This explains the large difference measurement for Fe and Zn in different surface regions of SPH-3, and it may be unrelated to operation and instruments (see Fig. 5).
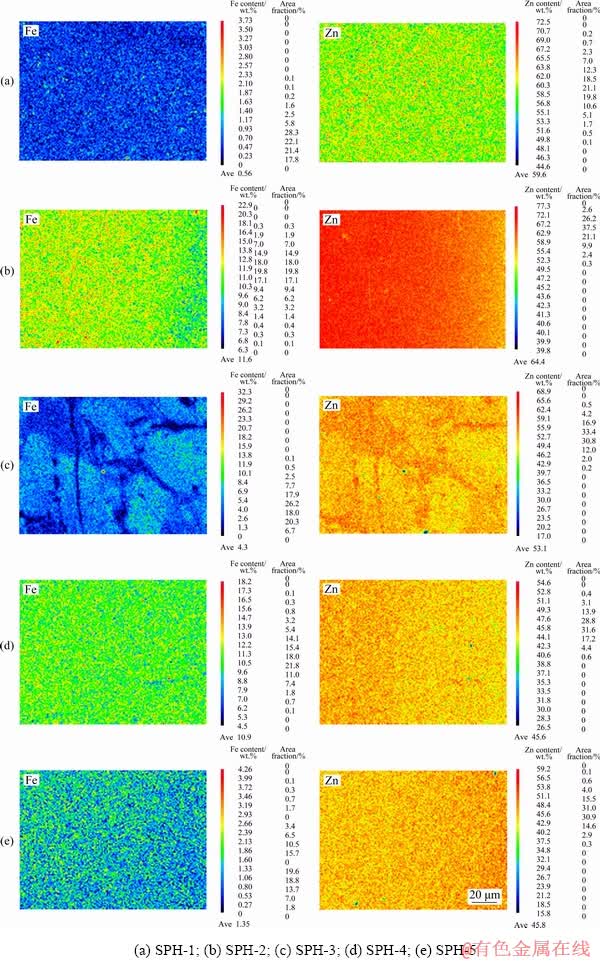
Fig. 6 EPMA-WDS distribution of Fe and Zn
Table 2 Variation range of Zn and Fe contents
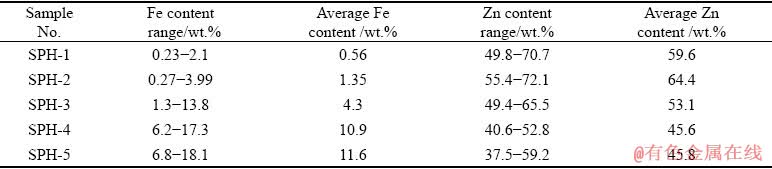
Figure 7 indicates that the Fe contents of the samples determined by EPMA-WDS are well consistent with the results of chemical titration, while the linear correlation between the Zn contents determined by EPMA-WDS and those determined by chemical titration is weaker than the results of Fe.
3.5 ToF-SIMS analysis
Figure 8 shows the ToF-SIMS positive ion mass spectra of the samples. As can be seen from Fig. 8, Fe+ and Zn+ were detected in all five samples. Except in the SPH-3 sample, with increased Fe content, the intensity of Fe+ peak increases, while that of Zn+ peak decreases.
Figure 9 shows the ToF-SIMS images of Fe+ and Zn+ of the samples. In this figure, the bright regions indicate high Fe or Zn content, contrary to the dark regions. Similar to the EPMA-WDS imaging results (Fig. 6), the ToF-SIMS ion images of Fe+ and Zn+ also indicate that Fe and Zn are not uniformly distributed in the sphalerite.
Figure 10 shows the linear relationship between the normalized intensities of the Fe+ and Zn+ peaks of ToF-SIMS and the Fe and Zn contents determined by chemical titration. The normalized intensity of Fe has a strong linear correlation with the chemical titration results, while the linear correlation of Zn is not as strong as that of Fe. The normalized intensities of Zn acquired on three different surface regions of SPH-3 are quite different, indicating that the distribution of Fe and Zn on the surface of SPH-3 is quite uneven, which is consistent with the analysis results of EPMA-EDS.

Fig. 7 Correlation analysis of Fe (a) and Zn (b) contents determined by EPMA-WDS
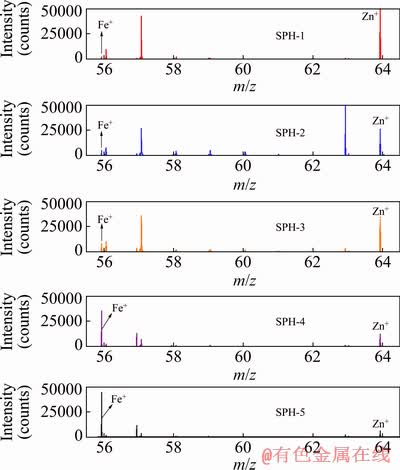
Fig. 8 ToF-SIMS positive ion mass spectra of samples
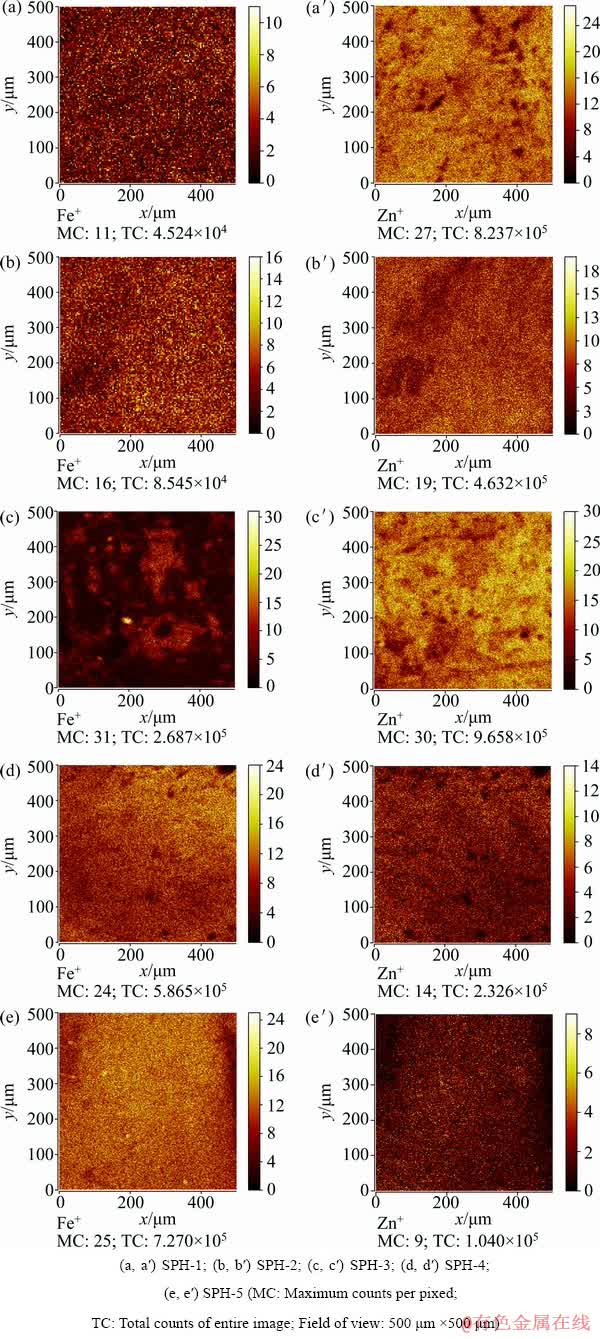
Fig. 9 ToF-SIMS ion images of Fe+ and Zn+ of samples

Fig. 10 Correlation analysis of Fe (a) and Zn (b) contents determined by ToF-SIMS
Table 3 shows the linear fitting parameters of the test data of Figs. 2, 4, 6, and 9. The contents of Fe and Zn in sphalerite determined by P-XRF, EPMA-EDS, EPMA-WDS, and ToF-SIMS are all in good agreement with the results of the chemical titration. Specifically, the coefficients of determination (R2) of Fe are 0.9706-0.9930 and those of Zn are 0.7712-0.9709, which indicates that the determination result of Fe content is better than that of Zn.
Table 3 Linear fitting parameters (Y=aX+b)

4 Discussion
The above results show that P-XRF, EPMA-EDS, EPMA-WDS, and ToF-SIMS can be used for quantitative or semi-quantitative analysis of Fe and Zn contents in sphalerite. It should be noted that the various analytical methods have their advantages and limits. P-XRF analysis is time-saving and almost does not require sample preparation, and it can directly obtain the content information of elements in a sample, but the disadvantage is that it does not have the ability of imaging. EPMA-EDS, EPMA-WDS and ToF-SIMS are vacuum technology and have imaging analysis functions. Since the uneven distribution of Fe and Zn in sphalerite, it may be better to get average contents of Fe and Zn by testing multiple points when these techniques are applied to micro-analysis of bulk sphalerite. Owing to the matrix effect, ToF-SIMS is not usually a quantitative analysis technique and cannot directly obtain the content of element in samples. The results of ToF-SIMS test show that the correlation between the Fe+ and Zn+ intensities and Fe and Zn contents is good. Therefore, ToF-SIMS can be used as a semi-quantitative technique for the determination of Fe and Zn contents in sphalerite by establishing the calibration curve.
For the determination of Fe content in sphalerite, P-XRF, EPMA-EDS, EPMA-WDS and ToF-SIMS are all suitable semi-quantitative analysis techniques. Therefore, from the perspective of inexpensive, non-destructive, easy-touse and time saving, P-XRF is the most suitable technique for the determination of Fe content in sphalerite. For the determination of Zn content in sphalerite, from the perspective of accuracy, the technology with high accuracy to low accuracy is EPMA-EDS, P-XRF, EPMA-WDS and ToF-SIMS in turn. When sphalerite needs 2D imaging analysis of Fe and Zn, EPMA-WDS is a more suitable semi-quantitative analysis technology than ToF-SIMS, because ToF-SIMS can only perform qualitative imaging analysis. ToF-SIMS is the most suitable technique for obtaining the distribution information of Fe and Zn in the outermost layer of sphalerite because its sampling depth is 1-1.5 nm, which is far less than EPMA-EDS/EPMA-WDS with a sampling depth of about 1 ��m.
5 Conclusions
(1) The contents of Fe and Zn in sphalerite determined by P-XRF, EPMA-EDS, EPMA-WDS and ToF-SIMS are all good linearly correlated with those determined by chemical titration, and the determination accuracy of Fe is better than that of Zn. Specifically, the coefficients of determination between the Fe content determined by P-XRF, EPMA-EDS, EPMA-WDS and ToF-SIMS and the Fe content determined by chemical titration are all greater than 0.97, while the coefficients of determination between the Zn content determined by these techniques and that determined by chemical titration are quite different, which are 0.8389, 0.9709, 0.8012 and 0.7712, respectively.
(2) The intensities of the Fe+ and Zn+ peaks of ToF-SIMS spectra from sphalerite are directly proportional to the contents of Fe and Zn in the sphalerite. Therefore, ToF-SIMS can be used as a semi-quantitative technique for the determination of Fe and Zn contents in sphalerite by establishing the calibration curve.
(3) Imaging EPMA-WDS and imaging ToF-SIMS analyses indicate that Fe and Zn are not uniformly distributed in natural sphalerite samples. Therefore, when applying point analysis techniques to determine the Fe and Zn contents in natural sphalerite, it is necessary to test multiple points.
References
[1] DENG Jiu-shuai, MAO Ying-bo, WEN Shu-ming, LIU Jian, XIAN Yong-jun, FENG Qi-cheng. New influence factor inducing difficulty in selective flotation separation of Cu-Zn mixed sulfide minerals [J]. International Journal of Minerals, Metallurgy, and Materials, 2015, 22(2): 111-115.
[2] WEN Shu-ming, LIU Jian, LI Bo, HAN Run-sheng, ZHANG Yi, DENG Jiu-shuai. Zn release from fluid inclusions in a natural sphalerite [J]. International Journal of Minerals, Metallurgy, and Materials, 2013, 20(5): 420-426.
[3] CHOI N, CHO K H, KIM B J, LEE S, PARK C Y. Enhancement of Au-Ag-Te contents in tellurium-bearing ore minerals via bioleaching [J]. International Journal of Minerals, Metallurgy, and Materials, 2018, 25(3): 262-270.
[4] BARTON P B, TOULMIN P. Phase relations involving sphalerite in the Fe-Zn-S system [J]. Economic Geology, 1966, 61(5): 815-849.
[5] TONG Xiong, SONG Shao-xian, HE Jian, RAO Feng, LOPEZ-VALDIVIESO A. Activation of high-iron marmatite in froth flotation by ammoniacal copper (II) solution [J]. Minerals Engineering, 2007, 20(3): 259-263.
[6] KHARBISH S. A Raman spectroscopic investigation of Fe-rich sphalerite: Effect of fe-substitution [J]. Physics and Chemistry of Minerals, 2007, 34(8): 551-558.
[7] DENG Jiu-shuai, LAI Hao, CHEN Miao, GLEN M, WEN Shu-ming, ZHAO Biao, LIU Zi-long, YANG Hua, LIU Ming-shi, HUANG Ling-yun. Effect of iron concentration on the crystallization and electronic structure of sphalerite/ marmatite: A DFT study [J]. Minerals Engineering, 2019, 136: 168-174.
[8] MCCLUNG C R, VILJOEN F. A detailed mineralogical assessment of sphalerites from the Gamsberg zinc deposit, South Africa: The manganese conundrum [J]. Minerals Engineering, 2011, 24(8): 930-938.
[9] BUZATU A, BUZGAR N, DAMIAN G, VASILACHE V, APOPEI A I. The determination of the Fe content in natural sphalerites by means of Raman spectroscopy [J]. Vibrational Spectroscopy, 2013, 68: 220-224.
[10] VAUGHAN D J, TOSSELL J A. The chemical bond and the properties of sulfide minerals: I, Zn, Fe and Cu in tetrahedral and triangular coordinations with sulfur [J]. The Canadian Mineralogist, 1980, 18(2): 157-163.
[11] SCHAEFER S C, GOKCEN N A. Electrochemical determination of the thermodynamic properties of sphalerite, ZnS (beta) [J]. High Temperature Science, 1982, 15(2-3): 225-237.
[12] AWADH S M. Iron content variations in sphalerite and their effects on reflectance and internal reflections under reflected light [J]. Arabian Journal of Geosciences, 2009, 2(2): 139.
[13] URBANO G, LAZARO I, RODRIGUEZ I, REYES J L, LARIOS R, CRUZ R. Electrochemical and spectroscopic study of interfacial interactions between chalcopyrite and typical flotation process reagents [J]. International Journal of Minerals, Metallurgy, and Materials, 2016, 23(2): 127-136.
[14] LAI Hao, DENG Jiu-shuai, FAN Gui-xia, XU Hong-xiang, CHEN Wen-xiang, LI Shi-mei, HUANG Ling-yun. Mechanism study of xanthate adsorption on sphalerite/ marmatite surfaces by ToF-SIMS analysis and flotation [J]. Minerals, 2019, 9(4): 205.
[15] LAI Hao, DENG Jiu-shuai, WEN Shu-ming. Application of ToF-SIMS and PCA to study interaction mechanism of dodecylamine and smithsonite [J]. Applied Surface Science, 2019, 496: 143698.
[16] FENG Bo, ZHONG Chun-hui, ZHANG Liang-zhu, GUO Yu-tao, WANG Tao, HUANG Zhi-qiang. Effect of surface oxidation on the depression of sphalerite by locust bean gum [J]. Minerals Engineering, 2020, 146: 106142.
[17] ZHU Hai-ling, QIN Wen-qing, CHEN Chen, CHAI Li-yuan, LI Lai-shun, LIU San-jun, ZHANG Ting. Selective flotation of smithsonite, quartz and calcite using alkyl diamine ether as collector [J]. Transactions of Nonferrous Metals Society of China, 2018, 28(1): 163-168.
[18] WANG Li, HU Guang-yan, SUN Wei, KHOSO S A, LIU Run-qing, ZHANG Xiang-feng. Selective flotation of smithsonite from dolomite by using novel mixed collector system [J]. Transactions of Nonferrous Metals Society of China, 2019, 29(5): 1082-1089.
[19] BOULTON A, FORNASIERO D, RALSTON J. Effect of iron content in sphalerite on flotation [J]. Minerals Engineering, 2005, 18(11): 1120-1122.
[20] CHEN Jian-hua, CHEN Ye, ZENG Xiao-qin, LI Yu-qiong. First principle study of effect of Fe impurity on electronic structure and activation of sphalerite surface [J]. The Chinese Journal of Nonferrous Metals, 2009, 19(8): 1517-1523. (in Chinese)
[21] HARMER S L, MIERCZYNSKA-VASILEV A, BEATTIE D A, SHAPTER J G. The effect of bulk iron concentration and heterogeneities on the copper activation of sphalerite [J]. Minerals Engineering, 2008, 21(12-14): 1005-1012.
[22] AXELSSON M D, RODUSHKIN I. Determination of major and trace elements in sphalerite using laser ablation double focusing sector field ICP-MS [J]. Journal of Geochemical Exploration, 2001, 72(2): 81-89.
[23] DEULKAR S H, BHOSALE C H, SHARON M. Effect of Fe substitution on optical, electrical, electrochemical and dielectric properties of (Zn, Fe) S chalcogenide pellets [J]. Materials Chemistry and Physics, 2005, 89(2-3): 211-215.
[24] SMART R S C, GERSON A R, BIESINGER M C, HART B R. The development of statistical ToF-SIMS applied to minerals recovery by froth flotation [J]. Surface and Interface Analysis, 2017, 49(13): 1387-1396.
[25] LAI Hao, DENG Jiu-shuai, WEN Shu-ming, LIU Quan-jun. Elucidation of lead ions adsorption mechanism on marmatite surface by PCA-assisted ToF-SIMS, XPS and zeta potential [J]. Minerals Engineering, 2019, 144: 106035.
[26] LAI Hao, DENG Jiu-shuai, WEN Shu-ming, WU Dan-dan. Homogenization phenomena of surface components of chalcopyrite and sphalerite during grinding processing [J]. Colloids and Surfaces A: Physicochemical and Engineering Aspects, 2019, 578: 123601.
[27] INOUE M, MURASE A. Reduction of matrix effects in TOF-SIMS analysis by metal-assisted SIMS (MetA-SIMS) [J]. Surface and Interface Analysis, 2005, 37(12): 1111-1114.
[28] HITKARI G, SINGH S, PANDEY G. Photoluminescence behavior and visible light photocatalytic activity of ZnO, ZnO/ZnS and ZnO/ZnS/��-Fe2O3 nanocomposites [J]. Transactions of Nonferrous Metals Society of China, 2018, 28(7): 1386-1396.
[29] WAGNER M S, MCARTHUR S L, SHEN Ming-chao, HORBETT T A, CASTNER D G. Limits of detection for time of flight secondary ion mass spectrometry (ToF-SIMS) and X-ray photoelectron spectroscopy (XPS): detection of low amounts of adsorbed protein [J]. Journal of Biomaterials Science (Polymer Edition), 2002, 13(4): 407-428.
[30] LONG Tao, CLEMENT S W J, XIE Hang-qiang, LIU Dun-yi. Design, construction and performance of a TOF-SIMS for analysis of trace elements in geological materials [J]. International Journal of Mass Spectrometry, 2020, 450: 116289.
�� ��1���˾�˧2��������3��������1��������1
1. ����������ѧ ������Դ����ѧԺ ������ɫ������Դ������ù����ص�ʵ���ң����� 650093��
2. �й���ҵ��ѧ(����) ��ѧ�뻷������ѧԺ������ 100083��
3. ���ػ�̩����ҵ��������˾������ 850200
ժ Ҫ�����û�ѧ�ζ�������(��ЯʽX����ӫ�����(P-XRF)������̽������ɫɢ����(EPMA-EDS)������̽�벨��ɫɢ����(EPMA-WDS)�ͷ���ʱ�������������(ToF-SIMS))�ⶨ��Ȼ��п����Ʒ��Fe��Zn�ĺ����� ���⣬����EPMA-WDS�����ToF-SIMS���������п����Ʒ��Fe��Zn�ķֲ�������������������ⶨ��Fe��Zn�����뻯ѧ�ζ����ⶨ��Fe��Zn�����������õ����Թ�ϵ(R2>0.77)������������Fe��R2ֵ����Zn��R2ֵ������������������Fe��Zn����п���зֲ������ȡ�
�ؼ��ʣ���п������п��Fe��Zn����������������
(Edited by Xiang-qun LI)
Foundation item: Projects (51764022, 51404119) supported by the National Natural Science Foundation of China; Project (161046) supported by Fok Ying Tong Education Foundation, China; Project (2018M632810) supported by China Postdoctoral Science Foundation
Corresponding author: Jiu-shuai DENG; Tel: +86-13629699258; E-mail: dengshuai689@163.com
DOI: 10.1016/S1003-6326(20)65302-X

