基于核磁共振和分形理论的充填体跨尺度特征
来源期刊:中国有色金属学报(英文版)2020年第5期
论文作者:胡建华 任启帆 杨东杰 马少维 尚俊龙 丁啸天 罗周全
文章页码:1347 - 1363
关键词:充填体;跨尺度特征;分级指数;分形维数;核磁共振
Key words:backfill material; cross-scale characteristics; grading index; fractal dimension; nuclear magnetic resonance
摘 要:分析石粉水泥尾矿充填体的孔隙结构,量化孔隙的分形维数,计算混合骨料的分级指数(GI),并研究分级指数、孔隙结构与强度之间的关系,以描述其跨尺度特征。同时,对石粉水泥尾矿充填体进行一系列室内实验。基于Füller理论推导混合骨料(石粉和水泥尾矿)的GI公式。通过分形几何原理推导充填体的核磁共振(NMR)分形维数。与中孔和大孔分形维数相比,微孔分形维数与NMR孔隙率、孔结构复杂性、单轴抗压强度(UCS)和GI等宏观特性之间的相关性最为显著。大孔分形维数通常与UCS和GI相关,而其他属性(如混合骨料的形状)也影响分形维数。但中孔分形维数与宏观特性无明显关系。最后,研究GI和UCS之间的关系,这有助于改善充填体的强度和优化级配效果。
Abstract: This paper analyzed the pore structure, quantified the pore fractal dimension, calculated the grading index (GI) of mixed aggregate, and studied the relationship among GI, pore structure, and strength to describe the cross-scale characteristics of backfill, which is made from stone powder and cemented tailing. A series of experiments were conducted on stone powder cement tailings backfill (SPCTB). The GI formulas for mixed aggregates, containing stone powder and tailings, were derived based on the Füller theory. The nuclear magnetic resonance (NMR) fractal dimensions of backfills were derived using fractal geometry principles. Compared to the mesopore and macropore fractal dimensions, the correlation between micropore fractal dimension and macro-properties in terms of NMR porosity, pore structure complexity, uniaxial compression strength (UCS), and GI is the most significant. Macropore fractal dimension is generally correlated with UCS and GI and the other properties such as the shape of mixed aggregates also have an impact on fractal dimension. However, mesopore fractal dimension has no obvious relationship with macro-properties. Finally, the relationship between GI and UCS was studied, which contributed to improving backfill’s strength and optimizing gradation.
Trans. Nonferrous Met. Soc. China 30(2020) 1347-1363
Jian-hua HU1, Qi-fan REN1, Dong-jie YANG1, Shao-wei MA1, Jun-long SHANG2, Xiao-tian DING1, Zhou-quan LUO1
1. School of Resources and Safety Engineering, Central South University, Changsha 410083, China;
2. School of Civil and Environmental Engineering, Nanyang Technological University, 50 Nanyang Avenue, Singapore
Received 16 August 2019; accepted 17 February 2020
Abstract: This paper analyzed the pore structure, quantified the pore fractal dimension, calculated the grading index (GI) of mixed aggregate, and studied the relationship among GI, pore structure, and strength to describe the cross-scale characteristics of backfill, which is made from stone powder and cemented tailing. A series of experiments were conducted on stone powder cement tailings backfill (SPCTB). The GI formulas for mixed aggregates, containing stone powder and tailings, were derived based on the Füller theory. The nuclear magnetic resonance (NMR) fractal dimensions of backfills were derived using fractal geometry principles. Compared to the mesopore and macropore fractal dimensions, the correlation between micropore fractal dimension and macro-properties in terms of NMR porosity, pore structure complexity, uniaxial compression strength (UCS), and GI is the most significant. Macropore fractal dimension is generally correlated with UCS and GI and the other properties such as the shape of mixed aggregates also have an impact on fractal dimension. However, mesopore fractal dimension has no obvious relationship with macro-properties. Finally, the relationship between GI and UCS was studied, which contributed to improving backfill’s strength and optimizing gradation.
Key words: backfill material; cross-scale characteristics; grading index; fractal dimension; nuclear magnetic resonance
1 Introduction
As an additive to cement paste, stone powder can participate in hydration reactions, accelerate cement hydration, and induce the crystallization of cement hydrate products [1,2]. In many mines of China, cut and fill mining has become a mandatory mining method. As the filling material, backfill plays the role of supporting underground goaf and maintaining the stability of underground stope. Traditionally, backfill is made up of tailings, cement and water. However, the high cost of cement is a dilemma. The use of stone powder as a partial replacement for Portland cement and tailings as backfill aggregate materials in many mines can be an efficient, cost effective, and environmentally friendly solution to stone powder and tailings disposal. Many studies have shown that pores, microstructure, and total porosity of porous materials are associated with capacity in terms of permeability, strength, durability, and other mechanical properties [3-5]. It is well known that concrete is a highly disordered, multi-phase and porous heterogeneous material. During the hydration reaction and hardening process, structural defects such as pores and micro-cracks will inevitably form inside the concrete, which deteriorates the strength, durability, and pore structure. Some studies [6-8] have demonstrated that optimizing the aggregate grading is a good way to improve compactness and reduce the porosity of engineered concrete. Understanding the impact of micro-properties on mechanical properties of materials can help us to improve the quality of materials. However, few literatures involved in backfill materials. Consequently, it is necessary to investigate the relationship between pore structure and the mechanical properties of backfill materials.
Many techniques have been applied to investigating the pore characteristics of concrete. In hardened cement based materials, the pores that form in different solid phases [9-11] can be studied using different methods (e.g., mercury intrusion porosimetry (MIP), nitrogen adsorption, and small- angle X-ray scattering (SAXS)). NMR has recently been shown to be an alternative and efficient tool for accurately quantifying the interlayer and gel pores (pore radius of 0-100 nm, NMR total relaxation time T2 ≤2.5 ms), capillary pores (pore radius of 100-10000 nm, 2.5 ms ≤ T2 ≤ 50 ms), and fractures (pore radius >10000 nm, T2>100 ms) [12-17], because it can provide reliable information on pore size distribution and pore fluid saturation. In addition, some studies [13,18-20] have suggested that NMR is an effective method for nondestructively quantifying the full-range pore throat structure of rocks and concrete, compared to other technologies such as mercury intrusion porosimetry and N2 adsorption. Furthermore, NMR experiments have been performed on core plugs in the laboratory to provide guidance for interpreting NMR logs and the construction of petrophysical models. By assisting with NMR technology and modeling these pores, fractal theory can be used to describe the microstructure of backfill materials.
Extensive literatures [21-24] have evidenced that pore fractal dimensions (i.e., surface fractal dimensions) are significantly correlated with porous cement-based materials performance, such as permeability [22,25] and mechanical properties [22]. In particular, PORTENEUVE et al [21] confirmed that hardened concrete pores have fractal features by studying three reactive powder concrete formulations using nuclear magnetic resonance (NMR). Previous studies [26-29] have proven that the pore structures of hard rock have fractal characteristics. Many researchers [30-33] have investigated the fractal characteristics of shale and coal using low-pressure N2 adsorption and NMR. Fractal theory, which uses a fractal dimension to quantitatively analyze the uniformity of a pore network, has been considered to be an effective method to characterize the complex pore structure of porous materials, such as backfill.
SHAO et al [34] researched the pore network in tight gas sandstone using fractal analysis based on the NMR method. The study confirmed that fractal dimensions obtained using NMR method can be applied to characterizing the tight sandstone pore network. JI et al [35] characterized fractal pore structure and analyzed the fluidity and exudation of fresh cement paste based on low-field NMR. An original method for calculating surface fractal dimensions of fresh cement paste based on low-field magnetic relaxation was proposed. ZHOU et al [33] investigated the fractal characteristics of pore-fracture in low-rank coal using a low-field NMR relaxation method. This work confirmed that quantitative analysis with NMR can be used to acquire the sorption space fractal, seepage space fractal, and moveable fluid space fractal. All these researches considered the pores within porous materials as a whole. There has been little research that divides pores into different pore sizes to study the influence of pores on mechanical properties. The impact of pores on macro-mechanical properties varies with the pore size. In consequence, it is necessary to divide pores into three types including micropores, mesopores, and macropores, to study their impacts.
In this work, a laboratory investigation of the microscopic feature and macro-mechanical properties of stone powder cement tailing backfills (SPCTB) was conducted. We analyzed mineral composition, particle size distribution (PSD) and physical properties. Proportion experiments and mechanics tests were conducted to obtain the uniaxial compressive strength (UCS) of SPCTB. NMR and SEM technologies were then used to analyze pore microstructure, total porosity, and pore size distribution. Then, a grading index (GI) formula for mixed aggregates based on maximum density curve theory was derived, grading curves were plotted, and GI values for mixed aggregates were calculated. In addition, the fractal dimensions for SPCTB micropores, mesopores, and macropores were obtained based on the NMR results. Finally, the relationships among GI, fractal dimension, porosity, and UCS were discussed. The precise impact of pore structures on macro-properties was elaborated, which contributed to understanding mechanism of strength growth and improving strength by optimizing pore structure.
2 Experimental
2.1 Physical and chemical properties of raw materials
The tailing samples used in this study were obtained from the Gaofeng Mine in Guangxi, China. The collected samples were divided into two types, i.e., tailing A and tailing B. Different types of tailings were produced by different beneficiation processes. Stone powder was obtained from the quarry around the Gaofeng Mine. The appearance and microtopography of the raw materials are shown in Fig. 1. The PSDs of the tailings and stone powder were analyzed using a Mastersizer 2000 from the Malvern Instruments Inc., UK (Fig. 2). The physical properties of the SPTCB are shown in Table 1. Table 2 and Fig. 3 show the chemical and mineral compositions of SPCTB using X-ray fluorescence (XRF) and XRD. The cement came from the Xinxing Cement Factory in Changsha, China, and water used in the experiment was deionized.
2.2 Sample preparation
SPCTB is composed of cement used as adhesive material, stone powder to replace some of the cement, tailings as a kind of aggregate, and water. Stone powder can regulate particle size gradation, so it can also be considered to be an aggregate and in the remainder of this work the mixed aggregate is made up of a mixture of stone powder and tailings. The design mix is shown in Table 3 according to engineering applications in the Gaofeng Mine. The design mix parameters of Group A were the same as those of Group B. A total of 48 samples were collected (six samples from each group) and raw materials were mixed in a cylindrical column mold of 50 mm × 100 mm, as shown in Fig. 4. Then, the samples were cured at ambient temperature (20 °C) and a relative humidity of 95% for 28 d. Finally, the samples were taken out from chamber and three samples a group were used to carry out mechanical tests. Other samples were put in vacuum saturation equipment to be saturated. After the samples were saturated for 4 h, they were taken out to conduct NMR tests. The mean values of test results were used for analysis.
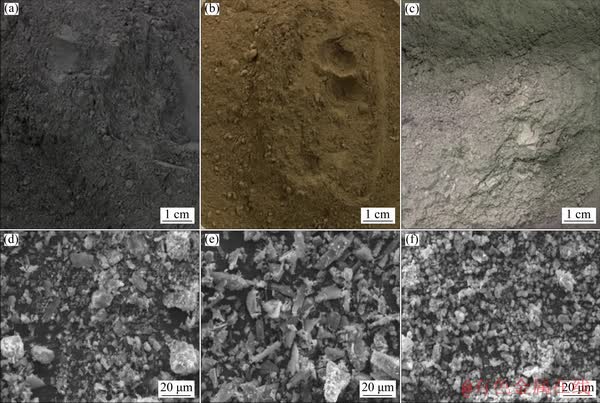
Fig. 1 Appearance (a-c) and SEM images (d-f) for stone powder (c, f) and tailings (a, b, d, e)
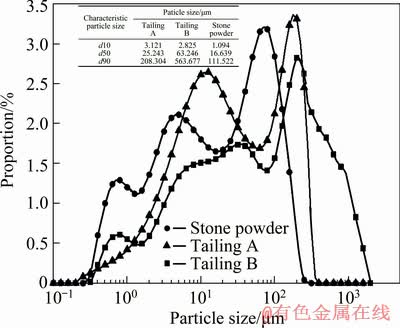
Fig. 2 Particle size distribution (PSD) and particle size characteristics of stone powder and tailings from Gaofeng Mine in Guangxi, China
Table 1 Basic physical properties of stone powder and tailings
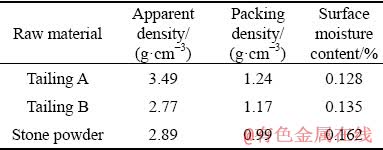
Table 2 Chemical compositions of tailings and stone powder
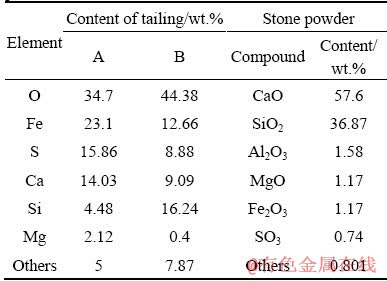
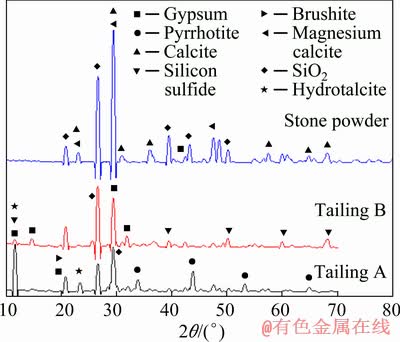
Fig. 3 XRD patterns of different samples showing mineral compositions of stone powder and tailings
2.3 NMR technology
The MiniMR-60 magnetic resonance imaging (MRI) analysis system was used for NMR testing. The system was manufactured by the Shanghai Niumag Electronic Technology Co., Ltd., China. The main magnetic field of the device was 0.51 T and the H proton resonance frequency was 21.7 MHz. The NMR total relaxation time T2 is related to surface relaxation, loose relaxation of fluid procession, and diffusion relaxation caused by gradient fields. In water-saturated samples, the T2 is directly proportional to the pore size and the magnitude of the T2 curve directly reflects the porosity of SPCTB samples. The relationship between pore size and T2 can be represented by a simplified equation:
 (1)
(1)
where ρ2 is the surface relaxivity strength, μm/ms; S/V is the surface area to volume ratio (specific surface area) of the pores, μm-1.
The pore radius is proportional to the pore throat radius, so Eq. (1) can be transformed into the following equation:
 (2)
(2)
where r is the pore radius, μm; Fs is a geometrical shape factor (for the spherical pores, Fs=3; for the columnar pores, Fs=2) [18].
Table 3 Design mix parameters of SPCTB
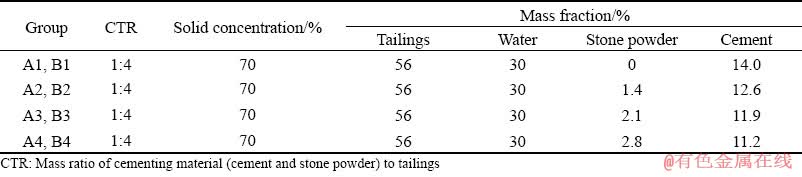
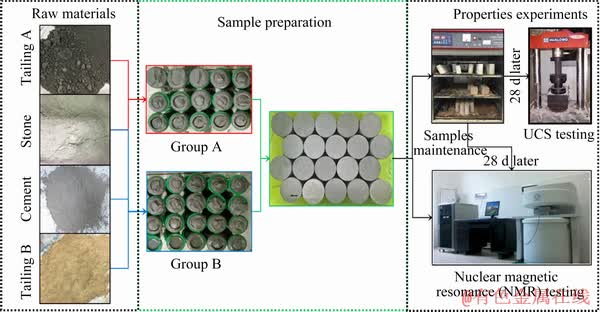
Fig. 4 Experimental process including sample preparation, NMR, and USC testing
Because smaller pores have higher values of S/V, Eq. (1) indicates that the relaxation rate of the protons in smaller pores is faster than that in larger pores. Consequently, the T2 relaxation time distribution of samples reflects pore structure distribution, with the smallest pores having the shortest relaxation time and the largest pores having the longest relaxation time. Consequently, NMR tests can be used to determine the distribution of macropores, mesopores, and micropores in SPCTB, which has the advantages of being non-destructive and repeatable.
In this work, three saturated samples were tested for each group and their mean values were used for analysis. The information of the CPMG sequence is as follows: RF signal frequency SF= 21 MHz; single sampling point TD=200170 ms; repeat sampling interval TW=3000 ms; echo time interval TE=0.1 ms; number of echoes NECH=2500; cumulative sampling times NS=16.
3 Results
3.1 Gradation curve of mixed aggregates
3.1.1 Maximum density theory (Füller gradation) curve of mixed aggregates
The maximum density theory curve was originally an ideal curve, which is as follows:
 (3)
(3)
where Px is the passing rate of mixed aggregates, %; d is the particle size, μm; D0 is the maximum particle size of mixed aggregates, mm; n is the GI of mixed aggregates.
The theory holds that when the n of mixed aggregates is 0.5, pore size is the smallest and compactness is the highest, that is, the solid particle aggregate gradation curve should be similar to the parabola in the following equation:
 (4)
(4)
For mixed aggregates consisting of stone powder and tailings, the passing rate of mixed aggregates Px can be expressed as
Px=wPs+(1-w)Pt (5)
where Ps and Pt are the passing rates of stone powder and tailings, respectively; w is stone powder content, %.
Thus, the particle size curve of mixed aggregates can be written as follows:
 (6)
(6)
Equation (6) can be used to determine the GI (n) of the mixed aggregates under different stone powder contents. It is necessary to test the particle size gradation of each aggregate in advance to reduce the amount of work for different proportional experiments.
3.1.2 GI of mixed aggregates
The median diameters d50 of Tailings A and B were 25.243 and 31.168 μm, respectively, which means that the tailings were ultrafine. The median stone powder diameter d50 was 16.639 μm, so it belonged to the category of ultrafine particles. The non-uniformity coefficients (Cu) and the curvature coefficients (Cc) of Tailings A and B were 14.56, 0.72 and 40.02, 0.71, respectively, indicating that Tailing A gradation was good while Tailing B had a wider range. According to Table 3, the cement stone powder mass ratios from A/B1 to A/B4 were 100:0, 90:10, 85:15, and 80:20, respectively. The particle size curves for mixed aggregates were plotted and GI was calculated using a nonlinear fitting method for each mixed aggregate (Figs. 5 and 6).
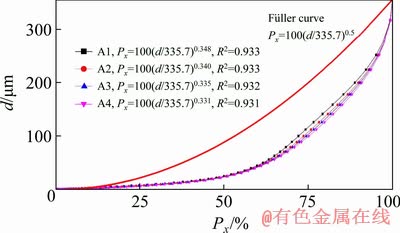
Fig. 5 Particle size curves for mixed aggregates and Füller curve for Group A (R2 is the correlation coefficient)
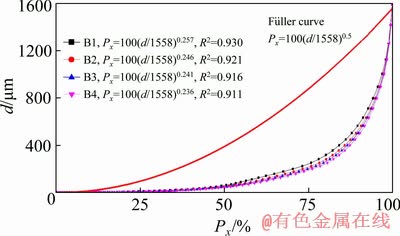
Fig. 6 Particle gradation curves for mixed aggregates and Füller curve for Group B
Figures 5 and 6 showed that the particle size curves of the two mixed aggregates deviated from the Füller curve and Group B had the larger deviation. Compared with the Füller curve, the PSD curve for Group A was not continuous and PSD ranged from 0 to 350 μm. Fine particle content was very high and there were too few medium particles; in addition, there were no features for large particles. The PSD curve for Group B exhibited more discontinuous behavior compared with that of Group A; however, the particle size ranged from 0 to 1600 μm, which resulted in high fine and medium particle content and hardly any large particles.
The GI values for Group A of mixed aggregates were 0.348, 0.340, 0.335, and 0.331, respectively, which were less than the Füller ideal GI value of 0.5, and GI decreased gradually with the increase of stone powder content. Because stone powder was made up of ultra-fine particles, this addition to the ultra-fine tailing further increased the fine particle content of mixed aggregates, which had a negative effect on the gradation. At the same time, GI values for Group A and the better compactness range of 0.35-0.5 obtained by the Talbol theory were basically consistent.
GI values for Group B were 0.257, 0.246, 0.241, and 0.236, respectively, which were less than the Füller ideal GI of 0.5. Although the GI regularity in Group B was the same as that of Group A, the deviation was larger. Compared with Group A, Group B had a wider particle size range but it was mostly fine and medium sized, with less large particles, which resulted in a greater deviation from Füller ideal GI. The differences of stone powder content for Groups A and B were not so apparent that GI values did not change too much. However, the difference of GI values had an obvious impact on the UCS because gradation should be taken into consideration in the study of the cross-scale characteristics.
In summary, the gradation of Group A was better than that of Group B, mainly reflected in the high fine particle content. An addition of stone powder would further increase the fine particle content, which would not be conducive to the maximum compactness of the mixed aggregate.
3.2 Pore size distribution characteristics and porosity
The T2 distributions for Groups A and B are shown in Fig. 7. Samples in Group A had three isolated peaks and samples in Group B had three continuous peaks, which were defined as Peaks 1, 2, and 3 in Fig. 7.
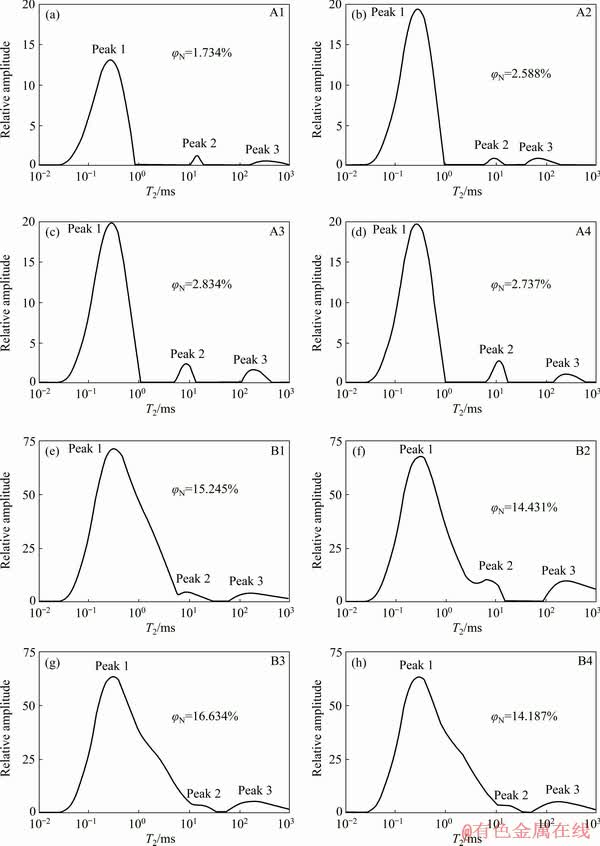
Fig. 7 NMR T2 relaxation time distributions of SPCTB samples (φN is total porosity of the sample)
MEHTA and MONTEIRO [36] referred to water in hardened cement slurry as chemically combined water that is an integral part of the microstructure of various cement hydration products; interlayer water associated with C―S―H structure, and physically adsorbed water that is close to the solid surface. Under the influence of attractive forces, water molecules are physically adsorbed onto the surface of solids in the hydrated cement paste: capillary water is free from the influence of attractive forces exerted by the solid surface, and free water is found in larger pores or cracks. The T2 relaxation time for chemically combined water in the hardened concrete is very short, and CMPG experimental technology could not acquire NMR signal. Because interlayer water (single water molecular layer) and the physically adsorbed water have similar spatial dimensions, peaks formed by interlayer water and physically adsorbed water are almost coincided to form Peak 1.
Combined with the above analysis and previous studies [12-17], JEHENG [15] measured the apparent transverse relaxation time of the chemically combined water in the backfill to be 12 ms. Literatures [12-17] also showed that the value of T2 relaxation time of chemically combined water is very short, and the CMPG experiment cannot collect the signal of chemically combined water in the sample. Therefore, the three peaks of the T2 spectrum correspond to the NMR signals of interlayer water, adsorbed water, capillary water and free water. It can be seen from Eq. (2) that the T2 relaxation time is proportional to pore radius. The radius of the pores where interlayer water, adsorbed water, capillary water, and free water exist gradually increases. Thus, Peaks 1, 2 and 3 were the signals generated by interlayer water, physical adsorbed, capillary water and free water, respectively. Water in different states is often found in pores with different spatial dimensions, so interlayer water and physically adsorbed water, capillary water, and free water were observed in micropores, mesopores, and macropores, respectively, as shown in Fig. 7.
The area percent of Peak 1 in the T2 distribution was greater than 90% for all samples. Peak 1 was the main source for the relaxation signal, indicating that the primary pores in SPCTB were micropores. They may therefore have the most important effect on the macroscopic mechanical properties of SPCTB.
Three isolated peaks (i.e., some of the signal amplitude reaches zero) can be seen in Figs. 7(a-d), indicating that there was no direct connection channel between micropores, mesopores, and macropores. In other words, pore throats were not developed in SPCTB Group A and samples were densely compacted. The relaxation time for Peak 1 was between 0.01 and 1 ms, that of Peak 2 was around 10 ms, and for Peak 3, it was between 100 and 1000 ms. Meanwhile, the signal amplitude for Peak 1 from Sample A1 was small, implying that internal micropores were not developed compared with other samples, which can be demonstrated by porosity. In addition, NMR porosity was proportionate to the amount of stone powder, indicating that the addition of stone powder increased the porosity of the material. This was due to the gradation of mixed aggregates (Section 3.1.2).
The relaxation peaks for Group B were consecutive, implying that some pore throats connected pores with different sizes, especially micropores and mesopores. Thus, the pores inside Group B samples were more developed with very complicated structure. The peak signal amplitudes in Group B were three times higher than those in Group A, indicating a higher pore content in Group B. The higher total porosity of Group B was around 15%, which further proved this point. In addition, total porosity had a weak relationship with stone powder content in Group B (Figs. 7(e-h)).
3.3 UCS results
The average UCS values for the samples of Groups A and B after 28 d curing are shown in Fig. 8, along with error bar of UCS.
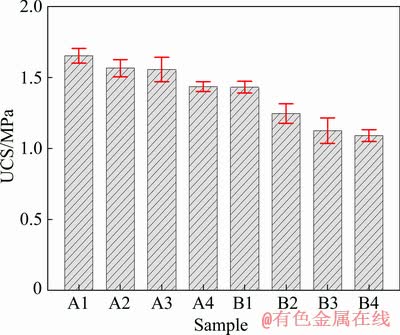
Fig. 8 UCS of samples after 28 d curing
The UCS values for Group A ranged from 1.4 to 1.65 MPa, and Groups A2 and A3 with different stone powder contents had almost the same UCS value of 1.5 MPa. Overall, UCS decreased with the increase of stone powder content. Similarly, the UCS values for Group B had a negative relationship with stone powder content and ranged from 1.1 to 1.4 MPa.
The minimum strength requirement for engineering backfills in mines at 28 d is 1.4 MPa. All samples from Group A met this requirement, while only the B1 sample (backfills without stone powder) met the strength requirement in Group B. In addition, the strengths of Samples B1 without stone powder and A4 with 20% stone powder were basically the same, which resulted from the poor gradation of Group B. The gradation of mixed aggregate therefore had an important impact on UCS.
3.4 SEM images
The SEM images of Samples A2 and B2 are shown in Fig. 9, which were used to analyze the microtopography of the samples.
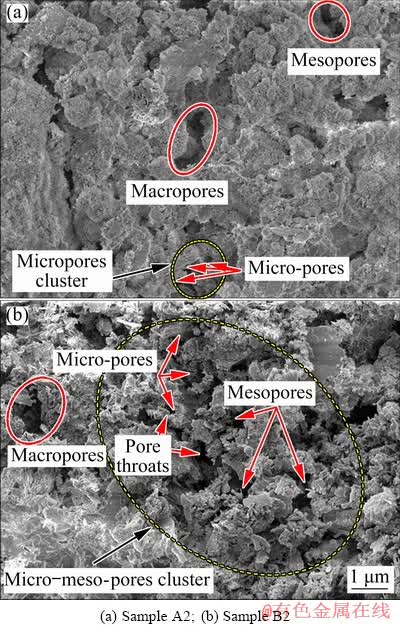
Fig. 9 SEM images of different samples
The differences of the pore structures inside the two samples can be clearly seen in Fig. 9. In Fig. 9(a), only different pore sizes can be observed. The length and width of the macropores were about 10 and 3 μm, and for mesopores, they were about 5 and 1 μm, respectively. They were narrow and generally appeared separately, while dense micropores occurred inside the materials as a connective pores group. It was apparent in Fig. 9(b) that the number of pores significantly increased, and mesopores and micropores clustered together to form a micro-meso-pores cluster. Finally, micropores and mesopores were developed and connected by pore throats to form a complicated structure.
4 Discussion
4.1 NMR fractal characteristics of SPCTB
4.1.1 Fractal geometric expression and dimension of NMR T2 distribution
According to the fractal geometric principle in Refs. [21,37], for hardened concrete the number of pores larger than pore diameter r N(>r) in SPCTB satisfies the following power function:
 (7)
(7)
where rmax is the maximum pore radius in SPCTB; P(r) is the pore size distribution density; a is a proportional constant; D is the pore fractal dimension.
By deriving r from Eq. (7), the pore size distribution density function can be obtained as
 (8)
(8)
where a′=-Da is a proportional constant.
The cumulative volume of pores with size less than r can be expressed as
 (9)
(9)
where a is a constant involved in pore shape (such as a cube of a=1 and a sphere of a=4π/3); rmin is the minimum pore radius.
Substituting Eq. (8) into Eq. (9) we obtain
 (10)
(10)
Therefore, the total pore volume in SPCTB is written as
 (11)
(11)
The expression for cumulative pore volume fraction (relative to total pore volume) Sv with a pore size radius smaller than r is as follows:
 (12)
(12)
Due to rmin<
 (13)
(13)
Equation (13) is the fractal geometric expression of pore size distribution.
According to Eqs. (1), (2) and (13), Sv is as follows:
 (14)
(14)
At this point, an approximate fractal geometric formula for the NMR T2 distribution can be obtained.
Taking the logarithm of the two sides of Eq. (14), we have
lg Sv=(3-D)lg T2+(D-3)lg T2,max (15)
Equation (15) shows that if the pore structure of SPCTB has a fractal property, lg Sv and lg T2 of NMR spectra should have a linear correlation, which can be verified by graphic method or regression analysis. If there is a linear correlation, the fractal dimension and maximum relaxation time of the pore structure can be calculated according to coefficients of the regression equation. According to correlation coefficients given by the regression analysis, the degree of conformity of the pore fractal structure can be explained. The NMR fractal dimension can explain pore structure complexity.
4.1.2 Fractal characteristics of SPCTB
The relationship between NMR T2 relaxation time distribution and fractal characteristics is shown in Fig. 10 (using A1 as an example).
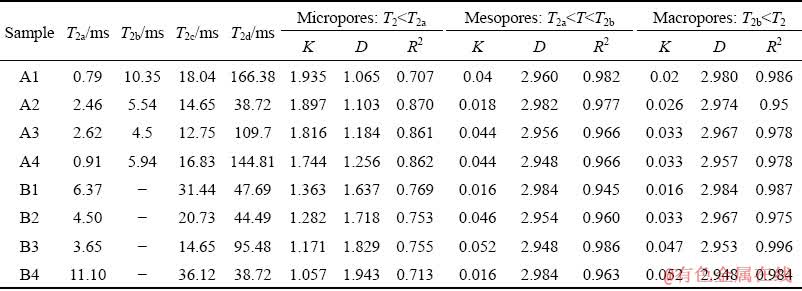
Because the pore radius r distribution was not continuous, some amplitude values may have been missing over longer intervals, indicating that amplitudes were of 0 or close to 0 on the NMR T2 spectrum. For example, the space between solitary peaks in Group A had no corresponding pore radius r distribution (Fig. 7). NMR fractal theory was used to analyze the fractal characteristics of pores. Therefore, data points with amplitudes of 0 were discarded prior to correlation analysis. At the same time, the fractal characteristics of the three types of pores were clearly different and they were studied separately by classifying the fractal dimension into macropores, mesopores, and micropores. According to Eq. (14), the T2 spectrum in Fig. 7 was analyzed by regression. The fractal dimensions of the three pore types are shown in Table 4 and Fig. 11. As shown in Fig. 10, T2a was the T2 cut-off time for micropores, T2b and T2c were for mesopores, and T2d was for macropores. When the peaks in the T2 spectrum were connected, the corresponding cut-off times coincided; similarly, the first and second peaks in Figs. 7(e-h) were connected, which meant that T2a was equal to T2b.
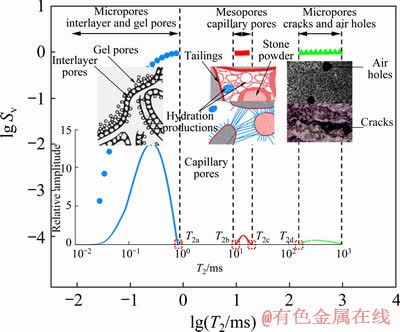
Fig. 10 Relationship between relaxation time T2 and fractal characteristics (Solid line in Fig. 10 is T2 spectrum; the scatter is its corresponding fractal characteristics)
As shown in Table 4 and Fig. 11, fractal dimensions for micropores in Group A had a positive relationship with stone powder content, indicating that stone powder contributed to pore complexity. All correlation coefficients R2 were >0.7, which demonstrated that micropores in Group A had fractal characteristics and the fractal dimension results were highly reliable. Because mesopores were capillary pores that provided space for water storage and hydration reactions during concrete hardening, they randomly formed between different samples at the end of the hydration process. Thus, the mesopore fractal dimension slightly fluctuated with stone powder content, less in Group A2 than others. Mesopore fractal dimension varied with stone powder content and decreased overall, indicating that stone powder had an effect on the complexity. In addition, the correlation coefficients for mesopore fractal dimension were greater than 0.95, which showed that the macropores and mesopores had strong fractal features.
The regulation of macropore, mesopore, and macropore fractal dimensions in Group B was the same as that in Group A. Correlation coefficients R2 of micropore fractal dimension of Group B were >0.7, and for macropores and mesopores they were greater than 0.94, which indicated that pores in Group B also had strong fractal characteristics and the fractal dimensions obtained by regression analysis were reliable. However, the NMR micropore fractal dimension of Group B was greater than that of Group A, on average greater than 0.5, but the macropore fractal dimension of Group B was slightly less than that of Group A. It can also be clearly seen in Fig. 9 that the pore structure of Group B was more complicated and pore size distribution in Group B was denser, forming groups of pores connected by throats. Because the mixed aggregates in Group B contained fewer large particles and more fine particles, this resulted in a low filling rate between fine and large particles, loose structure, and high void complexity. The cross-sectional images in Fig. 11 verified the fractal mathematical description of pore complexity.
Table 4 Cut-off time for micropores, mesopores, and macropores and fractal dimensions obtained from NMR (K is slope of fitted line)
4.1.3 Relationship between NMR fractal dimension and porosity
The relationship between NMR fractal dimension and porosity of pores in Groups A and B is shown in Fig. 12.
It can be seen from Fig. 12 that the total NMR porosity and fractal dimension of micropores in Group A were smaller, while those of Group B were larger. Although the fractal dimension and porosity of Groups A and B were quite different, the regression equation y=18.413x-18.212 well described the relationship between the two parameters. The correlation coefficient was 0.89, which was significant. This implied that the NMR fractal dimension had a positive relationship with total NMR porosity of SPCTB for micropores, which was irrelevant to the tailings properties and types. However, for mesopores and macropores, there was no obvious correlation between fractal dimension and porosity (Figs. 12(b) and (c)). When micropores in backfills accounted for more than 90%, the complexity of micropores increased and the number of pore throats increased correspondingly. In this case, the internal pore structure became loose and NMR porosity increased.
4.2 Cross-scale characteristics
4.2.1 Relationship between GI and NMR fractal dimension
We have seen that percentage of various particle sizes of mixed aggregates and compactness of SPCTB affected the pore size distribution, pore structure, and morphology. The regression analysis for GI (n) of mixed aggregates and NMR fractal dimension is shown in Fig. 13. Because mesopores were irregular, they were analyzed in this section.
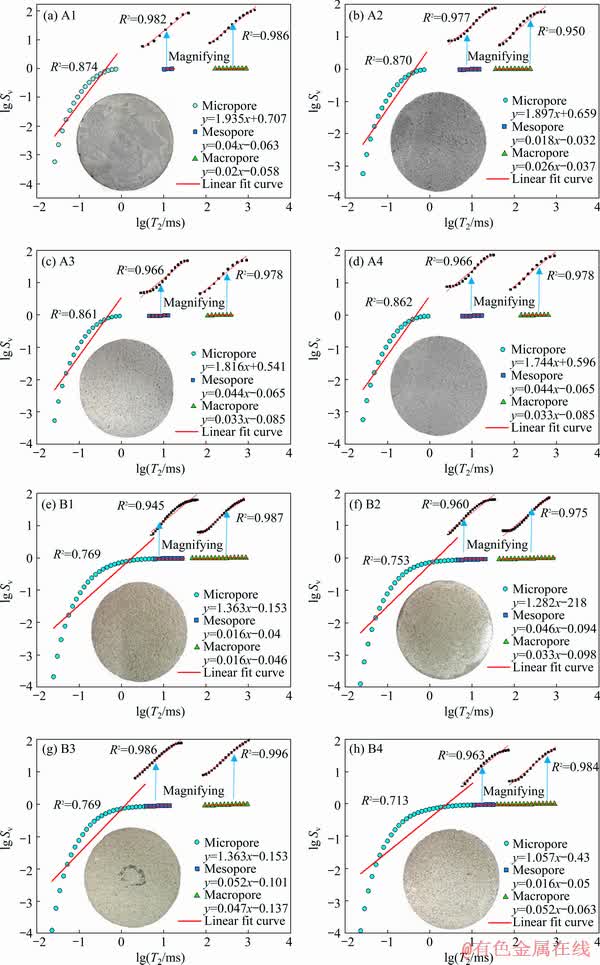
Fig. 11 NMR fractal characteristics with cross-section images for all samples (Enlarged drawings for mesopores and macropores are shown at the top of each graph)
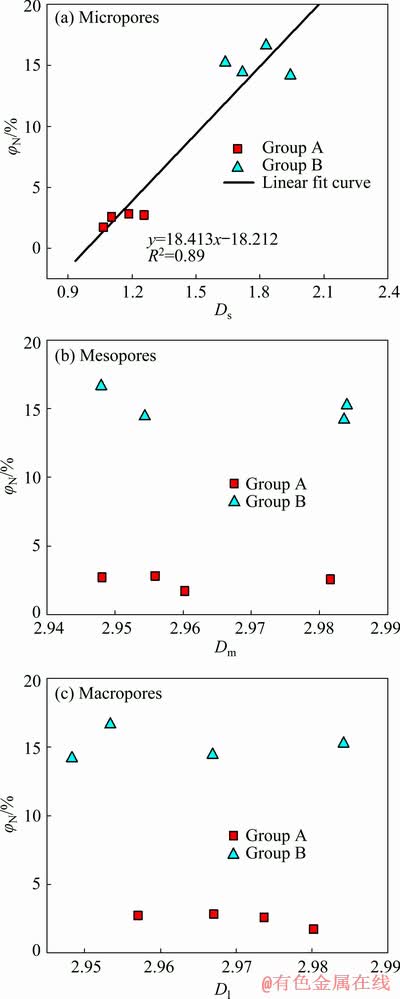
Fig. 12 Relationship between porosity (φN) and NMR fractal dimension (Ds, Dm and Dl are fractal dimensions of micropores, mesopores and macropores, respectively)
NMR fractal dimensions of micropores from Groups A and B had a negative correlation with the GI of mixed aggregates. The correlation coefficient was 0.97, which indicated that the correlation was very strong and the fitted lines were reliable. Combined with the previous analysis (Section 3.1.2), Group B had a wide PSD range but most particles were concentrated in a medium-fine size range, resulting in a decrease in the GI. Consequently, this decreased the compactness of SPCTB. In addition, many internal pores could not be completely filled and many irregular pores were formed, which made the pore structure complicated (Fig. 9). At the same time, the macropore fractal dimension was positively correlated with GI but the correlation coefficient for Groups A and B was only 0.023, which meant that the relationship could not be well expressed by regression. In other words, macropore structure varied with tailing type. Thus, the laws of the two groups should be analyzed separately. The relationship between GI and fractal dimension for Group A was expressed as y=1.287x+2.534, R2=0.882; and for Group B it was y=1.748x+2.535, R2=0.979. In this case, the correlation coefficients for the two groups proved that GI had a reliable relationship with fractal dimension for each type of tailing. Additionally, under the same GI condition, the fractal dimension of Group B was significantly higher than that of Group A, which indicated that there must be certain properties aside from mixed aggregate gradation between Groups A and B that had a considerable impact on fractal dimension. What’s more, when GI was close to 0, the macropore fractal dimension of Group A was almost equal to that of Group B. This meant that if mixed aggregate particle size was limited to ultrafine particles, other tailings properties would have no impact on fractal dimension. The reason why the tailings properties influenced macropore fractal dimension but not micropores was that the shape of large tailing particles in Group B was rod and columnar (Fig. 1), so pores shaped by those were irregular with an uneven distribution. As a result, those pores were difficult to fill with smaller particles and formed many irregular smaller pores during the hardening process, which clearly increased pore structure complexity. Therefore, at the same GI value for Groups A and B, the fractal dimension of Group B was significantly greater than that of Group A. The shape of the tailings should accordingly be considered in the analysis of the relationship between graduation and fractal dimension.
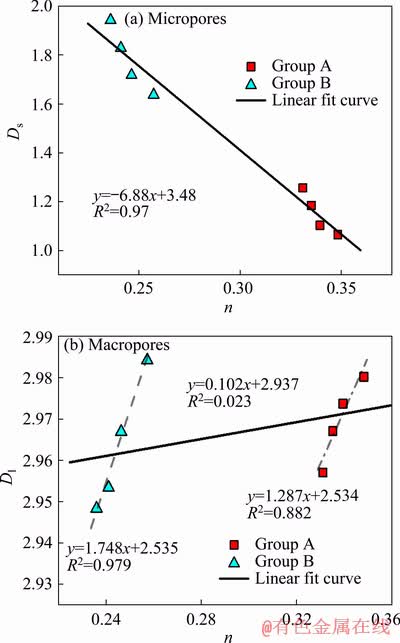
Fig. 13 Relationship and regression analysis between GI (n) of mixed aggregates and fractal dimension
4.2.2 GI and fractal dimension on UCS
The relationship between UCS for Groups A and B and NMR fractal dimension is shown in Fig. 14, which included the normal relationship between micropores and macropores. UCS was negatively correlated with NMR fractal dimension for micropores, so when the complexity of micropores increased, the UCS decreased. The fitted line was y=-0.569x+2.221 and the correlation coefficient R2 was 0.885, which meant that there was a significant correlation, while there was no correlation with tailings properties. This was because when GI was small, gradation was poor and pores shaped by larger aggregate particles cannot be filled by smaller particles. This produced loose and irregular pore structure and increased porosity. During the SPCTB hardening process, there was damage to the pores that reduced SPCTB strength. By comparing the pore structures of Groups A and B in Fig. 9, damage mostly occurred to micropores. The correlation coefficient between macropore fractal dimension and UCS was only 0.484, so there was not a strong correlation. This was because the macropores were isolated and discrete, which had less influence on strength than the micropores.
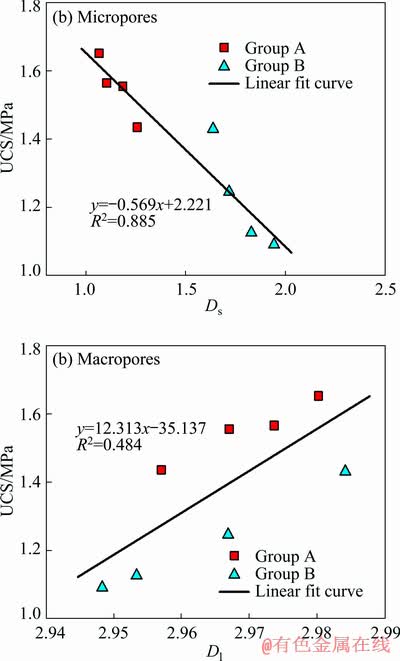
Fig. 14 Relationship between UCS and NMR fractal dimension
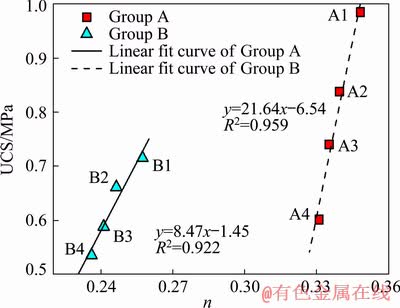
Fig. 15 Relationship between UCS and GI (n) of mixed aggregates
The correlation coefficients were all greater than 0.9, which indicated that there was a significant relationship between UCS and GI that could be properly expressed by the fitted lines. However, the rule for Group A differed from that for Group B; Group A: y=21.64x-6.54; Group B: y=8.47x-1.45. This meant that for the same GI value, the UCS of Group A was significantly higher than that of Group B. Like the previous analysis, Group B contained a large number of rods and columnar particles, so aside from the influence of mixed aggregates gradation, the irregular shape of particles also loosened the microstructure of SPCTB, which reduced UCS. In addition, the strength of Group A increased considerably faster than that of Group B, which may have resulted from the gradation and tailings properties. Because the relevant tests were not conducted, the reasons for this are unknown.
5 Conclusions
(1) GI values for Groups A (0.348-0.331) and B (0.257-0.236) were calculated using nonlinear regression analysis, which had a negative correlation with SP content. The addition of stone powder increased the content of fine particles and was harmful for mixed aggregate gradation.
(2) NMR experiments were conducted and found that the T2 relaxation time distribution of Group A had three isolated peaks, while Group B was almost consecutive. The pore throats were well developed and pore structure was more complex for Group B. The pore structure of Group A formed a micropores cluster and Group B formed a micro-meso-pores cluster. NMR porosity of Group B (15.245%-14.187%) was significantly higher than that of Group A (1.734%-2.737%), while it had non-obvious relationship with stone powder content.
(3) Based on NMR results, the fractal dimensions of micropores (A1-B4: 1.065-1.943), mesopores (2.96-2.984), and macropores (2.98-2.948) were calculated. Fractal dimension was positively correlated with stone powder content and porosity for micropores, which meant that stone powder increased the complexity of micropores, while it had a negative correlation with stone powder content for macropores.
(4) Micropore fractal dimension had a negative relationship with UCS and GI. However, the impact of macropore fractal dimension on UCS and grading was the most significant and the relationship was the opposite for that of micropores. In addition, GI also had a positive correlation with UCS.
(5) The relationship between GI and macropore fractal dimension was related to other properties (except gradation) of SPCTB, such as the shape of mixed aggregates. The relationship also exists between GI and UCS. Moreover, the reason why the strength of Group A increased considerably faster than that of Group B remains unknown. Finally, the impact mechanism of gradation on porosity and pore complexity is currently unclear. All of these questions need to be resolved through further relevant experimentation.
References
[1] YANG E H, YANG Y Z, LI V C. Use of high volumes of fly ash to improve ECC mechanical properties and material greenness [J]. ACI Materials Journal, 2007, 104: 620-628.
[2] KUPWADE-PATIL K, PALKOVIC S D, BUMAJDAD A, SORIANO C, BUYUKOZTURK O. Use of silica fume and natural volcanic ash as a replacement to Portland cement: Micro and pore structural investigation using NMR, XRD, FTIR and X-ray microtomography [J]. Construction Building Materials, 2018, 158: 574-590.
[3] SONG Y, DAVY C A, BERTIER P, SKOCZYLAS F, TALANDIER J. On the porosity of COx claystone by gas injection [J]. Microporous and Mesoporous Materials, 2017, 239: 272-286.
[4] BEDE A, SCURTU A, ARDELEAN I. NMR relaxation of molecules confined inside the cement paste pores under partially saturated conditions [J]. Cement and Concrete Research, 2016, 89: 56-62.
[5] SUN Xiao, ZHANG Bin, DAI Qing-li, YU Xiong. Investigation of internal curing effects on microstructure and permeability of interface transition zones in cement mortar with SEM imaging, transport simulation and hydration modeling techniques [J]. Construction Building Materials, 2015, 76: 366-379.
[6] CHEN H J, WU C H. Influence of aggregate gradation on the engineering properties of lightweight aggregate concrete [J]. Applied Sciences, 2018, 8: 1324-1335.
[7] DIYALJEE V. Discussion of "degradation-related changes in ballast gradation and aggregate particle morphology" by Yu Qian, Huseyin Boler, Maziar Moaveni, Erol Tutumluer, Youssef M. A. Hashash, and Jamshid Ghaboussi [J]. Journal of Geotechnical and Geoenvironmental Engineering, 2018, 144: 07018011.
[8] KOOHMISHI M, PALASSI M. Effect of gradation of aggregate and size of fouling materials on hydraulic conductivity of sand-fouled railway ballast [J]. Construction Building Materials, 2018, 167: 514-523.
[9] AL-KHEETAN M J, RAHMAN M M, CHAMBERLAIN D A. A novel approach of introducing crystalline protection material and curing agent in fresh concrete for enhancing hydrophobicity [J]. Construction Building Materials, 2018, 160: 644-652.
[10] AL-KHEETAN M J, RAHMAN M M, CHAMBERLAIN D A. Fundamental interaction of hydrophobic materials in concrete with different moisture contents in saline environment [J]. Construction Building Materials, 2019, 207: 122-135.
[11] DTOUET E, POYET S, TORRENTI J M. Temperature influence on water transport in hardened cement pastes [J]. Cement and Concrete Research, 2015, 76: 37-50.
[12] YAO Yan-bin, LIU Da-meng, TANG Da-zhen, TANG Shu-heng, HUANG Wen-hui H, LIU Zhi-hua, YAO Che. Fractal characterization of seepage-pores of coals from China: An investigation on permeability of coals [J]. Computers & Geosciences, 2009, 35: 1159-1166.
[13] SHANG Jun-long, HU Jian-hua, ZHOU Ke-ping, LUO Xian-wei, ALIYU M. Porosity increment and strength degradation of low-porosity sedimentary rocks under different loading conditions [J]. International Journal of Rock Mechanics and Mining Sciences, 2015, 75: 216-223.
[14] ZHOU Ke-ping, GAO Ru-gao, GAO Feng. Particle flow characteristics and transportation optimization of superfine unclassified backfilling [J]. Minerals, 2017, 7(1): 1-21.
[15] JEHNG J. Microstructure of wet cement pastes: A nuclear magnetic resonance study [D]. Evanston, USA: Northwestern University, 1995.
[16] HARMER J, CALLCOTT T, MAEDRE M SMITH B E. A novel approach for coal characterization by NMR spectroscopy: Global analysis of proton T1 and T2 relaxations [J]. Fuel, 2001, 80: 417-425.
[17] HORNAK J P. The basics of NMR [EB/OL] 1999-07-22. http://www.cis.rit.edu/htbooks/nmr/bnmr.htm.
[18] HINAI A A, REZAEE R, ESTEBAN L, LABANI M. Comparisons of pore size distribution: A case from the Western Australian gas shale formations [J]. Journal of Unconventional Oil and Gas Resources, 2014, 8: 1-13.
[19] REZAEE R, SAEEDI A, CLENNELL B. Tight gas sands permeability estimation from mercury injection capillary pressure and nuclear magnetic resonance data [J]. Journal of Petroleum Science & Engineering, 2012, 88-89: 92-99.
[20] SIGAL R F, ODUSINA E. Laboratory NMR measurement on methane saturated Barnett shale sample [J]. Petrophysics, 2011, 52: 1-10.
[21] PORTENEUVE C, KORB J P, PETIT D, ZANNI H. Structure-texture correlation in ultra-high-performance concrete: A nuclear magnetic resonance study [J]. Cement and Concrete Research, 2002, 32: 97-101.
[22] TAN Xiao-hua, LI Xiao-ping, LIU Jian-yi, ZHANG Lie-hui, FAN Zhou. Study of the effects of stress sensitivity on the permeability and porosity of fractal porous media [J]. Physics Letters A, 2015, 379: 2458-2465.
[23] FICKER T. Fractal strength of cement gels and universal dimension of fracture surfaces [J]. Theoretical and Applied Fracture Mechanics, 2008, 50: 167-171.
[24] HU Jian-hua, REN Qi-fan, MA Shao-wei, JIANG Quan, JIANG Yuan-jian, SHANG Jun-long, LUO Zhou-quan. Macroscopic and microscopic trans-scale characteristics of pore structure of mine grouting materials [J]. Transactions of Nonferrous Metals Society of China, 2019, 29: 1067-1081.
[25] DAVY C A, ADLER P M. Three-scale analysis of the permeability of a natural shale [J]. Physical Review, 2017, 96: 1-12.
[26] PFEIFER P, AVNIR D. Chemistry in noninteger dimensions between two and three. I. Fractal theory of heterogeneous surfaces [J]. Journal of Chemical Physics, 1983, 79: 3558-3565.
[27] SONG Y, DAVY C A, TROADEC D. Gas breakthrough pressure (GBP) through claystones: Correlation with FIB/SEM imaging of the pore volume [J]. Oil Gas Sci Technol, 2016, 71: 1-16.
[28] KHALILI N R, PAN M, SANDI G. Determination of fractal dimensions of solid carbons from gas and liquid phase adsorption isotherms [J]. Carbon, 2000, 38: 573-588.
[29] GIRI A, TARAFDAR S, GOUZE P, DUTTA T. Fractal pore structure of sedimentary rocks: Simulation in 2-D using a relaxed bidisperse ballistic deposition model [J]. Journal of Applied Geophysics, 2012, 87: 40-45.
[30] MULLER J. Characterization of pore space in chalk by multifractal analysis [J]. Journal of Hydrology, 1996, 187: 215-222.
[31] TURCOTTE D L. Fractals in petrology [J]. Lithos, 2002, 65: 261-271.
[32] ZHOU Lei, KANG Zhi-hong. Fractal characterization of pores in shales using NMR: A case study from the lower Cambrian Niutitang formation in the middle Yangtze Platform, Southwest China [J]. Journal of Natural Gas Science and Engineering, 2016, 35: 860-872.
[33] ZHOU San-dong, LIU Da-meng, CAI Yi-dong, YAO Yan-bin. Fractal characterization of pore-fracture in low-rank coals using a low-field NMR relaxation method [J]. Fuel, 2016, 181: 218-226.
[34] SHAO Xin-he, PANG Xiong-qi, LI Hui, ZHANG Xue. Fractal analysis of pore network in tight gas sandstones using NMR method: A case study from the Ordos Basin, China [J]. Energy & Fuels, 2017, 31: 10358-10368.
[35] JI Yan-liang, SUN Zhen-peng, JIANG Xiao-xing, LIU Yi, SHUI Liang-liang, CHEN Chao. Fractal characterization on pore structure and analysis of fluidity and bleeding of fresh cement paste based on 1H low-field NMR [J]. Construction Building Materials, 2017, 140: 445-453.
[36] MEHTA P K, MONTEIRO P. Concrete: Structure, Properties and Materials [M]. Englewood: Prentice-Hall Press, 1986: 21-34.
[37] JIA Fen-shu, SHEN Ping-ping, LI Ke-wen. Study on the fractal characteristics of sandstone pore structure and its application [J]. Fault-block Oil Gas Field,1995, 2: 16-21.
胡建华1,任启帆1,杨东杰1,马少维1,尚俊龙2,丁啸天1,罗周全1
1. 中南大学 资源与安全工程学院,长沙 410083;
2. School of Civil and Environmental Engineering, Nanyang Technological University, 50 Nanyang Avenue, Singapore
摘 要:分析石粉水泥尾矿充填体的孔隙结构,量化孔隙的分形维数,计算混合骨料的分级指数(GI),并研究分级指数、孔隙结构与强度之间的关系,以描述其跨尺度特征。同时,对石粉水泥尾矿充填体进行一系列室内实验。基于Füller理论推导混合骨料(石粉和水泥尾矿)的GI公式。通过分形几何原理推导充填体的核磁共振(NMR)分形维数。与中孔和大孔分形维数相比,微孔分形维数与NMR孔隙率、孔结构复杂性、单轴抗压强度(UCS)和GI等宏观特性之间的相关性最为显著。大孔分形维数通常与UCS和GI相关,而其他属性(如混合骨料的形状)也影响分形维数。但中孔分形维数与宏观特性无明显关系。最后,研究GI和UCS之间的关系,这有助于改善充填体的强度和优化级配效果。
关键词:充填体;跨尺度特征;分级指数;分形维数;核磁共振
(Edited by Wei-ping CHEN)
Foundation item: Project (41672298) supported by the National Natural Science Foundation of China; Project (2017YFC0602901) supported by the National Key Research and Development Program of China
Corresponding author: Dong-jie YANG; Tel: +86-18684911183; E-mail: yangdjxx@csu.edu.cn
DOI: 10.1016/S1003-6326(20)65301-8

