固溶加热速率与Al-Mg-Si-Cu合金力学性能、显微组织及织构的关系
来源期刊:中国有色金属学报(英文版)2021年第1期
论文作者:汪小锋 郭明星 彭文飞 王永刚 庄林忠
文章页码:36 - 52
关键词:Al-Mg-Si-Cu合金;固溶加热速率;力学性能;显微组织;织构
Key words:Al-Mg-Si-Cu alloy; solution heating rate; mechanical properties; microstructure; texture
摘 要:通过拉伸试验、扫描电镜、X射线衍射仪和EBSD技术研究固溶加热速率与Al-Mg-Si-Cu合金力学性能、显微组织及织构的关系。实验结果表明,固溶加热速率与力学性能、显微组织及织构的关系是非单调的。随着加热速率的增加,强度变化取决于拉伸方向;加工硬化指数n先减小,后增加;塑性应变比r值先增加,后减小,最后又增加。加热速率对合金最终显微组织和织构有一定影响。随着加热速率的增加,显微组织由拉长晶粒组织转变为等轴晶粒组织,平均晶粒尺寸呈先减小、然后增加、最后再减小的趋势。随着加热速率的增加,尽管织构组分如CubeND{001}á310?和P{011}á122?基本无变化,但织构密度和体积分数呈现先减小、后增加、最后减小的趋势。加热速率对显微组织和织构演变的影响较小。提高加热速率并不总是有利于形成细小的等轴晶粒组织、弱织构以及较大的平均r值,这些与合金的再结晶行为有关。
Abstract: The relationship among heating rate, mechanical properties, microstructure and texture of Al-Mg-Si-Cu alloy during solution treatment was investigated through tensile test, scanning electron microscope, X-ray diffractometer and EBSD technology. The experimental results reveal that there is a non-monotonic relationship among solution heating rate, mechanical properties, microstructure and texture. As the solution heating rate increases, the strength variations are dependent on the tensile direction; work hardening exponent n decreases first, and then increases; plastic strain ratio r increases first, and then decreases, and finally increases. The final microstructure and texture are also affected by heating rate. As heating rate increases, the microstructure transforms from elongated grain structure to equiaxed grain structure, and the average grain size decreases first, and then increases, and decreases finally. Although the texture components including CubeND{001}á310? and P{011}á122? orientations almost have no change with the increase of heating rate, the texture intensity and volume fraction decrease first, and then increase, and finally decrease. Both microstructure and texture evolutions are weakly affected by heating rate. Improving heating rate is not always favorable for the development of fine equiaxed grain structure, weak texture and high average r value, which may be related to the recrystallization behavior.
Trans. Nonferrous Met. Soc. China 31(2021) 36-52
Xiao-feng WANG1, Ming-xing GUO2, Wen-fei PENG1, Yong-gang WANG1, Lin-zhong ZHUANG2
1. Key Laboratory of Impact and Safety Engineering, Ministry of Education, Ningbo University, Ningbo 315211, China;
2. State Key Laboratory for Advanced Metals and Materials, University of Science and Technology Beijing, Beijing 100083, China
Received 13 March 2020; accepted 7 September 2020
Abstract: The relationship among heating rate, mechanical properties, microstructure and texture of Al-Mg-Si-Cu alloy during solution treatment was investigated through tensile test, scanning electron microscope, X-ray diffractometer and EBSD technology. The experimental results reveal that there is a non-monotonic relationship among solution heating rate, mechanical properties, microstructure and texture. As the solution heating rate increases, the strength variations are dependent on the tensile direction; work hardening exponent n decreases first, and then increases; plastic strain ratio r increases first, and then decreases, and finally increases. The final microstructure and texture are also affected by heating rate. As heating rate increases, the microstructure transforms from elongated grain structure to equiaxed grain structure, and the average grain size decreases first, and then increases, and decreases finally. Although the texture components including CubeND{001}<310> and P{011}<122> orientations almost have no change with the increase of heating rate, the texture intensity and volume fraction decrease first, and then increase, and finally decrease. Both microstructure and texture evolutions are weakly affected by heating rate. Improving heating rate is not always favorable for the development of fine equiaxed grain structure, weak texture and high average r value, which may be related to the recrystallization behavior.
Key words: Al-Mg-Si-Cu alloy; solution heating rate; mechanical properties; microstructure; texture
1 Introduction
As the requirement of energy saving and emission reduction is becoming much strict, considerable effort has been devoted to the development of lightweight advanced materials to reduce automotive weight for the automotive industry [1-3]. Aluminum alloys have been an attractive candidate, due to their high mechanical properties, excellent corrosion resistance, good appearance and good recyclability [4,5]. Among the aluminum alloys, the heat-treatable Al-Mg-Si-Cu alloys have a great potential in the fabrication of car body outer panels, owing to their low yield strength and good formability in the T4P state (solution treatment and pre-aging treatment, and natural aging treatment), and high service strength in the BH state (paint baking treatment) [6].
As is well known, the thermomechanical processing has a great impact on the micro- structure, texture and mechanical properties of Al-Mg-Si-Cu alloys, and it is a very complicated issue to control microstructure and texture as a result of the long production process [7-11]. The mechanical properties of Al-Mg-Si-Cu alloys in the T4P state are determined by the recrystallization microstructure and texture in the solution state, therefore, it seems very important and direct to improve mechanical properties, according to optimizing solution parameters.
In the previous study [12], we concluded that solution heating rate has a significant influence on microstructure, texture and mechanical properties of Al-Mg-Si-Cu alloy. The alloy sheet at a high heating rate possesses equiaxed grain structure, weak texture including the CubeND{001}<310> orientation, low mechanical property anisotropy and high average plastic strain ratio r value; while the alloy sheet at a low heating rate possesses elongated grain structure, stronger texture including recrystallization texture component and deformation texture component, higher mechanical property anisotropy and lower average r value. GAO et al [13] found that the Al-Mg-Si alloy solution-treated in an air-circulation oven with a faster heating rate and a more uniform temperature distribution has finer and more uniform grain structure, weaker texture, lower average r value and better bake hardenability, in comparison with that in electrical resistance oven. Besides, some investigations about the effect of heating rate on microstructure, texture and mechanical properties of other series aluminum alloys have been carried out recently. LIU et al [14] reported that heating rate had a remarkable influence on the microstructure and texture of AA3105 aluminum alloy. Low heating rate is beneficial to the development of coarse elongated grains, strong P{011}<122> and CubeND orientations, whereas high heating rate is likely to result in the formation of fine equiaxed grains at a suitable temperature, weak Cube {001}<100> orientation, and high tensile strength and elongation. The similar study in as-cast AA5083 aluminum alloy done by XIA et al [15] showed that a coarse elongated grain structure and a weak {114}<110> orientation were obtained in the case of slow annealing, while a finer equiaxed grain structure, weaker Cube and {114}<110> orientations, higher yield strength and slightly higher ultimate tensile strength were obtained in the case of rapid annealing. The microstructure and texture of Al-Cu-Mg alloy also showed the dependence of heating rate which indicated that the elongated grains with Cube, Goss{110}<001> and S{123}<634> orientations were acquired for low heating rate, and fine equiaxed grains with P orientation were acquired for high heating rate [16].
Based on the summary of the previous researches [12-16], it can be found that high heating rate can optimize microstructure and texture of aluminum alloys, and thus improve mechanical properties. However, only two heating rates were adopted in those researches, therefore, it is difficult to determine whether the relationship among heating rate, microstructure, texture and mechanical property is monotonic or not, which is critical for further optimization of solution parameters. Accordingly, in order to understand the relationship among heating rate, microstructure, texture and mechanical properties well, several heating rates were adopted in the present study, and their effects on the microstructure, texture and mechanical properties were investigated detailedly. Hopefully, this work could provide a further guidance for the optimization of solution parameters for Al-Mg-Si-Cu alloy.
2 Experimental
2.1 Materials preparation
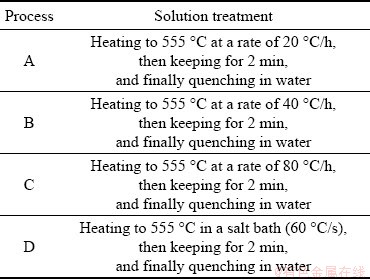
A cold-rolled Al-Mg-Si-Cu alloy sheet with a thickness of 1 mm was prepared for this study, and its chemical composition is Al-0.7Mg-0.9Si- 0.7Cu-0.3Fe-0.2Mn (wt.%). The alloy sheet was divided into four parts denoted as A, B, C and D, respectively. They were subjected to different solution treatments, which are listed in Table 1. After that, all the four parts were immediately pre-aged at 80 °C for 12 h in an electric thermostatic drying oven, and finally kept at room temperature for 14 d (T4P treatment).
In order to study the microstructure and texture evolutions of the cold-rolled alloy sheets A, B and C with three different heating rates, three intermediate samples were heated up from room temperature to 300, 400 and 500 °C at the corresponding heating rate respectively for each heating rate condition, and then water-quenched to freeze the microstructure at those high temperatures.
2.2 Mechanical property characterization
The tensile tests for the T4P-treated alloy sheets were performed on an Instron 5966 testing machine with a velocity of 2 mm/min at room temperature. Mechanical properties in three directions of 0°, 45° and 90° with respect to the rolling direction were acquired including yield strength (YS), ultimate tensile strength (UTS), elongation, and work hardening exponent n and r values. r could be calculated by the variation of specimen width at the strain of 15%, and n could be obtained by fitting the stress-strain curves (strain was selected in the range of 5%-15%). As is well known, deep drawability could be further characterized by average r and △r values, which are expressed as r=(r0+2r45+r90)/4 and Δr=(r0+r90-2r45)/2, where r0, r45 and r90 are r values in the directions of 0°, 45° and 90° with respect to the rolling direction, respectively. For each condition, the tests were repeated at least three times.
Table 1 Different solution treatments of cold-rolled Al-Mg-Si-Cu sheets
2.3 Microstructure and texture characterization
The particle distributions of the specimens were investigated using backscattered electron (BSE) imaging in the field emission Hitachi SU 5000 scanning electron microscope (SEM) equipped with an X-ray energy dispersive spectrometer (EDS).
Grain structure and texture were also revealed in the Hitachi SU 5000 SEM equipped with an Oxford Instruments AZtec HKL electron back- scattered diffraction (EBSD) system. EBSD specimens were prepared by grinding, mechanical polishing first, and then electro-polishing with a solution of 6 vol.% perchloric acid and 94 vol.% ethanol at -20 °C for 8 s. Different scanning step sizes were adopted for different states, in accordance with the grain size. The EBSD results including the inverse pole figure (IPF) maps, the texture component maps, the grain size distributions, the misorientation angle distributions, and the recrystallization fractions were analyzed through the HKL Channel 5 software. For the recrystallization fraction calculation, the minimum misorientation angle to define a subgrain was set to be 2°, and the minimum misorientation angle to define a grain was set to be 10°. Orientation distribution functions (ODFs) were calculated using the harmonic series expansion method (orthorhombic sample symmetry, coefficient in surface spherical harmonic functions lmax=22, Gaussian spread = 5°). The ODFs were represented as plots of constant f2 sections with isointensity contours in Euler space defined by the Euler angles f1, Φ and f2.
Grains in cold-rolled metals are always relatively large. Therefore, it is difficult to ensure the reliability of ODF obtained from EBSD technology due to the limited observation area. In the present study, the cold rolling texture was measured at one quarter the thickness of the cold-rolled Al-Mg-Si-Cu alloy sheet according to a Panalytical X’pert MRD X-ray diffractometer equipped with a Co radiation source. An enough large sample with dimensions of 20 mm (rolling direction) × 15 mm (transverse direction) was prepared for pole figure measurement. The three pole figures consisting of (111), (200), and (220) were measured using the Schulz back-reflection method. Further, the ODFs and the specific texture volume fractions were calculated by the JTEX software.
3 Results
3.1 Mechanical properties
Table 2 shows the mechanical properties of the four T4P-treated alloy sheets in three different directions. As can be seen, they all exhibit mechanical property anisotropies due to the fact that their mechanical properties are different in various directions. Among the four alloy sheets, sheet A has the highest mechanical property anisotropy, and the mechanical property anisotropy comparison among other alloy sheets mainly depends on the specific mechanical property index.
Table 2 Mechanical properties of T4P-treated Al-Mg-Si-Cu alloy sheets
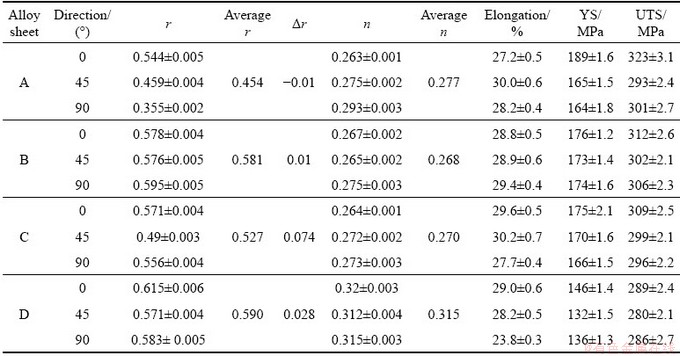
As heating rate increases, the yield strength and ultimate tensile strength decrease first, and then remain constant, and finally decrease in 0° direction, while they increase first, and then remain constant, and finally decrease in 45° and 90° directions. Besides, average r value increases first, and then decreases, and increases finally; average n value decreases first, and then increases. Overall, sheet A possesses the lowest average r value, whereas sheet D possesses the highest average r value, but the lowest strength and ductility.
Normally, the deep drawability evaluation is more reasonable by limiting drawing ratio (LDR) characterization, which depends on not only r value but also n value. It could be expressed as follows [17]:
LDR= (1)
(1)
where f represents the factor of drawing efficiency, and when f is 0.9, the calculated results should be more dependable. Therefore, the LDR values of the four alloy sheets can be acquired by substituting average  and n values to Eq. (1). The calculated LDR values of sheets A, B, C and D are 1.95, 2.00, 1.98 and 2.00, respectively. It can be found that sheet A possesses the lowest deep drawability, while sheets B and D possess the highest deep drawability. It is worth noting that sheets B and D have the same deep drawability. In fact, their r values are very close, but their n values are very different. Accordingly, it can also be reflected that deep drawability is strongly dependent on r value.
3.2 Cold rolling and solid solution micro- structure
Figure 1(a) presents the IPF map of the cold rolled Al-Mg-Si-Cu alloy obtained by EBSD analysis. It can be found that the microstructure is mainly composed of the elongated bands along the rolling direction, with thickness less than 10 μm. In addition, different thicknesses of the elongated bands reveal the non-uniform microstructure. Notably, there are also some fine equiaxed grains in the alloy matrix, which may be attributable to the fact that large rolling force makes some elongated bands broken. As presented in Fig. 1(b), lots of low angle grain boundaries (LAGBs) and some high angle grain boundaries (HAGBs) can be found, which accords with the grain structure. The particle distribution obtained from BSE detector is revealed in Fig. 2(a). As can be observed, many particles with different colors and shapes distribute in the alloy matrix. Based on EDS analysis (as shown in Figs. 2(b)-(e)), four types of particles with a bimodal size distribution can be identified. Large white particles of several micrometers are Al(Fe,Mn)Si, the black globular particles less than 1 μm are Mg2Si, the grey cubic particles are Si, and the dark lath-shaped particles are Q phase (Al1.9Mg4.1Si3.3Cu). The particle identifications have also been proven in the previous studies [7,10]. Besides, a large number of fine white particles are Al(Fe,Mn)Si, which were developed by the fragmentation of coarse Al(Fe,Mn)Si particles during cold rolling.
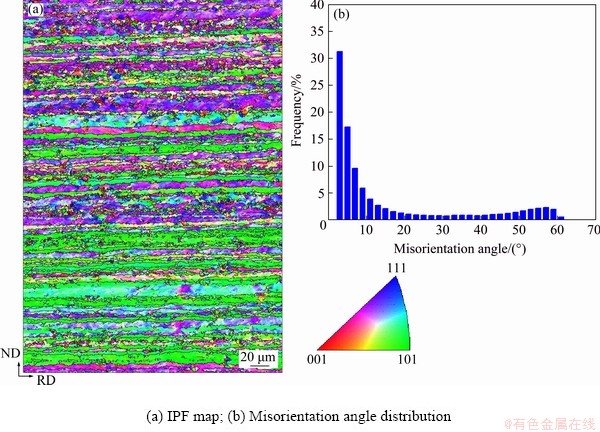
Fig. 1 EBSD analysis of cold-rolled Al-Mg-Si-Cu alloy
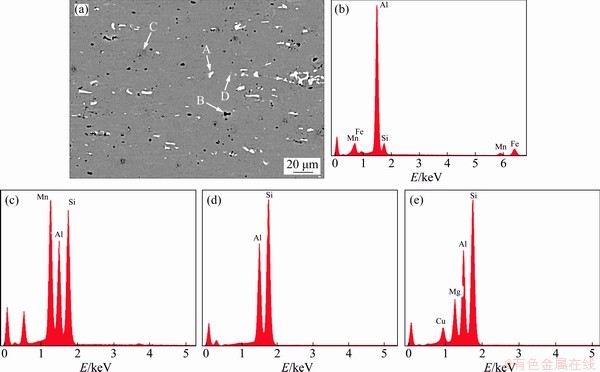
Fig. 2 SEM image of cold-rolled Al-Mg-Si-Cu alloy showing particle distribution (a) and EDS spectra of particles (b-e) in particles A, B, C and D, respectively
After different solid solution treatments, the four alloy sheets exhibit different recrystallization microstructures, as shown in Fig. 3. Sheet A is composed of the elongated grains with the aspect ratio of 3:1, while sheets B, C and D are composed of numerous equiaxed grains and few slightly elongated grains. In spite of the similar grain structure among sheets B, C and D, their grain sizes are different. Figure 4 shows the grain size distributions of the four alloy sheets. It seems that their grain size distributions are different. Among the alloy sheets, the grain size distributions of sheets A and D are the most scattered and the most concentrated, respectively, implying sheet A possesses the most non-uniform microstructure and sheet D possesses the most uniform microstructure. According to size statistics of the grains, it can be concluded that average grain sizes of sheets A, B, C and D are 40, 24, 29 and 21 μm, respectively. Those results indicate that although high solution heating rate is beneficial to developing fine equiaxed grain structure, the relationship between heating rate and grain size is not monotonic. As the heating rate increases, the average grain size decreases first, and then increases, and finally decreases.
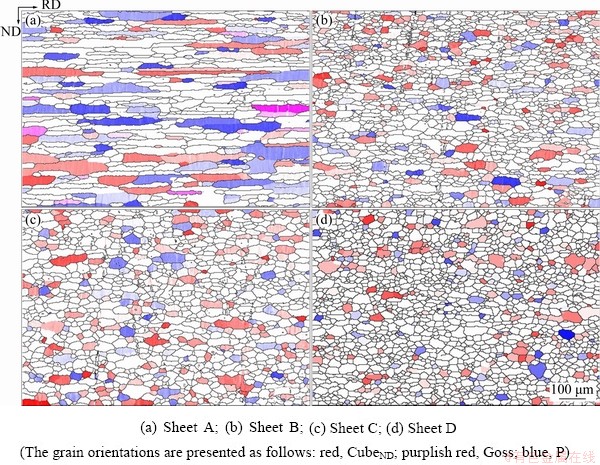
Fig. 3 Texture component maps of different solution-treated Al-Mg-Si-Cu alloy sheets
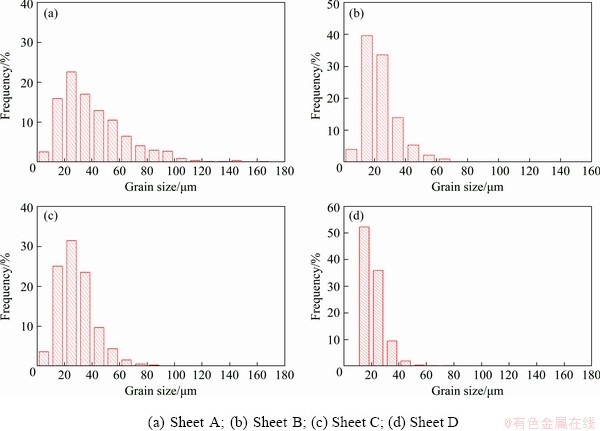
Fig. 4 Grain size distributions of different solution-treated Al-Mg-Si-Cu alloy sheets
Figure 5 presents SEM images showing the particle distributions of the solution-treated alloy sheets. Clearly, a large number of particles distributing in the previous cold-rolled alloy sheets vanish, indicating that the soluble particles were gradually dissolved during the solution treatments. The remaining particles are mainly non-soluble white Al(Fe,Mn)Si particles. However, sheet D also possesses some black Mg2Si particles besides the Al(Fe,Mn)Si particles, which may be attributed to the very short solution procedure.
3.3 Cold rolling and solid solution texture
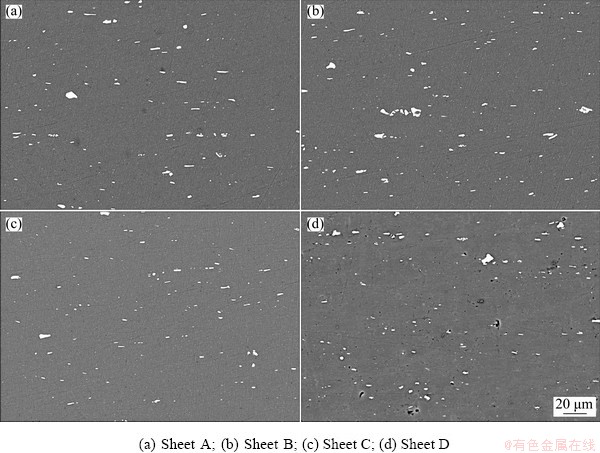
Fig. 5 SEM images showing particle distributions of different solution-treated alloy sheets
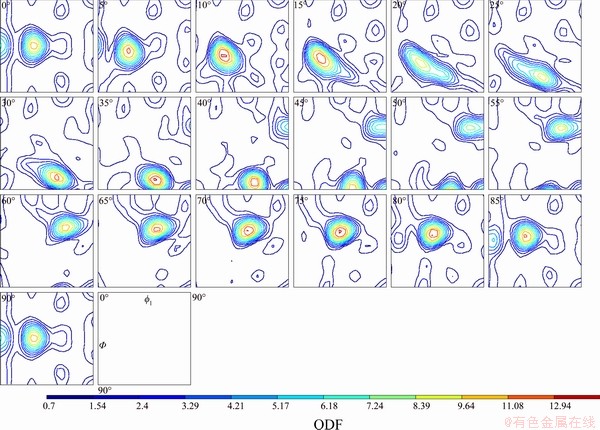
Fig. 6 ODFs of cold-rolled Al-Mg-Si-Cu alloy sheet
Figure 6 illustrates the ODFs of the cold-rolled Al-Mg-Si-Cu alloy sheet. A typical deformation β fiber can be observed, which runs from Brass {011}<211> through S to Copper{112}<111>. The typical Brass, S and Copper orientations possess the intensities of 7.0, 11.3 and 10.6, respectively. Their corresponding volume fractions are 8.7%, 11.8% and 12.8%, respectively. Additionally, a lower intensity of Goss orientation can be seen, the intensity and volume fraction are 6.6 and 4.4%, respectively.
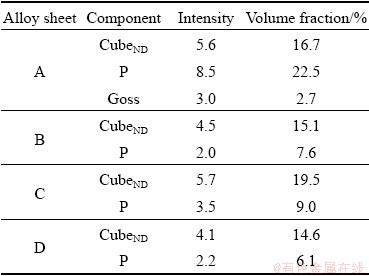
The recrystallization textures of different solution-treated Al-Mg-Si-Cu alloy sheets are revealed in Fig. 7. As can be observed, the completely new textures have replaced the cold rolling textures, and they almost possess the same recrystallization texture components including CubeND and P orientations with different intensities. In addition, sheet A also has the additional Goss orientation. The spatial distributions of grains within 15° of their ideal orientation are shown in Fig. 3. The grain color will gradually fade with the increase of angle deviation from the ideal orientation. The grains with different orientations are very clear. The detailed texture intensities and volume fractions of the alloy sheets are summarized in Table 3. Obviously, sheet A possesses the strongest texture, and sheet D possesses the weakest texture. The relationship between heating rate and texture is also not monotonic. As the heating rate increases, the texture becomes weak first, and then strong, and finally weak.
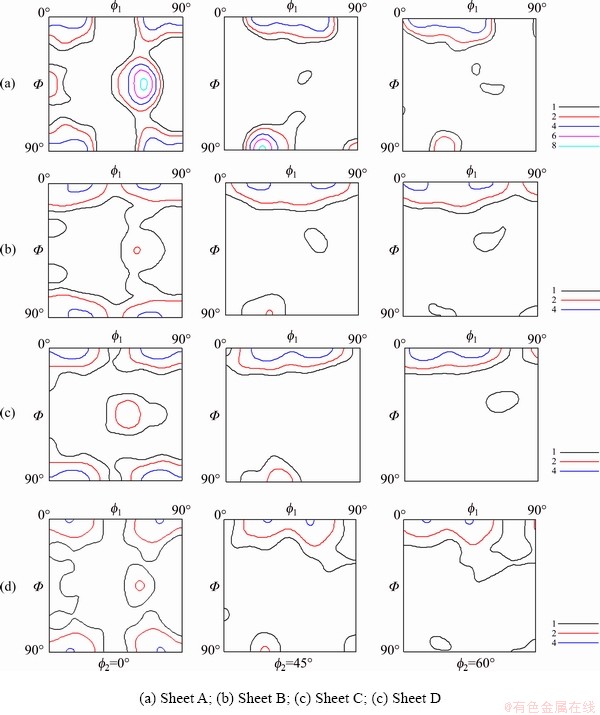
Fig. 7 Recrystallization textures of solution-treated alloy sheets
Table 3 Intensities and volume fractions of recrystallization texture components in four alloy sheets
Considering the complexity of the relationship among heating rate, microstructure and texture, it is essential to investigate the microstructure and texture evolutions during different solution treatments for understanding the related mechanism in depth. Since sheet D was solution-treated in a salt bath with a very high heating rate, the microstructure and texture are likely to change at a very high temperature. In other words, the microstructure and texture evolutions during intermediate process could be ignored. Consequently, the microstructure and texture evolutions are mainly focused on sheets A, B and C.
3.4 Microstructure and texture evolutions during solution treatment
Figure 8 shows the microstructure evolution of sheet A at a heating rate of 20 °C/h during the solution treatment. It is clear that the grain structures are different in different solution treatment stages. The mixed microstructure of many elongated bands and some fine equiaxed grains at 300 °C is similar to the cold rolling microstructure, indicating that recrystallization is difficult to occur at this temperature, and recovery is prevailed. Both microstructures at 400 and 500 °C are mainly composed of the elongated grains. Both grain size and grain aspect ratio at 500 °C are smaller than those at 400 °C, which could be attributed to further migration of grain boundaries. Obviously, the recrystallization fraction is related to the temperature. The recrystallization fractions of the alloy sheets at 300, 400 and 500 °C listed in Table 4 also prove that 300 °C is difficult to result in the recrystallization, and the recrystallization at 500 °C is almost complete.
The microstructure evolution of sheet B at a heating rate of 40 °C/h during the solution treatment is revealed in Fig. 9. As can be seen, the microstructure evolution of sheet B is similar to that of sheet A. Likewise, the recrystallization fractions of the sheets at 300, 400 and 500 °C are summarized in Table 4. It exhibits the trend that recrystallization fraction gradually increases with the increase of the temperature.
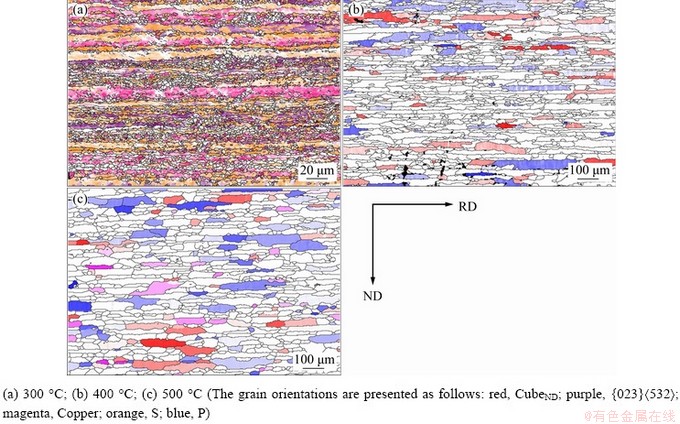
Fig. 8 Microstructure evolution of solution-treated alloy sheet A at heating rate of 20 °C/h and different temperatures
Table 4 Recrystallization fractions of Al-Mg-Si-Cu alloy sheets during solution treatment at different temperatures
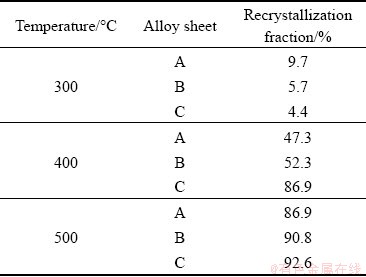
Figure 10 illustrates the microstructure evolution of sheet C at a heating rate of 80 °C/h during the solution treatment. Similar to sheets A and B, sheet C also exhibits the almost same microstructure evolution. The recrystallization fraction result (as shown in Table 4) also confirms that the increase of temperature can accelerate recrystallization.
Considering the microstructure at 555 °C, the microstructure evolutions are as follows: the microstructure of sheet A could transform from the elongated bands to the elongated grains, while the microstructures of sheets B and C may transform from the elongated bands to the elongated grains first, and then transform to equiaxed grains during the solution treatments. Nevertheless, different heating rates may result in the microstructures with different sizes at the same temperature. It seems that the higher heating rate may lead to coarser grain structure at the same temperature.
Unexpectedly, although sheets B and C possess elongated grain structure at 500 °C, they possess equiaxed grain structure at 555 °C. In comparison with sheet A, maybe the alloy sheets B and C with higher heating rate have higher stored energy to make some very fine grains replace the elongated grains with high energy, and thus decrease free energy. The in-situ analysis may be necessary to understand the recrystallization process in depth in future.
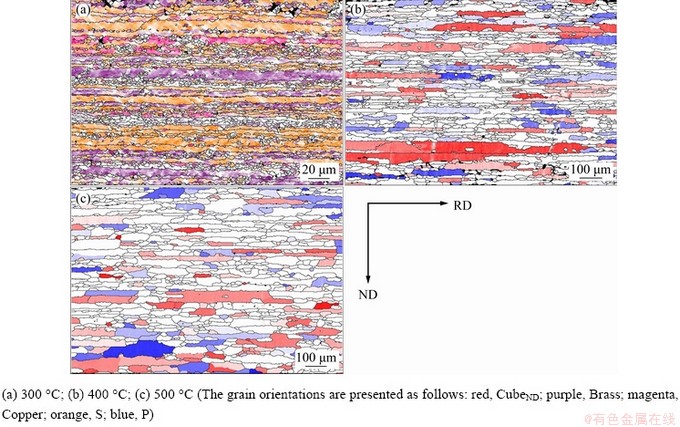
Fig. 9 Microstructure evolution of solution-treated alloy sheet B at heating rate of 40 °C/h and different temperatures
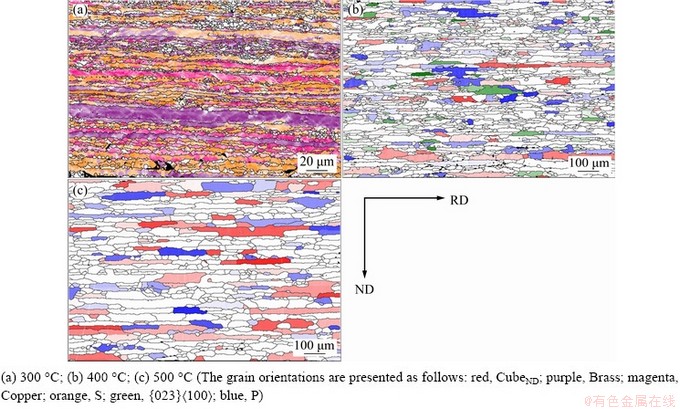
Fig. 10 Microstructure evolution of solution-treated alloy sheet C at heating rate of 80 °C/h and different temperatures
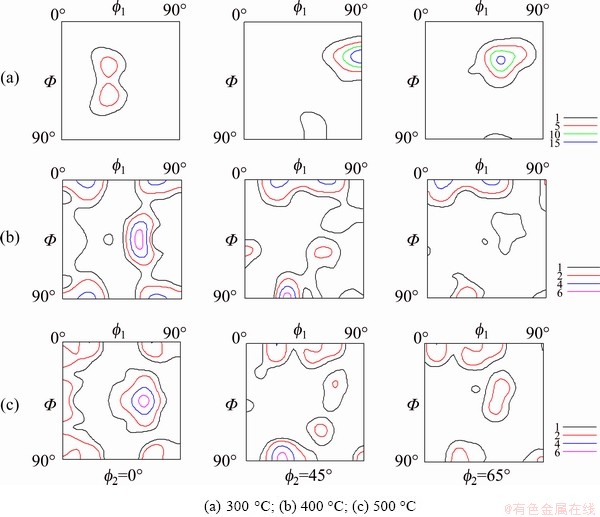
Fig. 11 Texture evolution of cold-rolled alloy sheet A during solution treatment at different temperatures
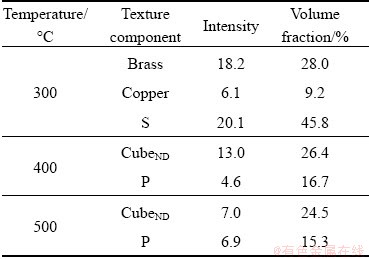
The texture evolution of cold-rolled sheet A during the solution treatment is presented in Fig. 11. It can be seen that the texture has great changes with the increase of temperature. Sheet A at 300 °C consists of {023}<532>, Copper and S orientations,which are similar to the cold rolling texture components, indicating that the microstructure is still mainly composed of the deformation microstructure. Interestingly, the uncommon {023}<532> orientation is similar to Brass orientation, which may be attributable to the fact that some Brass oriented grains have started to transform. Sheet A at 400 °C mainly includes the typical recrystallization texture of CubeND and P orientations, suggesting that recrystallization is dominant. However, the recrystallization fraction is only 47.3% as listed in Table 4, implying that the deformation grains are not stable, and have transformed to other oriented subgrains as a result of the recovery. Sheet A at 500 °C mainly consist of CubeND, P and Goss orientations. Different oriented grains can be clearly observed in Fig. 8. The intensities and volume fractions of the specific texture components in sheet A are summarized in Table 5. Clearly, the texture may transform from the deformation texture to recrystallization texture during solution treatment, the texture variation is significant from 300 to 400 °C, and the texture variation is slight from 400 to 500 °C.
Table 5 Intensities and volume fractions of texture components in sheet A during solution treatment at different temperatures
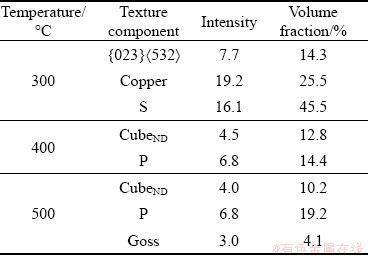
Figure 12 shows the texture evolution of sheet B. As can be seen, sheet B includes the strong Brass, Copper and S orientations at 300 °C, and moderate CubeND and P orientations at 400 and 500 °C. Specific oriented grains are also revealed in Fig. 9. Their intensities and volume fraction are shown in Table 6.
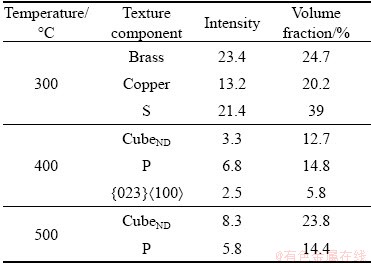
Generally, the texture variation of sheet B is similar to that of sheet A. Sheet C has almost the same texture evolution, as presented in Fig. 13. Weak {023}<100> orientation appears at 400 °C, while it disappears at 500 °C. This reflects that the {023}<100> oriented grains are replaced by other oriented grains due to their disadvantage in growth. Specific oriented grains and the corresponding intensities and volume fractions are revealed in Fig. 10 and Table 7. They show the texture evolution very directly.
Even regarding the final recrystallization texture at 555 °C, it is also shown that heating rate cannot affect texture evolution a lot, and only has somewhat effect on texture volume fraction, indicating that their recrystallization behavior is similar. Even though sheet A possesses different grain shapes, it also exhibits the same texture components with the highest volume fraction at 555 °C.
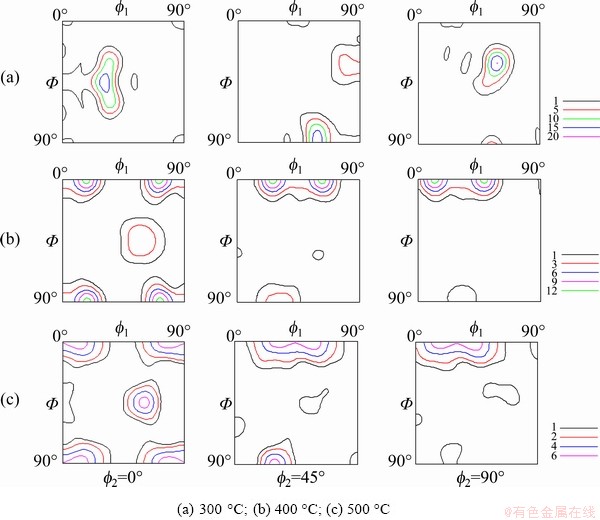
Fig. 12 Texture evolution of cold-rolled alloy sheet B during solution treatment at different temperatures
Table 6 Intensities and volume fractions of texture components in sheet B during solution treatment at different temperatures
4 Discussion
4.1 Relationship between heating rate and recrystallization microstructure
In the present study, the experimental results show the exact relationship between heating rate and recrystallization microstructure of which the grain size decreases first, and then increases, and finally decreases with the increase of heating rate.
The variation may be related to the recrystallization process, which should be considered from deformation stored energy and precipitation.
As is known, precipitation is easy to occur in two-phase aluminum alloys during the solution treatment [18-20]. Obviously, the lower the heating rate is, the more the precipitates are. In addition, the precipitation could be significantly affected by the temperature. Since the three alloy sheets should exhibit similar precipitation behavior, we chose sheet C to investigate the particle distribution evolution during solution treatment, as shown in Fig. 14. The white particles are mainly non-soluble Al(Fe,Mn)Si besides few Q phases. The black soluble particles increase first, and then decrease, implying that the soluble particles have started to dissolve before 500 °C. The precipitates distributed along normal direction (ND) are more as a result of the direction of rolling force, so they may retard the movement of grain boundaries along ND. The low heating rate means enough time for a strong precipitation, which is beneficial to developing the elongated grains.
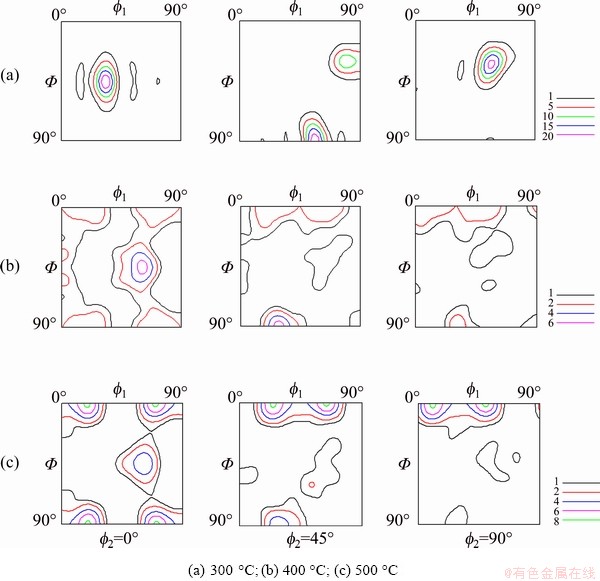
Fig. 13 Texture evolution of cold-rolled alloy sheet C during solution treatment at different temperatures
Table 7 Intensities and volume fractions of texture components in sheet C during solution treatment at different temperatures
Before recrystallization, some deformation stored energy is always consumed during recovery stage. There is no doubt that as the heating rate increases, less deformation stored energy can be consumed, and thus the energy for recrystallization is more. The alloy sheet at the lowest heating rate has the least deformation stored energy to recrystallize because of the consumption during recovery stage.
The strongest precipitation and the least stored energy finally result in the elongated grain structure in sheet A. On the contrary, other sheets have weaker precipitation and more stored energy, which results in the development of equiaxed grain structure. Notably, grain sizes (D) of sheets B, C and D have the following relationship: DC>DB>DD, which has non-monotonic relation with heating rate. Since sheet D was solution-treated in a salt bath, there is no enough time to make the grains grow, thus it has the finest grain structure. Compared with sheet B, although sheet C has less time to make the grains grow, the higher stored energy for recrystallization is also favorable for the growth of grains, and the combined effect makes sheet C possess larger grain size.
4.2 Relationship between heating rate and texture
Different from a single phase aluminum alloy, the recrystallization texture of particle-containing aluminum alloys is complicated and significantly affected by particles. Some literatures [20-22] have reported: large particles with sizes larger than 1 μm can accelerate recrystallization according to particle stimulated nucleation (PSN) mechanism and are likely to develop weak texture including CubeND and P orientations; small particles with the sizes smaller than 1 μm can delay recrystallization using Zener drag, and tend to develop Cube, CubeRD {310}<001>, R{124}<211>, Q{013}<231> and Goss orientations at other nucleation sites such as Cube band, grain boundary and shear band.
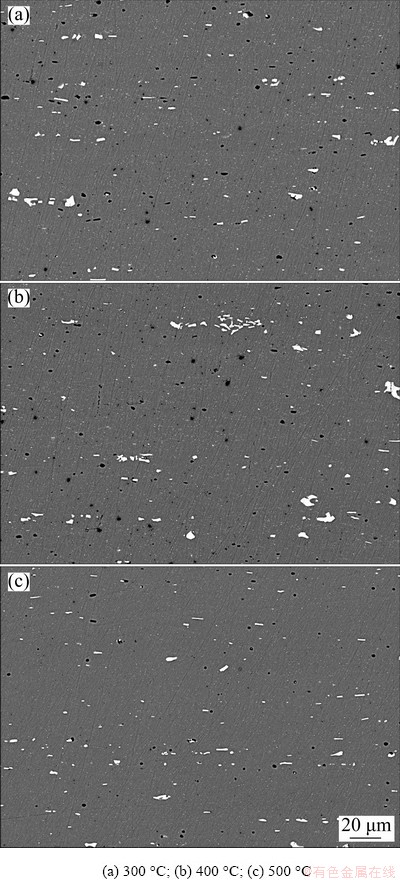
Fig. 14 Particle distribution evolution of cold-rolled alloy sheet C during solution treatment at different temperatures
In the presence of a bimodal particle distribution of large constituent particles and small dispersoids in Al-Mg-Si-Cu alloy, the competition between large particles and small particles may determine the recrystallization mechanism. The texture results show that CubeND and P are the main orientations independent of heating rate, indicating that PSN is the main recrystallization mechanism for the four alloy sheets. Coarse grain structure is considered to play an important role in texture strengthening [23-25]. The EBSD results show that the grain sizes (D) of sheets A, B, C and D have the following relationship: DA>DC>DB>DD, which should result in the texture volume fraction (V) relationship of VA>VC>VB>VD. This is in accord with the experimental results shown in Table 3. Therefore, the relationship between heating rate and texture may be determined by the microstructure.
4.3 Relationship between heating rate and mechanical properties
As previously presented, the mechanical properties are significantly affected by heating rate, especially the yield strength and r value. Interestingly, among the four alloy sheets, sheet A solution-treated at the lowest heating rate has the highest yield strength in 0° direction and lowest average r value, while sheet D solution-treated at the highest heating rate possesses the lowest yield strength and highest average r value. This phenomenon may be ascribed to the microstructure and texture.
It is generally accepted that the strengthening of 6xxx series aluminum alloys mainly comes from the following contributions [26]: the grain boundary strengthening, solid solution strengthening, dislocation strengthening and precipitate strengthening. In the present study, the dislocation strengthening can be ignored since the T4P-treated alloy sheets are in recrystallization state, therefore, only other three other strengthening mechanisms are considered. The grain sizes of sheets A, B, C and D have the relationship of DA>DC>DB>DD, implying (△σGB)D>(△σGB)B> (△σGB)C>(△σGB)A, where △σGB represents strength contribution from grain boundary. During the solution treatment, sheets A, B and C have enough time to dissolve the soluble particles completely, whereas sheet D cannot dissolve the soluble particles completely, as proven in Fig. 5. Therefore, the solid solution strengthening relationship is as follows: (△σSS)A=(△σSS)B=(△σSS)C>(△σSS)D, where △σSS represents strength contribution from solid solution. Even in the T4P state, the solid solution strengthening relationship may remain unchanged because of the limited development of metastable precipitates. The precipitate strengthening may be the combined contribution of remaining precipitates and metastable precipitates. From Fig. 5, it can be found that the remaining precipitates in sheet D are the most, which can also affect the yield strength, and the precipitate strengthening relationship resulted from remaining precipitates is as follows: (△σRP)D>(△σRP)A=(△σRP)B=(△σRP)C, where △σRP represents strength contribution from remaining precipitates. Besides, strength is also significantly affected by metastable precipitate such as clusters, GP zone or β" formed during T4P treatment. Solute atoms are the least available in sheet D with the fastest heating rate for precipitation during T4P treatment, which is supported by the observation of the soluble particles (Mg2Si and Q), as presented in Fig. 5. This means the least metastable precipitates formed during T4P treatment in sheet D. Therefore, the precipitation strengthening relationship resulted from metastable precipitates is as follows: (△σMP)A= (△σMP)B=(△σMP)C>(△σMP)D, where △σMP represents strength contribution from metastable precipitates. In addition, since metal follows along rolling direction, the mechanical properties along this direction are always higher. Accordingly, the comprehensive effect of grain boundary strengthening, solid solution strengthening, precipitate strengthening and grain shape leads to the final yield strength relationship.
As is well known, average r value is mainly dependent on the specific texture component and volume fraction, and weak texture is favorable for the improvement of r value. From Table 3, it can be seen that all the alloy sheets possess the same texture components. Accordingly, the average r value may be determined by texture volume fraction. Clearly, the texture volume faction relationship is as follows: VA>VC>VB>VD. Therefore, we can conclude the relationship of rD>rB>rC>rA, which is in agreement with the results shown in Table 2.
The effects of heating rate on microstructure, texture and mechanical properties in the present study are clearly different from those in the previous investigations. The previous investigations reported that high heating rate is always beneficial to refining grain structure, weakening texture, and improving r value. However, the present study shows that improving heating rate does not always follow the regulation, which is closely related to the recrystallization behavior. As long as the heating rate is appropriate to complete the recrystallization exactly, the fine equiaxed grain structure, weak texture and high r value will be obtained.
5 Conclusions
(1) The relationship between heating rate and mechanical properties is complicated and not monotonic. As heating rate increases, the yield strength and ultimate tensile strength in 0° direction decrease first, and then almost remain unchanged, and finally decrease, while in 45° and 90° directions they increase first, and then almost remain unchanged, and finally decrease. Additionally, average r value increases first, and then decreases, and finally increases; average n value decreases first, and then increases.
(2) The recrystallization microstructure is significantly influenced by the heating rate. Very slow heating rate can result in the formation of elongated grain structure, whereas improving heating rate is favorable for the formation of equiaxed grain structure. As the heating rate increases, the average grain size decreases first, and then increases, and finally decreases.
(3) The final recrystallization texture is closely related to the heating rate. Although sheets A, B, C and D almost possess the same texture components mainly including CubeND and P orientations, the intensities and volume fractions are different. With the increase of heating rate, the texture becomes weak first, and then strong, and finally weak.
(4) Heating rate does not affect microstructure and texture evolutions obviously. The sheet with the lowest heating rate could develop elongated bands first, and then elongated grains; while other sheets with higher heating rates may develop the elongated bands first, and then elongated grains, and finally equiaxed grains. All the textures may transform from the deformation texture to the recrystallization texture with the increase of temperature. Their texture components are similar, but the intensity and volume fraction have somewhat differences.
(5) Improving heating rate is not always beneficial to developing fine equiaxed grain structure, weak texture and high average r value. An exactly complete recrystallization according to heating rate controlling may obtain the optimal microstructure, texture and mechanical properties.
Acknowledgments
The authors are grateful for the financial supports from the Science Challenge Project (TZ2018001), the State Key Laboratory of Advanced Metals and Materials University of Science and Technology Beijing, China (2019-Z02), the National Natural Science Foundation of China (52075272), the Key Laboratory of Impact and Safety Engineering, Ministry of Education, Ningbo University, China (CJ201912), the Ningbo Natural Science Foundation, China (2018A610174), and the K. C. Wong Magna Fund from Ningbo University, China.
References
[1] HIRSCH J, Al-SAMMAN T. Superior light metals by texture engineering: Optimized aluminum and magnesium alloys for automotive applications [J]. Acta Materialia, 2013, 61: 818-843.
[2] SAKUNDARINI N, TAHA Z, ABDUL-RASHID S H, GHAZILA R A R. Optimal multi-material selection for lightweight design of automotive body assembly incorporating recyclability [J]. Materials & Design, 2013, 50: 846-857.
[3] HIRSCH J. Recent development in aluminium for automotive applications [J]. Transactions of Nonferrous Metals Society of China, 2014, 24: 1995-2002.
[4] ROWE J. Advanced materials in automotive engineering [M]. Cambridge: Woodhead Publishing Limited, 2012.
[5] DAVIES G. Materials for automobile bodies [M]. Oxford: Elsevier, 2003.
[6] ENGLER O, HIRSCH J. Texture control by thermo- mechanical processing of AA6xxx Al-Mg-Si sheet alloys for automotive applications―A review [J]. Materials Science and Engineering A, 2002, 336: 249-262.
[7] WANG X F, GUO M X, ZHANG Y, XING H, LI Y, LUO J R, ZHANG J S, ZHUANG L Z. The dependence of microstructure, texture evolution and mechanical properties of Al-Mg-Si-Cu alloy sheet on final cold rolling deformation [J]. Journal of Alloys and Compounds, 2016, 657: 906-916.
[8] SIDOR J, MIROUX A, PETROV R, KESTENS L. Microstructural and crystallographic aspects of conventional and asymmetric rolling processes [J]. Acta Materialia, 2008, 56: 2495-2507.
[9] HAMAD K, YANG H W, KO Y G. Interpretation of annealing texture changes of severely deformed Al-Mg-Si alloy [J]. Journal of Alloys and Compounds, 2016, 687: 300-305.
[10] WANG X F, GUO M X, CHAPUIS A, LUO J R, ZHANG J S, ZHUANG L Z. Effect of solution time on microstructure, texture and mechanical properties of Al-Mg-Si-Cu alloys [J]. Materials Science and Engineering A, 2015, 644: 137-151.
[11] WANG X F, GUO M X, LUO J R, XIE C, WANG Y G, ZHANG J S, ZHUANG L Z. Effect of intermediate annealing time on microstructure, texture and mechanical properties of Al-Mg-Si-Cu alloy [J]. Materials Characterization, 2018, 142: 309-320.
[12] WANG X F, GUO M X, CAO L Y, LUO J R, ZHANG J S, ZHUANG L Z. Effect of heating rate on mechanical property, microstructure and texture evolution of Al-Mg-Si-Cu alloy during solution treatment [J]. Materials Science and Engineering A, 2015, 621: 8-17.
[13] GAO G J, HE C, LI Y, LI J D, WANG Z D, MISRA R D K. Influence of different solution methods on microstructure, precipitation behavior and mechanical properties of Al-Mg-Si alloy [J]. Transactions of Nonferrous Metals Society of China, 2018, 28: 839-847.
[14] LIU W C, LI Z, MAN C S. Effect of heating rate on the microstructure and texture of continuous cast AA 3105 aluminum alloy [J]. Materials Science and Engineering A, 2008, 478: 173-180.
[15] XIA S L, MA M, ZHANG J X, WANG W X, LIU W C. Effect of heating rate on the microstructure, texture and tensile properties of continuous cast AA5083 aluminum alloy [J]. Materials Science and Engineering A, 2014, 609: 168-176.
[16] SHEN F H, WANG B, YI D Q, LIU H Q, TANG C, SHOU W B. Effect of heating rate during solid-solution treatment on microstructure and fatigue properties of AA2524 T3 Al-Cu-Mg sheet [J]. Materials & Design, 2016, 104: 116-125.
[17] LEU D. Prediction of the limiting drawing ratio and the maximum drawing load in cup-drawing [J]. International Journal of Machine Tools & Manufacture, 1997, 37: 201-213.
[18] HUMPHREYS F J, HATHERLY M. Recrystallization and related annealing phenomena [M]. 2nd ed. Amsterdam: Elsevier, 2004.
[19] DOHERTY R D. Recrystallization and texture [J]. Progress in Materials Science, 1997, 42: 39-58.
[20] HUANG K, ZHANG K, MARTHINSEN K, LOGE R E. Controlling grain structure and texture in Al-Mn from the competition between precipitation and recrystallization [J]. Acta Materialia, 2017, 141: 360-373.
[21] ENGLER O. On the influence of dispersoids on the particle stimulated nucleation of recrystallization in an Al-Fe-Si model alloy [J]. Materials Science Forum, 1998, 273-275: 483-488.
[22] BENNETT T A, PETROV R H, KESTENS L A I. Effect of particles on texture banding in an aluminium alloy [J]. Scripta Materialia, 2010, 62: 78-81.
[23] TOMIDA T. A new process to develop (100) texture in silicon steel sheets [J]. Journal of Materials Engineering and Performance, 1996, 5: 316-322.
[24] MAO W. Formation of recrystallization cube texture in high purity face-centered cubic metal sheets [J]. Journal of Materials Engineering and Performance, 1999, 8: 556-560.
[25] WANG X F, SHI T Y, JIANG Z X, CHEN W, GUO M X, ZHANG J S, ZHUANG L Z, WANG Y G. Relationship among grain size, texture and mechanical properties of aluminums with different particle distributions [J]. Materials Science and Engineering A, 2019, 753: 122-134.
[26] ESMAEILI S, LLOYD D J, POOLE W J. A yield strength model for the Al-Mg-Si-Cu alloy AA6111 [J]. Acta Materialia, 2003, 51: 2243-2257.
汪小锋1,郭明星2,彭文飞1,王永刚1,庄林忠2
1. 宁波大学 冲击与安全工程教育部重点实验室,宁波 315211;
2. 北京科技大学 新金属材料国家重点实验室,北京 100083
摘 要:通过拉伸试验、扫描电镜、X射线衍射仪和EBSD技术研究固溶加热速率与Al-Mg-Si-Cu合金力学性能、显微组织及织构的关系。实验结果表明,固溶加热速率与力学性能、显微组织及织构的关系是非单调的。随着加热速率的增加,强度变化取决于拉伸方向;加工硬化指数n先减小,后增加;塑性应变比r值先增加,后减小,最后又增加。加热速率对合金最终显微组织和织构有一定影响。随着加热速率的增加,显微组织由拉长晶粒组织转变为等轴晶粒组织,平均晶粒尺寸呈先减小、然后增加、最后再减小的趋势。随着加热速率的增加,尽管织构组分如CubeND{001}<310>和P{011}<122>基本无变化,但织构密度和体积分数呈现先减小、后增加、最后减小的趋势。加热速率对显微组织和织构演变的影响较小。提高加热速率并不总是有利于形成细小的等轴晶粒组织、弱织构以及较大的平均r值,这些与合金的再结晶行为有关。
关键词:Al-Mg-Si-Cu合金;固溶加热速率;力学性能;显微组织;织构
(Edited by Wei-ping CHEN)
Corresponding author: Xiao-feng WANG, Tel: +86-574-87600302, E-mail: wangxiaofeng@nbu.edu.cn;
Lin-zhong ZHUANG, Tel: +86-10-82375845, E-mail: linzhongzhuang@yahoo.com
DOI: 10.1016/S1003-6326(20)65477-2
1003-6326/ 2021 The Nonferrous Metals Society of China. Published by Elsevier B.V. & Science Press

