J. Cent. South Univ. (2016) 23: 324-332
DOI: 10.1007/s11771-016-3077-1

Nitrogen removal by three types of bioretention columns under wetting and drying regimes
TANG Ning-yuan(唐宁远), LI Tian(李田)
State Key Labortory of Pollution Control and Resource Reuse (Tongji University), Shanghai 200092, China
 Central South University Press and Springer-Verlag Berlin Heidelberg 2016
Abstract: The behaviors of inorganic nitrogen species in three types of bioretention columns under an intermittently wetting regime were investigated. The mean NH4+—N, NO3-—N and total N (TN) removal efficiencies for the conventional bioretention column (Col. T1) are 71%, 1% and 41%, for layered bioretention column with less permeable soil layer (Col.T2) the efficiencies are 83%, 84% and 82%, and for the bioretention column with submerged zone (Col. T3) the values are 63%, 31% and 53%, respectively. The best nitrogen removal is obtained using Col. T2 with relatively low infiltration rate. Adsorption during runoff dosing and nitrification during the drying period are the primary NH4+—N removal pathways. Less permeable soil and the elevated outlet promote the formation of anoxic conditions. 30%–70% of NO3-—N applied to columns in a single repetition is denitrified during the draining period, suggesting that the draining period is an important timeframe for the removal of NO3-—N. Infiltration rate controls the contact time with media during the draining periods, greatly influencing the NO3-—N removal effects. Bioretention systems with infiltration rate ranging from 3 to 7 cm/h have a great potential to remove NO3-—N.
Key words: runoff; NH4+—N; NO3-—N; bioretention; infiltration rate
1 Introduction
With rapid urbanization, surface runoff from impervious areas has been identified as a significant source of pollution for receiving waterbodies. Recent studies of runoff from urban impervious areas have shown higher levels of nitrogen in China than in developed countries [1-2]. The alleviation of nutrient loads from impervious areas is receiving great concern.
Bioretention systems are relatively new for best management practices designed to remove pollutants from stormwater runoff. Bioretention systems are effective at removing sediments, heavy metals, phosphorus, hydrocarbons, and pathogenic bacteria from stormwater [3-7]. Despite the promising performance with other pollutants, several studies reported poor removal of NO3-—N [8-9]. To enhance the NO3-—N removal performance of bioretention systems, research efforts have mainly focused on the development of different design configurations and soil media composition. KIM et al [10] observed that creating a submerged zone through elevating the outlet increased the removal of NO3-—N from synthetic runoff. DIETZ and CLAUSEN [11] demonstrated similar results in their field-scale study. HSIEH et al [12] reported that extending the contact time by using less permeable soil improved NO3-—N removal, and CHO et al [13] reported similar results. The removal of nitrogen species in a bioretention system involves complex reactions. Few studies have reported the transformation processes of inorganic nitrogen species during and between the draining periods. Existing studies also lack information on the factors that influence transformation of nitrogen species in the bioretention system.
In this work, three bioretention systems are used: 1) a well-established conventional bioretention column; 2) a layered bioretention column as proposed by HSIEH et al [12]; and 3) a bioretention column with a submerged zone. The aims of this study are to investigate the behaviors of inorganic nitrogen species in bioretention columns and to provide recommendations for the application of bioretention systems for nitrogen removal from stormwater runoff.
2 Materials and methods
2.1 Preparation of materials
The media packed in columns were a mixture of top soil, sand and hard woodchips. Topsoil was collected from the greenbelt of Shanghai, China, air-dried and sieved (2 mm). Both sand and woodchips were obtained from a local building materials market. The physical and chemical characteristics of soil and sand were analyzed [14], as shown in Table 1, where d10 and d60 are the effective sizes of the soil particles, the masses of which account for 10% and 60% of the total mass of soil particles, and U is the uniformity coefficient. Both the width and the length of the thin woodchips ranged from 2 to 5 mm, and the carbon to nitrogen ratio determined by a Macro Elemental Analyser (Vario Macro, Elementar Analysensysteme GmbH, Germany) was up to 257.
2.2 Bioretention column settings
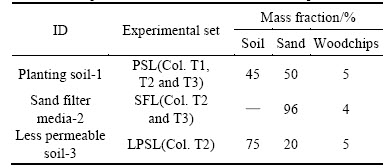
Three columns were constructed from a 15 cm- diameter polyvinyl chloride (PVC) pipe. Each column had 80–85 cm media, 10 cm drainage layer (DL) and 15 cm of extended ponding depth. All the columns were covered by 5 cm gravel mulch to prevent the scour from pouring water. One Iris tectorum was planted in each column. The conventional bioretention column (Fig. 1(a)), with a single layer of media (planting soil layer (PSL)), was designated as T1. The layered bioretention column with less permeable soil layer (LPSL) was designated as T2 (Fig. 1(b)) and consisted of the PSL, a sand filter layer (SFL) and the LPSL. The bioretention column with the submerged zone designated as T3 (Fig. 1(c)) was composed of the PSL and SFL. Planting soil was used to support vegetation. The sand filter media promoted filtration. Less permeable soil at the bottom allowed runoff storage in the SFL above. The compositions and the mass ratio of media for each component are shown in Table 2.
Several sets of perforated PVC pipe enveloped with filter fabric, with a diameter of 2.5 cm, were installed laterally in the media for collection of water quality samples at different depths. The upper set was 35 cm below the media surface in each column. For Col. T2, the middle set was placed 70 cm below the media surface. The lower set was installed in the DL. For Col. T3, the drainage pipe in the DL was extended into a vertical riser pipe with 30 cm height (Fig. 1(c)) through which the submerged zone of 30 cm depth was created.
The moisture content and redox potential at different depths of media were measured by using related sensors or probes. The installation sites of sensors or probes for each column were different because of the differences of media compositions and design configurations. The range of aerobic and anoxic zones in columns was estimated through redox potential measurements. The residual water volume from the aerobic and anoxic zones was calculated based on the soil moisture content measurements and the estimated range of the aerobic and anoxic zones.
Table 1 Physical and chemical characteristics of soil and sand
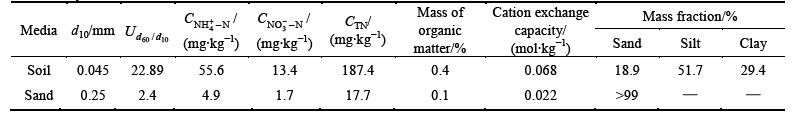
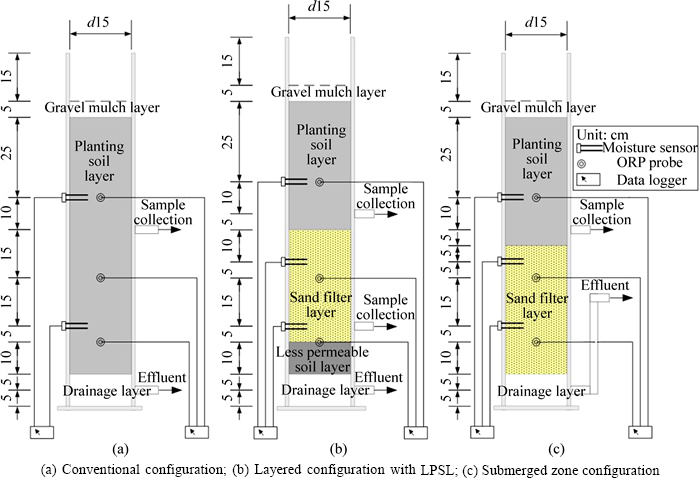
Fig. 1 Schematic diagram of three types of bioretention columns:
Table 2 Composition and mass ratio of media components
Soil moisture sensors (HoBoTM S-SMC-M005, Onset Computer Corporation, USA) were installed laterally at depths of 25 cm and 65 cm for Col. T1; 25 cm, 50 cm and 70 cm for Col. T2; and 25 cm, 45 cm and 65 cm for Col. T3, respectively. These sensors were programmed to record data continuously at 1 h intervals, with the data stored on a data logger (HoboTM U30-NRC, Onset Computer Corporation, USA).
Redox potential probes (FJA-6, Nanjing Chuan-Di Instrument & Equipment Co., Ltd., China) were installed at depths of 25 cm, 50 cm and 70 cm for Cols. T1 and T3, and 25 cm, 55 cm and 75 cm for Col. T2. Redox potential measurements were taken at 1 h intervals and stored using a data logger (CD-1, Nanjing Chuan-Di Instrument & Equipment Co., Ltd., China).
2.3 Semi-synthetic runoff
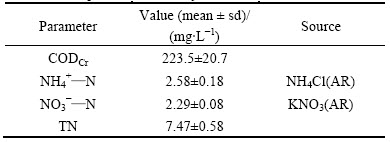
Semi-synthetic runoff was introduced to columns during the experimental period. The semi-synthetic runoff was obtained by using tap water to wash a road surface and collecting the runoff downhill from where it was applied. Before introduction to the columns, the concentrations of nitrogen species in semi-synthetic runoff (Table 3) were analyzed and adjusted based on the typical pollutant concentrations in traffic road runoff reported by LIN et al [1] where CODCr is the chemical oxygen demand by potassium dichromate method.
Table 3 Composition of semi-synthetic runoff
2.4 Bioretention column operation
The semi-synthetic runoff was applied to each column, maintaining 15 cm water head above the mulch surface for 6 h, largely in accordance with HSIEH et al [12].
Semi-synthetic runoff was reapplied eight times to each column, after 5 to 7 (typically 6) days drying between applications. The bottom ports were always open, while other ports were open solely for sampling. Effluent volume was measured every hour to calculate the outflow rate. Samples from bottom ports and lateral ports were collected every hour during the runoff dosing period and at 2–5 h intervals after the runoff dosing to better understand the transformation of nitrogen species during the draining period.
2.5 Analytical methods
Water samples were analyzed for NH4+—N, NO3-—N and total N (TN). Samples were filtered using a 0.45 μm membrane filter (Hach, USA) to analyze NH4+—N and NO3-—N. The analysis employed standard methods [15] and was completed within 24 h after sampling.
2.6 Data analysis
The event mean concentration of the outflows and removal efficiencies of pollutants were calculated using the method of RUSCIANO and OBROPTA [16].
During the draining period, residual water from anoxic zone and aerobic zone and newly applied semi-synthetic runoff flowed out successively. The NO3-—N in residual water from the anoxic zone was mainly removed via denitrification during the drying period. Part of the NO3-—N in residual water from the aerobic zone and newly applied semi-synthetic runoff was denitrified during the draining period. The transport pattern of NO3-—N in columns was close to plug flow under the high influent hydraulic loading in this work. The removed masses of NO3-—N in residual water from the anoxic zone (Maz) and during the draining period (Mdp) in a single repetition were estimated by Eqs. (1) and (2), respectively.
 (1)
(1)

 (2)
(2)
where C0 is the influent NO3-—N concentration, Ci is the effluent NO3-—N concentration associated with period i, Vaerobic and Vanoxic are the residual water volumes from the aerobic zone and anoxic zone, respectively, Vi is the volume of effluent during period i, and n is the total number of measurements taken during the draining period. The effluent before the period m was completely composed of the residual water from the anoxic zone, and m was the 2nd, 6th and 3rd period for Cols. T1, T2 and T3, respectively. The effluent before the period k was primarily composed of the residual water remaining in the media from the previous event. In this work, k was the 3rd, 10th and 5th period for Cols. T1, T2 and T3, respectively. Because the effluent during period k – 1 possessed almost the same contact time in the column as that during the period k because of the similar outflow rate, it was assumed that the change in NO3-—N concentration in effluent comprising residual water from the aerobic zone during the period k – 1 was equal to that in the effluent during period k.
However, in practice, more NO3-—N in the residual water from the aerobic zone is removed because of the higher NO3-—N concentration in the residual water than in the newly applied semi-synthetic runoff. Besides, based on the low NO3-—N concentration in the last sample of effluent, it is assumed that part of NO3-—N in the residual water from the anoxic zone is removed during the draining period, only part of NO3-—N in the residual water from the anoxic zone is removed after drainage.
3 Results
3.1 Hydraulic performances
Infiltration rates in bioretention columns are controlled by the original media, design configurations and subsequent captured sediments on the media surface, which influences the pollutant removal performance through contact time. The infiltration rate of Col. T2 is lower than Cols. T1 and T3 because it has less permeable soil at the bottom, which results in a sudden increase in hydraulic resistance between the SFL and LPSL. Compared with Col.T1, Col. T3 has a relatively low total head difference because of the elevated outlet, so the infiltration rate of Col. T3 is lower than that of Col. T1.
Outflow rates of the three columns peak relatively quickly under the high influent hydraulic loading (Fig. 2(a)). After the runoff dosing, the cumulative effluent volumes for Cols. T1, T2, and T3 are 60%–70%, 25%–35% and 55%–65% of the total effluent volume, respectively (Fig. 2(b)). Cols. T1 and T3 discharge more effluent volume in comparison with Col. T2 because of the relatively rapid infiltration of these columns.
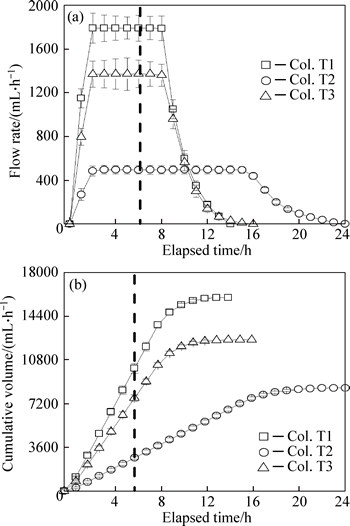
Fig. 2 Outflow rates (a) and cumulative volumes (b) of outflows (n=8) (Dashed line represents end of influent, symbols and error bars represent mean ± one standard deviation)
3.2 Ammonium removal
All three columns effectively remove NH4+—N from the semi-synthetic runoff (Table 5). Because of the relatively low infiltration in this column, Col. T2 provides sufficient contact time with soil particles for removal of influent NH4+—N. Another reason for the good NH4+—N removal in Col. T2 might be that a lower mass of NH4+—N is imported to Col. T2 compared with the other columns. The anoxic/anaerobic environment (Fig. 3(f)) in the submerged zone of Col. T3 restrains
nitrification during the drying period. The NH4+—N concentration of the initial two samples (Fig. 4(a)) for Col. T3 is higher than that of the last samples from previous events. Dissimilatory nitrate reduction might be a possible explanation for the relatively high initial effluent NH4+—N concentrations because of the highly anoxic conditions and available carbon substrates in the submerged zone of Col. T3 [17]. Less influent NH4+—N is removed by Col. T3 compared with Col. T1.
Table 5 Mean nitrogen inflow and outflow concentrations and mean removal (n=8, values are mean ± sd)
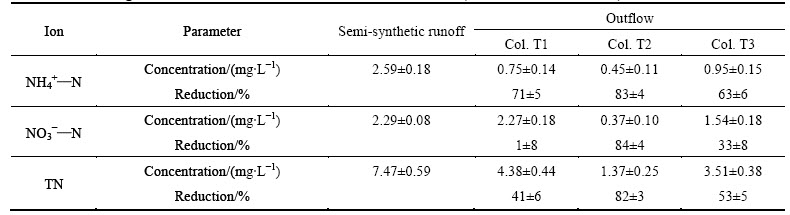
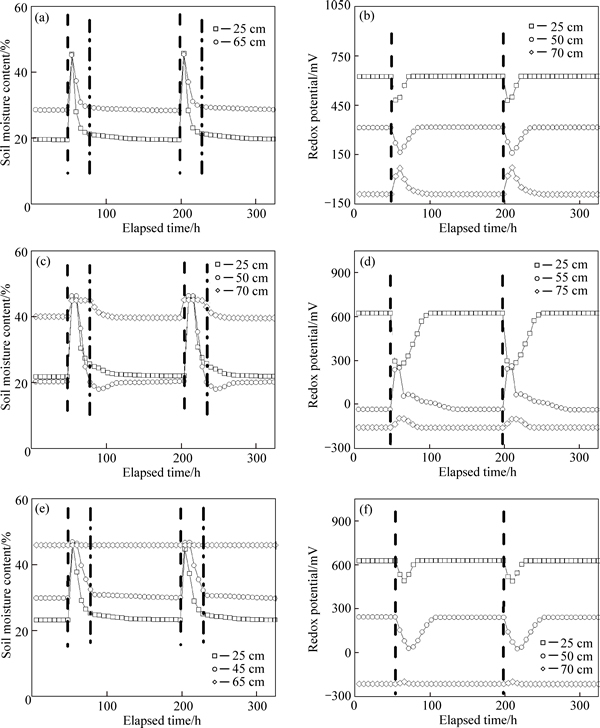
Fig. 3 Soil moisture content (a, c, e) and redox potential (b, d, f) at different depths of outflows: (a), (b) Col. T1; (c), (d) Col. T2; (e), (f) Col. T3 for two successive repetitions (Dashed line represents beginning of runoff dosing, and dashed dotted line represents 1 day after runoff dosing)
The effluent NH4+—N concentrations at different depths are shown in Fig. 4(b). Most of the NH4+—N removal occurs within the PSL. Compared with Col.T2, only 55%–65% of influent NH4+—N is removed by the PSL of Cols. T1 and T3 because of the higher mass of NH4+—N introduced. Effluent levels show 70%–80% reduction in NH4+—N removal from the PSL of Col. T2. The media below the PSL remove less than 10% of the influent NH4+—N.
Influent NH4+—N is able to be absorbed by soil particles because of the relatively high silt/clay contents and high CEC (Table 1) during the runoff dosing. After the runoff dosing, oxygen from the atmosphere would betransferred to the drying sites, and the Eh at 25 cm depth in Cols. T1, T2 and T3 (Figs. 3(b), (d) and (f)) approaches to 630 mV. The conditions in the PSL of columns are conducive to high rates of nitrification. Captured NH4+—N would be readily transformed into NO3-—N during the drying period. As expected, NO3-—N is washed out in the first several samples from the PSL for all three columns (Fig. 4(c)). HATT et al [9] and CHO et al [13] reported the similar phenomenons in their laboratory studies, respectively. The NO3-—N flushing in Cols. T1 and T3 finishes quickly compared with Col. T2, because of the relatively fast infiltration in these columns. The effluent NO3-—N levels approach to or are lower than the influent levels with time, and the generation of NO3-—N during the draining period is not significant, indicating that the nitrification in columns mostly takes place during the drying period, consistent with similar findings reported by HSIEH et al [12] and CHO et al [13].
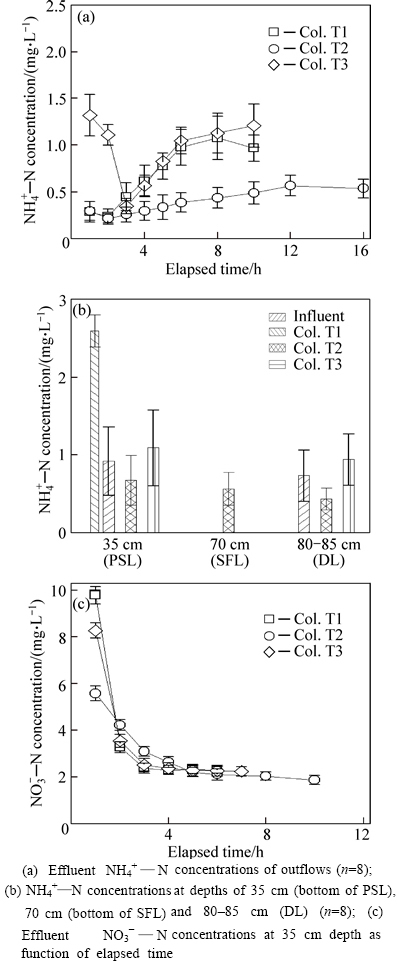
Fig. 4 NH4+—N concentrations: (Symbols and error bars represent mean ± one standard deviation)
3.3 Nitrate removal
Col. T2 removes the most NO3-—N from runoff compared with the other columns (Table 5). Compared with Col. T2, more inflow volume is applied to Cols. T1 and T3, which reduces the ratio of low NO3-—N concentration residual water volume to the total effluent volume. Col. T2 also extends the contact time of influent in column because of the relatively low infiltration rate of this column. Col. T3 with the submerged zone removes more influent NO3-—N compared with Col. T1.
NO3-—N removal processes are different among three types of bioretention columns because of the different media compositions and design configurations. During the repetitions, a large amount of water is held in media in the bottom part of Col. T1 (55–80 cm away from the media surface) because of the relatively low evapotranspiration loss. The volumetric water content at 65 cm media depth 1 day after the runoff dosing (Fig. 3(a)) is 29.7%, which is much lower than the saturated volumetric water content of the media (44%–46%). The active aerobic decomposition of the organic matter from the woodchips might have reduced oxygen availability, creating anoxic conditions within that region [18]. It is also demonstrated that Eh at 70 cm media depth (Fig. 3(b)) is below 50 mV during the repetitions.
For Col. T2, because of the LPSL, a large amount of water is perched in the SFL after drainage. The volumetric water content at 70 cm media depth 1 day after the runoff dosing (Fig. 3(c)) is approximately 44.9%. Oxygen transfer is impeded, promoting the formation of anoxic conditions. Eh at 75 cm media depth (Fig. 3(d)) is between –160 and –110 mV during the repetitions. In addition, although the volumetric water content at 50 cm media depth is approximately 21% during the drying period, the Eh at 55 cm media depth is negative. This unexpected result might be attributed to the media in the monitored location, which contains more woodchips than that in other regions of the SFL because of inhomogeneous mixing, so the active aerobic decomposition of the organic matter from the woodchips creates anoxic conditions.
Because of the elevated outlet in Col. T3, the media in the submerged zone and adjacent region maintain high volumetric water content during repetitions. The volumetric water contents (Fig. 3(e)) at 45 and 65 cm media depths 1 day after the runoff dosing are up to 33.4% and 45.9%, respectively, which creates anoxic conditions by impeding the diffusion of oxygen. The Eh at 50 cm and 70 cm media depths (Fig. 3(f)) ranges from 0 to 250 mV and –225 to –200 mV, respectively, during the repetitions.
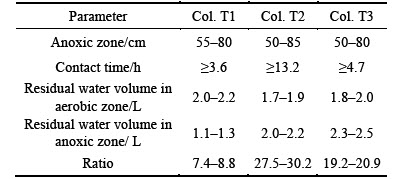
Denitrification reactions occur in soils at Eh values between 200 and 500 mV [19]. Based on Eh (Figs. 3(b), (d) and (f)) measurements at different depths of the media for each column, the estimated range of the anoxic zone for each column is presented in Table 6, where contact times are calculated by dividing the length of media by the maximal pore-water velocity. The effective porosity of media is equal to 0.45 based on measurements of moisture content of different media used in columns; ratios present the ratio of the residual water volume in anoxic zone to the total effluent volume. Anoxic conditions exist in the three columns, and the woodchips provide available carbon substrates for complete denitrification; therefore, the contact time in the column becomes an important factor influencing NO3-—N removal during the draining period. The contact time in the column during the draining period is primarily controlled by the infiltration rate and the inflow hydraulic loading. Among the three columns, Col. T2 has the longest contact time, followed by Col. T3. After drainage, the residual water in the anoxic zone is remained for sufficient time for allowing denitrification to occur during the drying period.
Table 6 Range of anoxic zone, contact time in column, volumes of water held in aerobic and anoxic zones, and ratio of residual water from anoxic zone to total effluent volume for each column
The variations in effluent NO3-—N concentrations during the draining period are shown in Fig. 5. At the beginning of each runoff dosing, the low NO3-—N concentrations in residual water from the anoxic zone flow out first, where NO3-—N is effectively removed via denitrification during the drying period. Similar phenomenons are also observed by KIM et al [10], HSIEH et al [12] and CHO et al [13] in their laboratory studies, respectively. Table 6 presents the cumulative volume of this residual effluent for each column. After draining of water held in the anoxic zone, the effluent NO3-—N concentrations from the three columns increase to peaks as the residual water descends from the PSL, which is consistent with the results reported by HSIEH et al [12], CHO et al [13] and DAVIS et al [20]. Because the NO3-—N generated through nitrification of captured NH4+—N in PSL during the drying period is washed out, the peak of effluent NO3-—N concentration is much higher than in the influent for Cols. T1 and T3 but not for Col. T2. Because of the relatively low infiltration rate for Col. T2, most of the NO3-—N flushed from the PSL is removed through denitrification during the draining period. Subsequently, with the newly applied runoff draining down, the effluent NO3-—N concentrations for each column decrease, indicating that some of the influent NO3-—N is removed during the draining period.
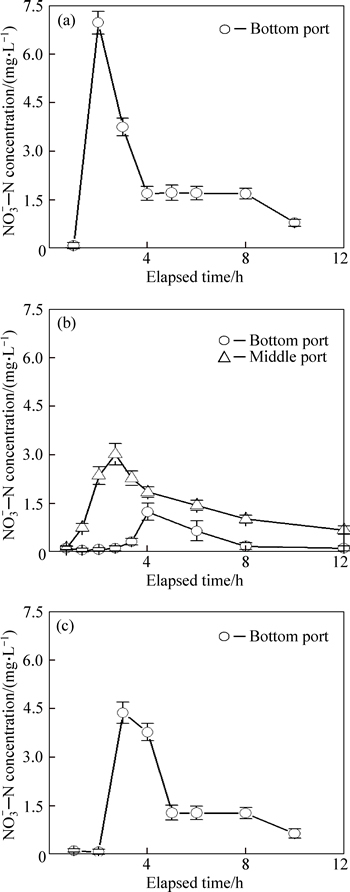
Fig. 5 Effluent NO3-—N concentrations as function of elapsed time for Cols T1 (a), T2 (b) and T3 (c) (Symbols and error bars represent mean ± one standard deviation)
4 Disscusion
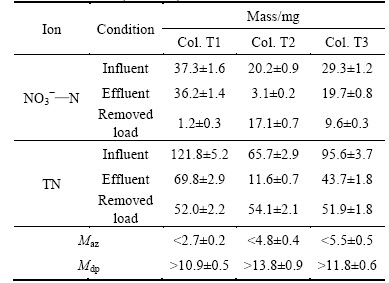
Estimation of the mass of NO3-—N denitrified in residual water from the anoxic zone and during the draining period in a single repetition is shown in Table 7. The estimation of denitrified NO3-—N mass during the draining period for Cols. T1 and T3 approaches to that for Col. T2 because of the relatively high amount of newly applies runoff in the effluent. Although the estimation of the mass of NO3-—N denitrified during the draining period is less than that in practice, it is still equivalent to 30%–70% of the applied NO3-—N in a single repetition. This result suggests that the draining period plays an important role for the removal of NO3-—N. However, in published studies, researchers almost ignore the denitrification behavior happened during the draining period, paying more attentions on investigating the denitrification behavior happened during the drying period [10–13, 21]. Therefore, the main time frame for the denitrification removal of NO3-—N should be further invesitigated through quantizing the mass of NO3-—N denitrified during the drying period.
The removal of nitrogen in a bioretention system involves various biochemical pathways. In a single repetition, the estimation of the mass of NO3-—N denitrified in residual water from the anoxic zone and during the draining period for three columns is approximately equivalent to 25%–40% of the removed TN, suggesting that denitrification plays an important pathway for the removal of TN. In this work, the effects of planting are not significant because of low plant mass planted. Nitrogen captured in media might be transformed into recalcitrant organic matter [11, 22] or removed via concurrent nitrification/denitrification [11] during the drying period. These mentioned removal pathways of nitrogen would be an area of further investigation and quantization in future study.
Table 7 Total input and output of NO3-—N and TN and estimation of NO3-—N mass denitrified in residual water from anoxic zone and during draining period in a single repetition for three columns (mean±sd)
Infiltration rate controls contact time with media, greatly influencing the removal of NO3-—N. Based on the results in repetitions, the infiltrate rate of bioretention systems is suitable to be selected between 3 cm/h and 7 cm/h. In actual conditions, low infiltration rate may sometimes compromise the overall runoff volume treatment capacity of bioretention systems, Therefore, maximising the area of a bioretention systems relative to its catchment size is recommended, where space is available. If only limited space is available, bioretention systems with relatively high inflitration rate should be considered.
5 Conclusions
1) The conventional bioretention column (Col. T1), layered bioretention column with LPSL (Col. T2) and bioretention column with submerged zone (Col. T3) remove nitrogen species to different extents. The mean NH4+—N, NO3-—N and TN removal efficiencies are 71%, 1% and 41%, 83%, 84% and 82%, and 63%, 33% and 53%, respectively, for Cols. T1, T2 and T3. Col. T2 has a relatively low infiltration rate and removes more nitrogen than the other columns. Col. T3 with the submerged zone removes more NO3-—N and less NH4+—N than the conventional Col. T1.
2) All three columns create aerobic conditions in the top layer where captured NH4+—N is converted to NO3-—N via nitrification. Adsorption during the runoff dosing and nitrification during the subsequent drying period removes NH4+—N.
3) Less permeable soil and the elevate outlet promoted the formation of anoxic conditions. In a single repetition, 30%–70% of the NO3-—N applied to columns is removed during the draining period, suggesting that the draining period time greatly affects the removal of NO3-—N. The mass of NO3-—N dentrified in residual water from the anoxic zone and during the draining period is approximately equivalent to 25%–40% of the removed TN. Except for denitrification, the other removal pathways of nitrogen would be an area of further invesigation and quantization in future study.
4) Bioretention systems with infiltration rate ranging from 3 cm/h to 7 cm/h have great potential to remove NO3-—N. In actual conditions, if only limited space is available, it is suitable to select the relatively high infiltration rate, or else the lower infiltration rate should be considered.
References
[1] LIN Li-feng, LI Tian, LI He. Characteristics of surface runoff pollution of Shanghai urban area [J]. Environmental Science, 2007, 28(7): 1430-1434. (in Chinese)
[2] TAYLOR G D, FLETCHER T D, WONG T H F, BREEN P F, DUNCAN H P. Nitrogen composition in urban runoff-implications for stormwater management [J]. Water Research, 2005, 39 (10): 1982-1989.
[3] LI Houng, DAVIS A P. Urban particle capture in bioretention media I: Laboratory and field Studies [J]. J Environmental Engineering, 2008, 134(6): 409-418.
[4] LI Houng, DAVIS A P. Heavy metal capture and accumulation in bioretention media [J]. Environmental Science & Technology, 2008, 42(14): 5247-5253.
[5] HSIEH C H, DAVIS A P, NEEDELMAN B A. Bioretention column studies of phosphorus removal from urban stormwater runoff [J]. Water Environment Research, 2007, 79(2): 177-184.
[6] DIBLASI C J, LI Houng, DAVIS A P, GHOSH U. Removal and fate of polycyclic aromatic hydrocarbon pollutants in an urban stormwater bioretention facility [J]. Environmental Science & Technology, 2009, 43(2): 494-502.
[7] MOHANTY S K, TORKELSON A A, DODD H, NELSON K L, BOEHM A B. Engineering solutions to improve the removal of fecal indicator bacteria by bioinfiltration systems during intermittent flow of stormwater [J]. Environmental Science & Technology, 2013, 47(19): 10791-10798.
[8] DAVIS A P, MOHAMMAD S, HIMANSHU S, CHRISTIE M. Laboratory study of biological retention for urban stormwater management [J]. Water Environment Research, 2001, 73(1): 5-14.
[9] HATT B E, FLETCHER T D, DELETIC A. Hydraulic and pollutant removal performance of stormwater filters under variable wetting and drying regimes [J]. Water Science & Technology, 2007, 56(12): 11-19.
[10] KIM H, SEAGREN E A, DAVIS A P. Engineered bioretention for removal of nitrate from stormwater runoff [J]. Water Environment Research, 2003, 75 (4): 355-367.
[11] DIETZ M E, CLAUSEN J C. Saturation to improve pollutants retention in a rain garden [J]. Environmental Science & Technology, 2006, 40(4): 1335-1340.
[12] HSIEH C H, DAVIS A P, NEEDELMAN B A. Nitrogen removal from urban stormwater runoff through layered bioretention columns [J]. Water Environment Research, 2007, 79(12): 2404-2411.
[13] CHO K W, SONG K G, CHO J W, KIM T G, AHN K H. Removal of nitrogen by a layered soil infiltration system during intermittent storm events [J]. Chemosphere, 2009, 76(5): 690-696.
[14] CARTER M R, GREGORICH E G. Soil sampling and methods of analysis [M]. Boca Raton: CRC Press, 2007.
[15] APHA, AWWA, WPCF. Standard methods for the examination of water and wastewater [S]. Washington D. C: American Public Health Association, 1999.
[16] RUSCIANO G M, OBROPTA C C. Bioretention column study: Fecal coliform and total suspended solids reductions [J]. Transactions of the ASABE, 2007, 50(4): 1261-1269.
[17] TIEDJE J M, SEXSTONE A J, MYROLD D D, ROBINSON J A. Denitrification: Ecological niches, competition, and survival [J]. Antonie van. Leeuwenhoek, 1982, 48(6): 569-583.
[18] NIELSEN L P, CHRISTENSEN P B, REVSBECH N P,  J. Denitrification and oxygen respiration in biofilms studied with a microsensor for nitrous oxide and oxygen [J]. Microbial Ecology, 1990, 19(1): 63–72.
[19] BOHN H L, MCNEAL B L, O’CONNOR, G A. Soil chemistry [M]. New York: Wiley, 2001: 80-140.
[20] DAVIS A P, MOHAMMAD S, HIMANSHU S, CHRISTIE M. Water quality improvement through bioretention media: nitrogen and phosphorus removal [J]. Water Environment Research, 2006, 78(3): 284-293.
[21] YANG H, MCCOY E L, GREWAL P S, DICK W A. Dissolved nutrients and atrazine removal by column-scale monophasic and biphasic rain garden model systems [J]. Chemosphere, 2010, 80(8): 929-934.
[22] LUCAS W C, GREENWAY M. Hydraulic response and nitrogen retention in bioretention mesocosms with regulated outlets: part II- nitrogen retention [J]. Water Environment Research, 2011, 83(8): 703-713.
(Edited by FANG Jing-hua)
Foundation item: Project(2011ZX07303-002) supported by National Water Pollution Control and Management Technology Major Program, China
Received date: 2015-03-09; Accepted date: 2015-10-12
Corresponding author: LI Tian, Professor, PhD; Tel: +86-21-65988421; E-mail: tianli@tongji.edu.cn

