�ȴ���״̬��6063���Ͻ�����������������Ӱ��
��Դ�ڿ����й���ɫ����ѧ��(Ӣ�İ�)2017���7��
�������ߣ���־�� ������ �� ������ ���� ����
����ҳ�룺1498 - 1506
�ؼ��ʣ�6063���Ͻ���������������״̬������������������ǿ�ȣ���ֵ����
Key words��6063 aluminum alloy; three-point bending; heat treatment conditions; bending characteristic; yield ratio; simulation
ժ Ҫ���о�����̬����ȻʱЧ��T6̬�Ȳ�ͬ�ȴ���״̬��6063���Ͻ�����������������Ϊ��Ӱ�졣��������ͷ������ϵķ���ϵͳ�����˱����غɡ������ڽǡ������뾶�Ͱ��ı仯���ɡ��о�����������ȴ���״̬����Ӱ�����Ͻ��ĵ���������������T6̬���Ͻ����������θ�Ϊ���ң��������صľֲ����Ρ���ȻʱЧ����̬���Ͻ����������ξ�����չ�������뾶����T6̬���Ͻ�������غ������ȻʱЧ̬��֮������̬��С��ж�غ�T6̬�Ļص�����ȻʱЧ����̬�Ĵ�ʱЧʱ��������ص��;ֲ��������������������ԡ��������������Ϊ��Ҫ���ɲ��ϵ�����ǿ�ȡ���ǿ�Ⱥ����Բ�ƫ��ϵ�����ۺ�Ӱ��Ľ����
Abstract: Bending deformation behaviors of solution treated (ST), natural aged (NA) and T6 tempered 6063 aluminum alloy sheets were studied by three-point bending tests. The changes of bending force, interior angle, bending radius and sheet thickness in the fillet region were analyzed by experimental measurements and numerical simulations. The results showed that the bending characteristics were strongly dependent on the heat treatment conditions. The T6 alloy sheets were bent more sharply and local plastic deformation occurred severely in the fillet region. However, the ST and NA alloy sheets exhibited relatively uniform bending deformation and large bending radius. The bending force of T6 alloy was the highest, followed by the NA alloy and that of the ST alloy was minimum. After unloading, as compared with the ST and NA alloys, the springback of T6 alloys was markedly larger. The aging time showed a positive sensitivity on the springback and non-uniform bending deformability. The bending characteristics are attributed to the combined effects of yield strength, yield ratio and coefficient of neutral layer.
Trans. Nonferrous Met. Soc. China 27(2017) 1498-1506
Zhi-wen LIU1,2, Luo-xing LI1,2, Jie YI1, Shi-kang LI1,2, Zhen-hu WANG1,2, Guan WANG1,3
1. State Key Laboratory of Advanced Design and Manufacture for Vehicle Body, Hunan University, Changsha 410082, China;
2. College of Mechanical and Vehicle Engineering, Hunan University, Changsha 410082, China;
3. College of Mechanical Engineering, Ningxia University, Yinchuan 750021, China
Received 26 October 2016; accepted 8 March 2017
Abstract: Bending deformation behaviors of solution treated (ST), natural aged (NA) and T6 tempered 6063 aluminum alloy sheets were studied by three-point bending tests. The changes of bending force, interior angle, bending radius and sheet thickness in the fillet region were analyzed by experimental measurements and numerical simulations. The results showed that the bending characteristics were strongly dependent on the heat treatment conditions. The T6 alloy sheets were bent more sharply and local plastic deformation occurred severely in the fillet region. However, the ST and NA alloy sheets exhibited relatively uniform bending deformation and large bending radius. The bending force of T6 alloy was the highest, followed by the NA alloy and that of the ST alloy was minimum. After unloading, as compared with the ST and NA alloys, the springback of T6 alloys was markedly larger. The aging time showed a positive sensitivity on the springback and non-uniform bending deformability. The bending characteristics are attributed to the combined effects of yield strength, yield ratio and coefficient of neutral layer.
Key words: 6063 aluminum alloy; three-point bending; heat treatment conditions; bending characteristic; yield ratio; simulation
1 Introduction
Lightweight is the most effective way to realize the sustainable development of transportation industry. Aluminum alloys are suitable for weight-reduced components due to their high specific strength, stiffness and energy absorption [1]. Taking into account of the requirements in terms of aerodynamics, structural mechanics and aesthetics, automotive components are generally needed to bend into a certain curvature [2], which proposes a higher requirement on the quality of curved products. Aluminum alloys usually suffer from poor bendability at room temperature, accompanying with defects such as springback, cross-section deformation and surface cracking [3-5], which severely restricts the application of aluminum alloys in the automobile body. The microstructures, mechanical properties exhibited by aluminum alloys are significantly influenced by the hot treatments [6,7]. Accordingly, their bendability would also change.
SNILSBERG et al [8] proposed that extruded aluminum alloys profiles showed better bendability when the bending axis was parallel to the extrusion direction, than that when it was perpendicular to the extrusion direction, for both recrystallized and fibrous grain morphologies. ZHANG et al [9] investigated the effects of material parameters on springback of 5052 aluminium alloy sections with hat profile in rotary draw bending. LIU et al [10,11] investigated the springback behaviors of the age-hardened 2196-T8511 and 2099-T83 Al-Li alloys profiles under displacement controlled cold stretch bending. PAULSEN and WELO [12] investigated the effect of material behaviour on the springback and cross section deformation in stretch bending of aluminium profiles by finite element (FE) simulations. LLOYD et al [13] assessed the bend performance of the heat treatable skin alloy AA 6111 and the non-heat treatable structural alloy, AA 5754 by the cantilever bend tests.  [14] investigated the rotary draw bending of aluminum alloy tubes with internal fluid pressure by FE simulations and experiments. KIM and
  [15] investigated the effect of temperature gradients on the final part quality in warm forming of lightweight materials by FE analyses.
  et al [16] investigated the influence of the temperature on residual stress and springback in AA5754-O aluminium alloy by split-ring tests.
To date, the bending deformation behaviors of many aluminum alloys during the bending process were investigated. However, no systematic study on the role of heat treatment conditions on the bending characteristics can be found. The aim of this study is to investigate the influence of material states on bending characteristics of heat-treatable 6063 aluminum alloys at room temperature by three-point bending tests combining with numerical simulations. A 3D-FE model for three-point bending process was established based on the LS-DYNA software package. The changes of bending force, interior angle, bending radius and sheet thickness in the fillet region were analyzed rigorously. Finally, the deformation mechanisms underlying bending characteristics of different materials have been revealed.
2 Experimental
2.1 Materials and heat treatment
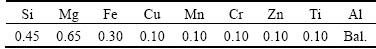
The material used in this study was the commercial 6063 aluminum alloy. The chemical composition is shown in Table 1. The sheet specimens were taken from a hollow extruded profile with a thickness of 3 mm, which had been treated with natural aging. To investigate the effect of material states on the bending characteristics, for the ST alloys, the original NA alloys were heat treated at 535 ��C for 1 h to make sure that the Mg and Si were in solid solution as much as possible, and then cooled rapidly enough to hold the constituents in solution. For the T6 temper, the ST alloys were heat-treated at 180 ��C for 2 h and 6 h, respectively.
Table 1 Chemical composition of 6063 aluminum alloy (mass fraction,%)
2.2 Tensile test
The tensile test was widely used to provide basic design information on the strength and ductility of materials. Standard tensile specimens with gauge length of 46 mm and gauge width of 12.5 mm were machined from the extruded profiles. Figure 1 shows the detailed dimensions of the tensile specimen. In tensile test, the specimen was placed between two fixtures called ��grips�� which clamp the specimen. Then, the tensile test was carried out at a tensile rate of 2 mm/min by an Instron- type electromechanical machine. The tensile force versus displacement data was recorded automatically.
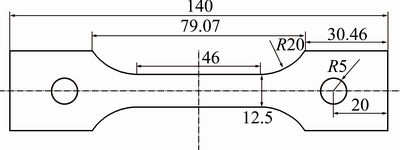
Fig. 1 Dimensions of tensile test specimen (unit: mm)
2.3 Three-point bending test
The three-point bending tests were performed using a universal mechanical testing machine, INSTRON (Model 1342) with a computer control and data acquisition system, as shown in Fig. 2. The apparatus has a loading capacity of 250 kN and bending stroke of ��50 mm. A 2D schematic of mechanics model is illustrated in Fig. 3, where L and t denote the length and thickness of the specimen, respectively. The specimen sizes of sheet were 160 mm �� 20 mm �� 3 mm. The side cylindrical supporters were laid on the floor symmetrically. The indenter had the same diameter as that of these two side cylindrical supporters (r=5 mm) to prevent localized indentation in the upper face of the sheet specimen. The support span S in the three-point bending rig was set to be 120 mm. The bending experiments were carried out at three different material states. During bending tests, the specimen was symmetrically placed in the middle of the supports. In the beginning, the specimen was contacted with the indenter at the middle line only. The direction of bending moment was perpendicular to the longitudinal direction of the specimen (i.e. the Y direction in Fig. 3). All the specimens were deformed to a deflection of 30 mm at a constant speed of 10 mm/min (i.e. quasi-static). Thus, the bending time was about 3 min for each specimen. During bending test, the bending force versus indenter stroke data can be acquired and recorded automatically by the BLUEHILL software incorporated with UTM machine.
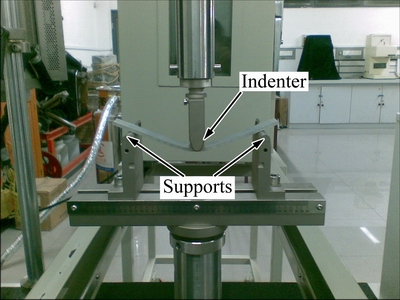
Fig. 2 Experimental apparatus for three-point bending test
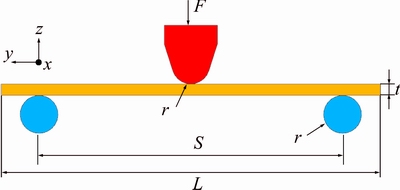
Fig. 3 2D schematic of mechanic modeling
After bending, the contour of bent sheet was obtained by the 3D scanner and reconstructed in the Unigraphics NX software. The bending deformation zone, bending radius Rb, thickness teq, interior angle �� before unloading and interior angle ���� after unloading, as illustrated in Fig. 4, were determined. The thicknesses of all specimens in the fillet region were measured three times, then the mean thickness teq of each specimen was obtained. These obtained parameters were used for evaluating the effect of material states on the bending characteristics of aluminum alloy. The offset of neutral layer of the sheet can be represented by the coefficient of neutral layer (k-value). While the k value exceeds 0.5, the neutral layer shifts to the outer tension zone. While the k-value is less than 0.5, the neutral layer shifts to the inner compression zone. The more the k-value deviates from 0.5, the greater the neutral layer shifts. According to the theorem of volume invariance, the k-value can be calculated by the following constitutive equation [17]:
 (1)
(1)
where k, ��, Rb and t are the coefficient of neutral layer, coefficient of incrassation, the inner bending radius and the initial thickness, respectively. Here, ��=teq/t and teq is the thickness of sheet after bending.
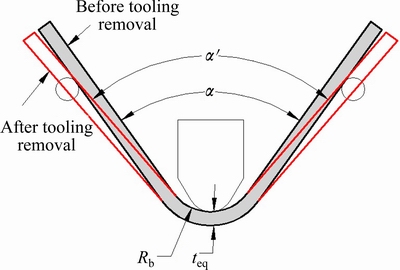
Fig. 4 Measured parameters for evaluating bending characteristics
3 FE modelling for three-point air bending
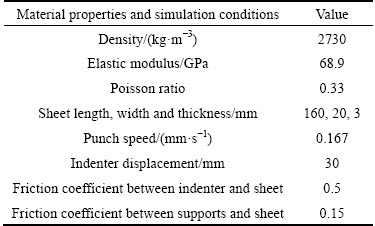
FE simulations of the three-point air bending process were performed using LS-DYNA software package. The 3D-FE model for aluminum sheet three-point bending is shown in Fig. 5. The indenter and two supports were meshed using default constant stress solid elements and rigid material model MAT_20 due to their high modulus of elasticity and negligible elastic deflection compared with the sheet. The sheet was meshed with 3D hexahedral elements with full integration and with the hourglass type set to 6 used in hourglass control. For the sake of computational efficiency, the area in the bending deformation zone was meshed with finer elements and the mesh size was set to be 0.4 mm �� 0.4 mm, while the mesh size in the other region was set to be 0.4 mm �� 1.5 mm. Table 2 shows the detailed material properties and simulation conditions.
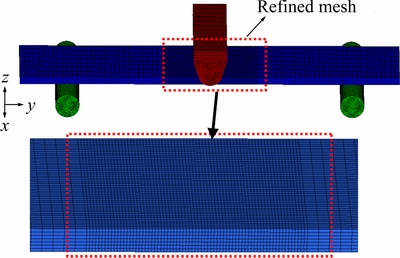
Fig. 5 FE model of aluminum sheet three-point bending
Table 2 Material properties and simulation conditions
A Johnson-Cook constitutive model was implemented in the FE model to describe the behaviour of sheet material. The model considers no kinematic hardening and expresses rather the equivalent stress as a function of plastic strain, strain rate and temperature. For this model, the flow stress ��y is given by
 (2)
(2)
 (3)
(3)
where A, B, C, n and m are the material constants,  is the equivalent plastic strain,
  is equivalent plastic strain rate, T is the material temperature, Troom is the room temperature, and Tmelt is the melting temperature of the material.
At room temperature and quasi-static deformation conditions, the effects of strain rate and deformation temperature on material properties can be neglected for Johnson-Cook model. Thus, the model can be simplified as
 (4)
(4)
The Johnson-Cook parameters of A, B and n can be determined by fitting the experimental data. The identified Johnson-Cook parameters for different sheet materials are listed in Table 3. Figure 6 shows the comparison of results for no-linear fitting curves and experimental data. The fitted results agree well with the experimental data. The adjusted R-squared coefficients of all curves are greater than 0.99.
Table 3 Fitting constitutive parameters of aluminum alloys under different material states
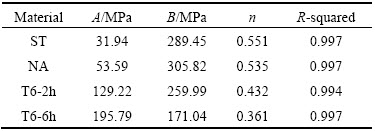
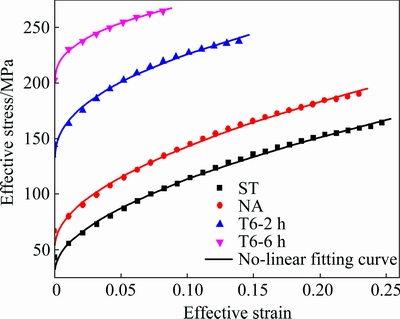
Fig. 6 Effective stress-strain curves of 6063 aluminum alloys
In the FE model, AUTOMATIC_ONE_WAY SURFACE_TO_SURFACE contact type was utilized for the indenter-sheet and support-sheet contacts. Coulomb friction model was used to compute the three contact interfaces in which friction is proportional to normal pressure. Static friction coefficient (FS) and dynamic friction coefficient (FD) were defined as 0.5 and 0.15 for the indenter-sheet and support-sheet contacts, respectively [18]. Quasi-static indenter displacement was modeled using the PRESCRIBED_MOTION_RIGID command. We used the dynamic explicit method in the forming process, after which the static implicit method was applied for unloading springback process. The command *INTERFACE_SPRINGBACK_SEAMLESS was utilized to simulate the springback process. Proper constrains in no deformation zone were exerted to make sure that there was no rigid body rotation and translation.
4 Results
4.1 Material properties
Figure 7 shows the tensile test results of all the specimens. It can be seen form Fig. 7(a), in the tensile tests, the fracture positions of all specimens are located within the gauge length. The engineering stress-strain curves of all specimens are presented in Fig. 7(b). At room temperature, there are obvious work hardening behaviors in the tensile processes. The whole stress-strain curve can be classified into three distinct stages: elastic stage, hardening stage and failure stage.
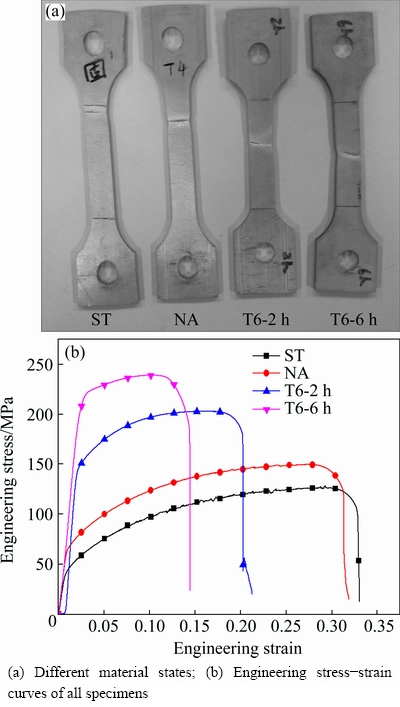
Fig. 7 Tensile test results of 6063 aluminum alloys
The tensile stress rises abruptly with tensile strain in the elastic stage, then increases at slow rate up to ultimate stress due to work hardening.
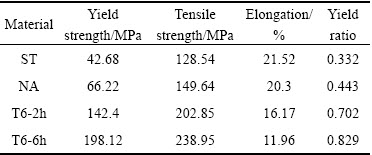
Table 4 shows the main mechanical performance indexes of 6063 aluminum alloys. The material state has a strong influence on material properties. The ST alloy has the lowest tensile strength and the highest elongation. The NA alloy has a slightly higher tensile strength, but a slightly lower elongation than the ST alloy. The T6 alloys have much higher tensile strength and lower elongation than both ST and NA alloys. The yield and tensile strength of T6-2h alloy are 142.4 MPa and 202.85 MPa, respectively, being 234.3% and 57.81% higher than those of the ST alloy. Moreover, with the increase of aging time, the yield and tensile strength obviously increase, whereas the elongation decreases. Compared with the T6-2h alloy, the T6-6h alloy is about 39.13% higher in yield strength, and 26.07% lower in elongation. The yield strength to tensile strength ratio, the so-called yield ratio, is an important measure criterion of the deformability and embrittlement. It can be seen from Table 4 that the yield ratio has inverse relationship with the material��s elongation. The yield ratio of T6-6h alloy is 0.829, which is 2.5 times than that of the ST alloy. Additionally, yield ratio increases with the increase of aging time.
Table 4 Main mechanical performance indexes of 6063 aluminum alloys
4.2 Bending deformation characteristics
Figure 8 shows the final deformed shapes of all specimens after bending under different material states. The material states have great influence on the bending deformation behavior of sheet. For the ST and NA alloy sheets, the bending deformation zones are relatively large and there are more materials to participate in the bending deformations. In contrast, the T6 alloy sheets are bent more sharply and generate severe local plastic deformation, which is centered largely in the indenter position. The bending deformation zones are quite short and the deformations are inhomogeneous.
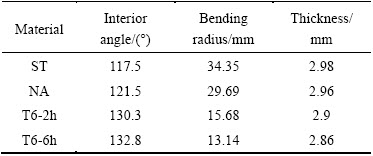
Experimental data of exterior angle, bending radius and sheet thickness changes after bending under different material states are summarized in Table 5. The results show that the ST alloy sheet has the maximum bending radius Rb. The bending radius of NA alloy sheet is slightly less than that of the ST alloy sheet. The T6 alloy sheets are bending sharply, and consequently, the bending radii are far less than that of the ST alloy sheet. However, the opposite tendency of bending interior angle ���� occurred with the bending radius. The interior angle of ST alloy sheet is the minimum, while the T6 alloy sheets are the maximum. The aging time shows a positive sensitivity on the springback and non-uniform bending deformability. With the increase of aging time, the bending radius decreases and springback increases. In addition, a thickness thinning of all sheets after bending in fillet region is noticed, and the thickness thinning for the T6 alloy sheets is more marked. The thickness thinning rate for T6-6h alloy sheet reaches 4.7%.
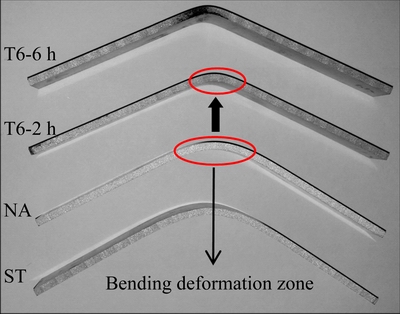
Fig. 8 Final deformed shapes of all specimens after bending under different material states
Table 5 Interior angle, bending radius and thickness of sheets after bending
The bending force versus displacement of all specimens is plotted in Fig. 9. Noting that the material states strongly affect the peak force and bending strength. The bending force of ST alloy is the minimum and the peak force is 135.71 N. The NA alloy sheet has a similar tendency with the ST alloy sheet. In contrast, the mechanical responses for T6 alloy sheets are somewhat different, which in general are much larger than those of the ST and NA alloy sheets. The peak force of T6-2h alloy sheet is 370.27 N, being 172.84% higher than the ST alloy sheet. With the increase of aging time, the bending force increases. The peak force of T6-6h alloy sheet reaches 413.82 N. This is mainly due to the difference in material strength of different sheets. The T6 alloy has higher tensile strength, thus needing higher bending load.
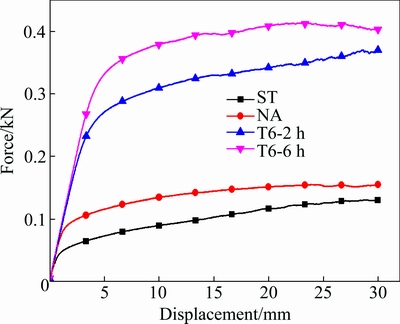
Fig. 9 Force versus displacement relationships of different sheets during three-point bending test
5 FE simulations of three-point air bending
In order to examine the reliability of the FE model developed for predicting the bending characteristics, the simulated and experimental force-displacement curves of sheets at different material states during three-point bending test are shown in Fig. 10. It is observed that the simulation results are almost identical with the experimental results. The error between T6-6h- simulation and T6-6h-experiment is maximum, but the maximum prediction error is less than 10%. The slight difference between the two may be result from the ignoring of anisotropy of the materials in the FE model.
Near the inner zone in the bending fillet region is under compressive stress. The constitutive model established in outer tension zone does not coincide with that in inner compression zone, which may influence the accuracy of FE analysis.
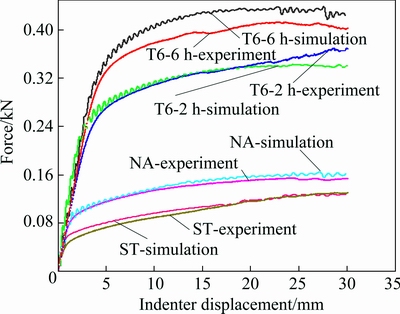
Fig. 10 Comparison of simulated and experimental force-displacement curves during three-point bending test
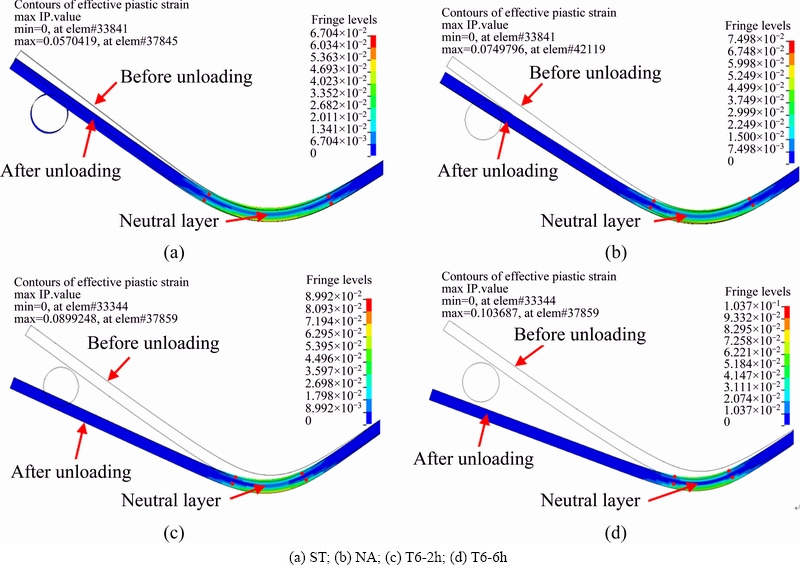
Fig. 11 Simulated formed shapes of four material sheets before and after unloading
Figure 11 shows the simulated formed shapes of four material sheets before and after tooling removal. It is clear that there is an obvious neutral layer between the inner and outer regions, in which the strain is zero. The plastic deformation zone for the ST alloy sheet is the longest and the T6-6h alloy sheet is the shortest. The simulated deformation modes are in good agreement with the experimental results. After the release of the load by withdrawal of the indenter, the sheet recovers its shape partially. The springbacks of the ST and NA alloy sheets are significantly smaller than those of the T6 alloy sheets. The neutral layers of T6 alloy sheets shift to the inner zone more markedly in comparison to the ST and NA alloy sheets and bend more sharply.
Figure 12 shows the simulated and experimental comparisons of interior angles, bending radii of sheets before and after unloading. It can be seen that the simulation results show comparatively good agreement with experimental measurements for four different sheets. In the case of the interior angle ���� after unloading, the maximum prediction error is within 3%. The simulated interior angle �� of four materials before unloading presents an accordant value, the mean value is 113.87��. The springback angle (the difference between �� and ����) at a value of 3.6�� for the ST alloy sheet is extremely small, while the T6 alloy sheets have considerable springback. The springback angles of T6-2h and T6-6h alloy sheets are 13.88�� and 16.44��, respectively. The bending radius Rb, however, shows opposite trend compared with the interior angle ����. The bending radius decreases as material strength increases. About 13.2% error is observed between the simulations and experiments.
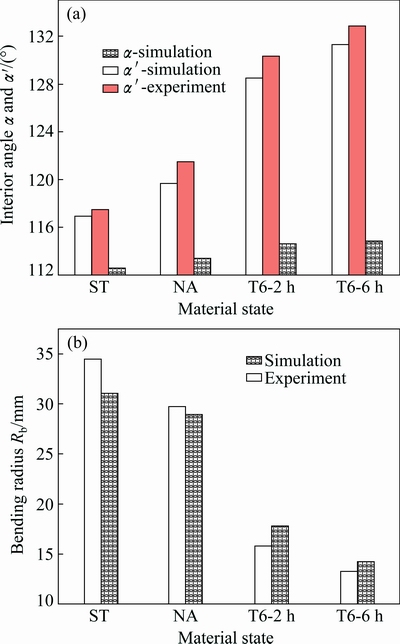
Fig. 12 Simulated and experimental comparisons of interior angles (a), bending radii (b) of sheets before and after unloading
6 Discussion
The springback process is the stress self-balancing process of sheet, which depends on the stress and strain states of sheet during bending process. In order to reduce springback, the inner and outer materials should be subjected to a consistent stress state and suffer lower strain hardening in the bending deformation zone. The variation of principal stresses for the top and bottom layers of sheets under different material states is shown in Fig. 13. The bottom layer of the sheet in outer region has stress in tension, while the top layer in inner region has compressive stress. The larger the difference of tensile and compressive stress between the top and bottom layer, the higher the residual bending moment after tooling removal. It can be seen from Fig. 13 that the tensile and compressive stresses increase significantly in the initial bending phase, then continue to increase slowly until the indenter displacement is 30 mm. After unloading, the two principal stresses decrease rapidly to a small value. Moreover, it is found that the difference of tensile and compressive stresses for the ST alloy sheet is the smallest, while that of the T6-6h alloy sheet is the largest. The main reason could be due to the lower material strength and higher yield ratio of ST and NA alloys. With the increase of material strength and yield ratio, the difference of tensile and compressive stress between the top and bottom layer increases. The similar results are attained in investigating the effect of material parameters on the springback of aluminium alloy tubes in rotary draw bending [9].

Fig. 13 Principal stress distribution of top and bottom layers of sheets under different material states
The yield ratio is also an important indicator of deformability, which has high sensitivity to the material��s uniform elongation [19]. With the increase of yield ratio, the ability of uniform plastic deformation decreases, the ability of non-uniform plastic deformation increases and the toughness of material decreases. As the indenter proceeds, the bending deformation zone experiences strong harden characteristics. When lager plastic deformation occurs, an increase in the yield ratio can induce severe local deformation concentration and lessen the structure��s ability for strain redistribution in thinned areas, which is very harmful to structural integrity. As shown in Table 4, the yield ratios of T6 alloys are higher than those of the ST and NA alloys. The ability of non-uniform plastic deformation increases, resulting in several deformation concentrations in the indenter position. While for the ST and NA alloy sheets, much adjacent materials in the fillet region coordinate the deformation and a large bending radius comes into being.
The shift of neutral layer results from the asymmetry of deformation between the outer and the inner region. In the bending process, the thickness of outer zone is decreased due to the bending tensile stress, and the thickness of inner zone is increased due to the bending compressive stress. Due to the shift of the neutral layer in the bending deformation zone, the zone of thickness thinning will be greater than the zone of thickness thickening, which leads to the decrease of the total thickness of sheet. The severer the bending deformation in bending fillet region, the greater the thickness thinning and the shift of neutral layer are. Thus, the k-value decreases with the decrease of bending radius, and correspondingly increases with the increase of bending radius. Figure 14 shows the variation of the k-value under different material states. It can be seen that the k-values of four sheets are less than 0.5, thus their neutral layers shift toward the inner compression zone during bending. The neutral layers of T6 alloy sheets shift to the inner zone more markedly and the k-value of T6-6h alloy sheet is 0.25. The calculated k-values fit well with the simulation results of the neutral layer shifting (see Fig. 14). As shown in Table 5 that the bending radius of ST alloy sheet is the maximum (34.35 mm), while that of T6-6h alloy sheet is the minimum (13.14 mm).
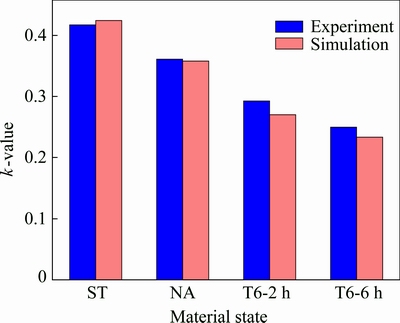
Fig. 14 Effect of material state on k-value
7 Conclusions
1) The Johnson-Cook constitutive model can describe the quasi-static response of 6063 aluminum alloy sheet under different heat treatment conditions satisfactorily. The ST alloy has the lowest tensile strength, yield ratio and the highest elongation. The T6 alloys have significantly higher tensile strength, yield ratio and lower elongation than those of ST and NA alloys. With the increase of aging time, the yield, tensile strength and yield ratio obviously increase, while the elongation decreases.
2) The bending force of T6 alloy is the highest, followed by the NA alloy and that of the ST alloy is the minimum. The simulated interior angle �� of four materials before unloading presents an accordant value. After unloading, the springback of ST alloy sheet is the smallest, while that of the T6 alloy is the largest. With the increase of material strength and yield ratio, the difference of tensile and compressive stress between the top and bottom layers increases, consequently leading to a larger springback.
3) The T6 alloy sheets are bent more sharply and local plastic deformations occur severely in the fillet region. In contrast, the ST and NA alloys exhibit relatively uniform bending deformation and large bending radius. High yield ratio and low coefficient of neutral layer increase the non-uniform bending deformability.
4) The aging time shows a positive sensitivity on the springback and non-uniform bending deformability. The bending radius decreases and springback increases with increasing aging time.
References
[1] XIAO Gang, YANG Qin-wen, LI Luo-xing. Modeling constitutive relationship of 6013 aluminum alloy during hot plane strain compression based on Kriging method [J]. Transactions of Nonferrous Metals Society of China, 2016, 26(4): 1096-1104.
[2] FRANK V. Extrusion, channel, and extrusion bending: A review [J]. Journal of Materials Processing Technology, 1999, 87(1-3): 1-27.
[3] XU Jie, YANG He, LI Heng, ZHAN Mei. Significance-based optimization of processing parameters for thin-walled aluminum alloy tube NC bending with small bending radius [J]. Transactions of Nonferrous Metals Society of China, 2012, 22(1): 147-156.
[4] OKUDE Y, YOSHIHARA S, SAITO A, MACDONALD B J. Bending deformation behavior of aluminium extruded various sections with laminated elastic mandrel on draw bending [J]. Materials Today: Proceedings, 2015, 2(10): 4802-4811.
[5] MILLER J E, KYRIAKIDES S. Three-dimensional effects of the bend�Cstretch forming of aluminum tubes [J]. International Journal of Mechanical Sciences, 2003, 45(1): 115-140.
[6]  A, PEREYRA I, CAMPILLO B, SERNA S, ALCUDIA E, MOLINA A, BLANCO A,
  J. Improvement of ultimate tensile strength by artificial ageing and retrogression treatment of aluminium alloy 6061 [J]. Materials Science and Engineering A, 2016, 668: 201-207.
[7] ELAHI M A, SHABESTARI S G. Effect of various melt and heat treatment conditions on impact toughness of A356 aluminum alloy [J]. Transactions of Nonferrous Metals Society of China, 2016, 26(4): 956-965.
[8] SNILSBERG K E, WESTERMANN I, HOLMEDAL B, HOPPERSAD O S, LANGSRUD Y, MARTHINSEN K. Anisotropy of bending properties in industrial heat-treatable extruded aluminium Alloys [J]. Materials Science Forum, 2009, 638-642: 487-492.
[9] ZHANG R Y, ZHAO G Y, GUO Z H, QUAN Y P. Effects of material parameters on springback of 5052 aluminium alloy sections with hat profile in rotary draw bending [J]. The International Journal of Advanced Manufacturing Technology, 2015, 80(5-8): 1067-1075.
[10] LIU Tian-jiao, WANG Yong-jun, WU Jian-jun, XIA Xiao-jiao, WANG Jun-biao, WANG Wei, WANG Shun-hong. Springback analysis of Z & T-section 2196-T8511 and 2099-T83 Al-Li alloys extrusions in displacement controlled cold stretch bending [J]. Journal of Materials Processing Technology, 2015, 225: 295-309.
[11] LIU Tian-jiao, WANG Yong-jun, WU Jian-jun, XIA Xiao-jiao, WNAG Wei, WNAG Shun-hong. Springback of extruded 2196-t8511 and 2099-t83 Al-Li alloys in stretch bending[J]. Procedia Engineering, 2014, 81: 981-986.
[12] PAULSEN F, WELO T. Application of numerical simulation in the bending of aluminium-alloy profiles [J]. Journal of Materials Processing Technology, 1996, 58(2-3): 274-285.
[13] LLOYD D J, EVANS D, PELOW C, NOLAN P, JAIN M. Bending in aluminium alloys AA 6111 and AA 5754 using the cantilever bend test [J]. Materials Science and Technology, 2002, 18(6): 621-628.
[14] L. Effect of internal fluid pressure on quality of aluminum alloy tube in rotary draw bending [J]. The International Journal of Advanced Manufacturing Technology, 2013, 64(1-4): 85-91.
[15] KIM H S, M. Numerical investigations on springback characteristics of aluminum sheet metal alloys in warm forming conditions [J]. Journal of Materials Processing Technology, 2008, 204(1-3): 370-383.
[16] R, MANACH P Y, LAURENT H, THUILLIERA S, MENEZES L F. Influence of the temperature on residual stresses and springback effect in an aluminium alloy [J]. International Journal of Mechanical Sciences, 2010, 52(9): 1094-1100.
[17] HUANG Guang-sheng, WANG Li-fei, ZHANG Hua, WANG Yan-xia, SHI Zhao-yang, PAN Fu-sheng. Evolution of neutral layer and microstructure of AZ31B magnesium alloy sheet during bending [J]. Materials Letters, 2013, 98: 47-50.
[18] RATHNAWEERA G, RUAN D, HAJJ M, Durandet Y. Performance of aluminium/Terocore hybrid structures in quasi-static three-point bending: experimental and finite element analysis study [J]. Materials & Design, 2014, 54: 880-892.
[19] JANG J, CHOI Y, LEE Y H, KWON D. Instrumented microindentation studies on long-term aged materials: work-hardening exponent and yield ratio as new degradation indicators [J]. Materials Science and Engineering A, 2005, 395(1): 295-300.
��־��1,2��������1,2���� ��1��������1,2������1,2���� ��1,3
1. ���ϴ�ѧ ���������Ƚ������������ص�ʵ���ң���ɳ 410082��
2. ���ϴ�ѧ ��е�����ع���ѧԺ����ɳ 410082��
3. ���Ĵ�ѧ ��е����ѧԺ������ 750021
ժ Ҫ���о�����̬����ȻʱЧ��T6̬�Ȳ�ͬ�ȴ���״̬��6063���Ͻ�����������������Ϊ��Ӱ�졣��������ͷ������ϵķ���ϵͳ�����˱����غɡ������ڽǡ������뾶�Ͱ��ı仯���ɡ��о�����������ȴ���״̬����Ӱ�����Ͻ��ĵ���������������T6̬���Ͻ����������θ�Ϊ���ң��������صľֲ����Ρ���ȻʱЧ����̬���Ͻ����������ξ�����չ�������뾶����T6̬���Ͻ�������غ������ȻʱЧ̬��֮������̬��С��ж�غ�T6̬�Ļص�����ȻʱЧ����̬�Ĵ�ʱЧʱ��������ص��;ֲ��������������������ԡ��������������Ϊ��Ҫ���ɲ��ϵ�����ǿ�ȡ���ǿ�Ⱥ����Բ�ƫ��ϵ�����ۺ�Ӱ��Ľ����
�ؼ��ʣ�6063���Ͻ���������������״̬������������������ǿ�ȣ���ֵ����
(Edited by Xiang-qun LI)
Foundation item: Projects (U1664252, 51605234) supported by the National Natural Science Foundation of China; Project (2016YFB0101700) supported by the National Key Research and Development Program of China; Project (31665004) supported by the Open Fund of State Key Laboratory of Advanced Design and Manufacture for Vehicle Body
Corresponding author: Luo-xing LI; Tel: +86-731-88821571; E-mail: luoxing_li@yahoo.com
DOI: 10.1016/S1003-6326(17)60170-5

