J. Cent. South Univ. Technol. (2011) 18: 504-510
DOI: 10.1007/s11771-011-0724-4
microscopic analysis of saturated soft clay in Pearl River Delta
ZHOU Hui(����)1, 2, FANG Ying-guang(��Ӫ��)1, 2, GU Ren-guo(���ι�)1, 2, ZENG Cheng(����)1, 2
1. School of Civil Engineering and Transportation, South China University of Technology, Guangzhou 510641, China;
2. State Key Laboratory of Subtropical Building Science, South China University of Technology,
Guangzhou 510641, China
? Central South University Press and Springer-Verlag Berlin Heidelberg 2011
Abstract: A series of researches were carried out for the soil samples in the Pearl River Delta under the action of consolidation loads, such as the quantitative analyses of the pore scale, shape and size distributions of micro-structure units, with an environmental scanning electron microscope (ESEM), a mercury intrusion analyzer and a mineral diffractometer. The experimental results show that the consolidation pressures remarkably change the pore sizes and distribution characteristics of the silt, thus changing its compressibility and permeability. This can be proved by the fact that, in the earlier stage with a consolidation pressure of p<200 kPa, the pore sizes are greater and the compressibility and permeability coefficients are larger. However, they rapidly decrease with the increase in consolidation pressure. And in the later stage with a consolidation pressure of p>200 kPa, the pore sizes are smaller and the compressibility and permeability coefficients are less. Therefore, the empirical formulas of compression coefficient and permeability coefficient vs consolidation load and average pore diameter are deduced.
Key words: saturated soft soil; Pearl River Delta (PRD); micro-structure; microscopic analysis; pore distribution; engineering properties
1 Introduction
The Pearl River Delta (PRD) is one of four major deltas in China or the 15th largest delta in the world, which is 8 601.1 km2 in area [1]. Pearl River Delta region is dotted with a large number of quaternary- system marine deposits of soft soil with high water content, high compression, high plasticity index, low intensity and low permeability, mainly composed of mud, silty mud and clay [2]. The soil layer is a potential disease layer of construction projects, frequently resulting in ground instability, collapse and other engineering accidents. This would cause great property and even life losses [3], thus giving a great challenge to the design, construction and maintenance of the projects. The traditional tests and investigations are only focused on fitting analyses of soft soil properties. So, it is difficult for researchers to seize the essence factors of soft soil engineering properties and to make a serious analysis of their engineering properties. In fact, many studies have shown that [4-5] engineering properties of soft soil depend chiefly on its micro-structure variations. The compressibility and permeability of soft soil are significantly impacted by pore characteristics and variations, and high porosity is the direct factor which leads to high water content, low intensity and high compressibility of soft soil. Then, pore characteristics, such as pore-scale and distribution, connectivity, twists and turns, are the chief factors in the permeability of soft soil [6-7]. So, the drainage consolidation characteristics of soft soil are mainly determined by permeability which is directly related to porosity, pore scale, connectivity and other features [5].
In this work, typical soft clay samples from the Pearl River Delta region are used as the research object to make an investigation into the mineral compositions, micro-pore characteristics and variations of soft soil under the action of different consolidation pressures by conventional tests, micro-tests including X-ray diffraction analysis, mercury intrusion test and ESEM test. The practical formulas linking pore characteristics with compression deformation or seepage consolidation characteristics are deduced by quantitative analysis of pore change patterns.
2 Micro-tests of soft soil
2.1 X-ray diffraction analysis
Under general conditions, engineering properties of soil are seriously impacted by mineral compositions and contents of soil, which can reflect the corresponding sedimentary faces. So, a BRUKER D8 ADVANCE X-ray diffractometer Cu (monochrome) made in German was used for typical crystallography analysis of the clay particles (d<0.002 mm) obtained from different regions of the Pearl River Delta. The experimental results of X-ray diffraction analyses are listed in Table 1, from which it is seen that the main ingredients of the soil are quartz, accounting for 47.9% in Jinshazhou (JSZ), 32.9% in Panyu (PY) and 21.2% in Shenzhen (SZ), respectively, and kaolinite accounting for 8.4% in JSZ, 19.5% in PY and 36% in SZ, respectively, with relatively higher content of soluble salt. The results indicate that the sludge soft soil in the region belongs to the coastal sediments of hydrostatic environment.
2.2 Environmental scanning electron microscope test
The observation of samples with an environmental scanning electron microscope (ESEM) has the advantages of no drying, coating and fixing. The original appearance of the soft soil can be clearly and truly reflected from the observed results [8]. Therefore, it is proved to be a new and effective means for microscopic soil study by taking the following steps: 1) making observed samples for pre-consolidation and post- consolidation at all levels of loading [9], 2) taking ESEM photographs, 3) choosing representative ESEM images from the level and vertical sections for analysis. To make the results comparable, amplification factor (AF) of 4000, resolution of 0.073 ��m/pixel and analytical region of 1 023 pixel��884 pixel were chosen.
ESEM images from a typical soft soil of the PRD are shown in Fig.1. Image-processing software (particles and cracks analysis system software) was used to analyze the micro-structural images of the soft soil in order to obtain the micro-structural parameters, such as void ratio, size/volume/size distribution of particles, size/volume/ size distribution of pores and orientation.
2.3 Mercury intrusion test
Mercury intrusion method is commonly used to measure the pore size and distribution of the soil. Because of the mercury impermeability to soil [10], the mercury-injecting pressure is required to overcome the capillary resistance which prompts mercury to outflow from the capillary. Therefore, the greater the aperture, the smaller the capillary resistance and the lower the required pressure. As long as the amounts of mercury pressed into specimen at various pressure points are measured, their pore scale distributions and porosity can be easily obtained based on the theory of cylindrical pore model. The basic formula of the theory is
p��r=-2��cos�� (1)
where p�� is the mercury-injecting pressure, r is the pore radius, �� is the surface tension coefficient of the mercury, and �� is the wetting angle of mercury on the material. �� is 0.485 N/m and �� is 130�� according to the relevant literature [11].
It can be seen from Eq.(1) that the mercury-injecting pressure and aperture can be converted with each other. Aperture-cumulative mercury curves of typical PRD soft soil (pre-consolidation/post- consolidation) are shown in Fig.2, from which the pore- scale distribution, average pore size and other parameters of the samples can be easily obtained.
Table 1 X-ray diffraction analysis of soft clay minerals


Fig.1 ESEM images of soft soil samples in PRD: (a) Sample No.7 obtained from PY (0 kPa, vertical section); (b) Sample No.12 obtained from PY (800 kPa, vertical section)
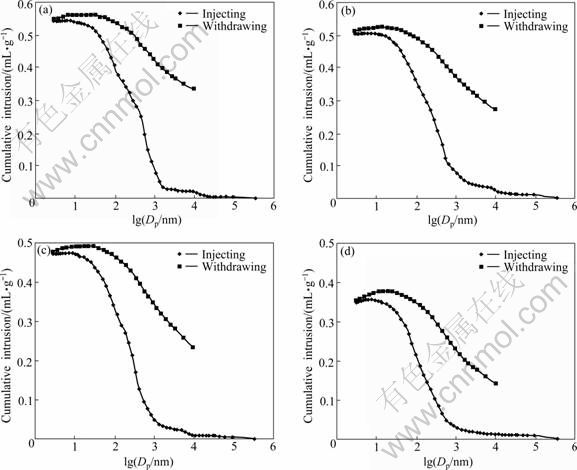
Fig.2 Curves of pore diameter (Dp) and cumulative mercury of Shenzhen silt soil: (a) 0 kPa; (b) 200 kPa; (c) 400 kPa; (d) 1 600 kPa
3 Soft soil pore analysis of test results
3.1 Partition of pore
According to Refs.[12-14] and pore characteristics of PRD silt soil, the PRD soft soil pores are divided into the following five categories: 1) large-size pores of Dp> 10 000 nm are mainly the ones between the aggregates, 2) medium-size pores of 2 500 nmp<10 000 nm are chiefly the ones within the aggregates, 3) small-size pores of 400 nmp<2 500 nm are the ones chiefly between the particles and partly within the aggregates, 4) micropores of 30 nmp<400 nm are the ones between the particles, and 5) ultra-micropores of Dp< 30 nm are mostly the ones inside the particles.
3.2 Analysis of pore scale and distribution
In Fig.2, the curves are gentle at both ends and relatively steep in the middle sections. In terms of the changes in curve slope of the undisturbed soil, the pore distribution of the samples has the following characteristics: 1) The distribution curve of large pores is flat, approximately a straight line, with the cumulative mercury-injecting amount of less than 0.05 mL/g, indicating that the void ratio of these pores is very small; 2) The distribution curve of medium-size pores is shorter, with the slope slightly larger than that of the large pores paragraphs, revealing that the score of pores within the aggregates is relatively small; 3) Small pore distribution curve is steep, namely, it has the largest slope, indicating that the score of the pores between the particles and within the aggregates is the largest; 4) Micropore distribution curve is steeper, which indicates a larger score of pores between the particles; 5) Ultra-micropore distribution curve with very small slope shows that the number of pores inside the particles is very small, with the final amount of mercury injected into the undisturbed soil sample being 0.544 mL/g at a consolidation pressure of 0 kPa, being 0.474 mL/g at 400 kPa, and being only 0.352 mL/g, namely about 65% of the mercury amount in the undisturbed sample at 1 600 kPa. This proves that the pore volume decreasing speed has slackened with the increase of consolidation pressure.
As shown in Fig.2, the fact that the mercury- withdrawing curve does not coincide with the mercury- injecting curve indicates that, inside the soil samples there exist not only pores like ��ink bottle�� which are generally composed of narrow calibers and big abdominal cavities, thus leading to a higher mercury- injecting pressure than the mercury-withdrawing pressure, but also residual pores which are difficult to exclude once mercury is injected into the pores. As shown in Fig.3, the characteristics of the two types of pores, such as connectivity, twists and turns, can be visually displayed and verified by ESEM images. Fig.3(a) shows the ESEM image of the soil samples in PRD. The typical pores in Fig.3(a) are displayed in Figs.3(b)-(e). Pores in Figs.3(b) and (c) have uniform shape, good connectivity and the same nature in all directions, so that they are more capable of injecting and withdrawing mercury. However, pores shown in Figs.3(d) and (e) with poor connectivity and narrow throats cause the injected mercury not to be completely withdrawn, thus making the mercury-withdrawing curve lag behind the mercury- injecting curve.
Void ratios and pore scale distributions of typical PRD soft soil under the action of different consolidation pressures are given in Tables 2 and 3, which are obtained from mercury intrusion and ESEM tests. It is seen from Table 2 that, with the increase in consolidation pressure, water in pores is squeezed, leading to the reduction in the volume of pores. The calculated values of the void ratio via mercury intrusion test, ESEM tests and conventional experiments are close, with the minimum, the maximum and the average values of the maximum relative error of 6.7%, 15.7% and 10.0%, respectively, which are limited in the allowable range. So, it can be confirmed that mercury-injecting and ESEM method are all effective means of exploring soft soil micro-structure, and the obtained results of two methods are close.
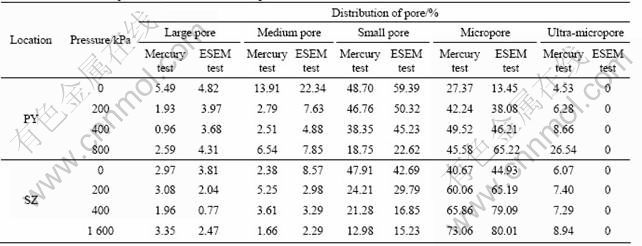
As listed in Table 3, the proportion of the large-scale pores, large and medium pores decreases gradually, while the proportion of the small-scale pores, small-, micro- and ultra-micropores increases with the increase in consolidation pressure, which shows that the larger-scale pores are crushed and split into smaller-scale pores under the action of pressure. When the pressure exceeds 200 kPa, micropores and ultra- micropores rank first and the proportion of them is in excess of 50%, and changes of the pore structure and size distribution characteristics may take place. In the consolidation process, larger pores are compressed earlier than small pores, and the pores inside granulae turn into pores among particles, finally inter-particle pores take the first place. By comparing the particles of PY soft soil with those of SZ, the former are coarser and larger in size, but with the increase in pressure, the differences in their pore scale distributions reduce and reach unanimity. The obtained error in the scale distributions of pores excluding ultra-micropores is in the range of 20%, by mercury intrusion and ESEM tests, which indicates that the measured results are convincing and may be mutually verified. Main reasons for errors are as follows. 1) There are different results by mercury intrusion and ESEM tests because the body pore distribution is obtained by the former while surface pore distribution is obtained by the latter, with the body and surface pore ratios being theoretically identical by assuming the posture in all sections to be identical. 2) The pores of ESEM images assumed to be circular pores in the process of conversion are slightly different from the reality. 3) The pores of less than 10 pixels have been removed in the operation of removing impurities by image software, so it is difficult to count up ultra-micropores.

Fig.3 Pore analysis of ESEM images: (a) ESEM image of soil samples; (b), (c) Pores with good connectivity; (d), (e) Pores with bad connectivity
Table 2 Void ratio comparison of typical soft soil in PRD
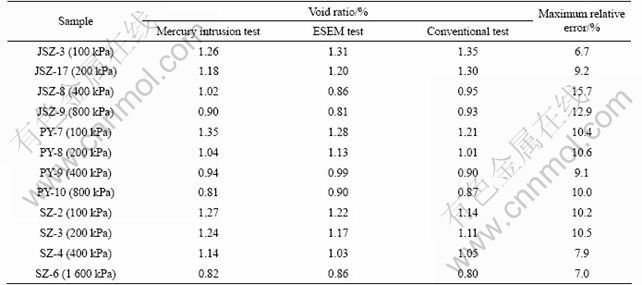
Table 3 Distributions of pore under action of different pressures
3.3 Analysis of changes in compressibility
Compressibility of soil is controlled by its void ratios, pore scale distributions and other factors. It is known from the analyses, the consolidation pressure changes the void ratio and pore scale distribution, thus changing the compressibility of the soil. The changes of compression coefficient a (a=-de/dp) with consolidation pressure p and the average pore size  are shown in Figs.4 and 5, respectively, which are obtained from the consolidation and mercury intrusion tests.

Fig.4 Changes of compression coefficient with consolidation pressure

Fig.5 Changes of compression coefficient with average pore diameter
In Fig4, a-p curve is obtained by linear exponential decay fitting, that is,
a=6.606 exp(-0.012p)+0.367 (R2=0.999) (2)
where R2 is the correlation coefficient.
Also, in Fig.5, a- curve is obtained by quadratic polynomial fitting, that is,
 (R2=0.994) (3)
Seen from Figs.4-5 and Eqs.(2)-(3), the compression coefficient of soil samples decreases rapidly with the increase in consolidation pressure and increases with the increase in pore size. Void ratio and average pore size of soil samples under the action of lower consolidation pressure are large, and most of pores have large or medium size. Due to the fact that large pores are compressed more easily or split into smaller pores than small ones, these samples have higher compression and larger compression coefficient. However, the samples under the action of higher consolidation pressures have smaller compression coefficient, because large pores have been compressed or annihilated and micropores and ultra-micropores take larger proportion and cannot be compressed and annihilated easily.
3.4 Analyses of changes in permeability
Permeability of soft soil is closely related to water content, void ratio, pore size, pore scale distribution and other factors [15]. The permeability coefficient decreases with the decrease of void ratio and pore size in the process of drainage consolidation. It is seen from Tables 2 and 3 that the increase of consolidation pressure will lead to the reduction of void ratio and pore-scale, change the scale and distribution characteristics of soft soil, thus changing the permeability. The permeability coefficient k of typical undisturbed silt soil of PRD is (1.7-4.2)��10-7 cm/s, which is deemed to be the feature of low- permeability soil. The corresponding curves of permeability coefficient k, the consolidation load p and average pore size obtained by mercury intrusion and permeability tests are shown in Figs.6 and 7. The k-p curve is obtained by linear exponential decay, that is,
 (R2=0.996) (4)
The k-curve is obtained by quadratic polynomial fitting, that is,
 (R2=0.999) (5)
As shown in Figs.6-7 and Eqs.(4)-(5), soil samples under the action of lower consolidation pressure have larger void ratio and average pore size, with more free water existing in pores and flowing easily, thus having a high permeability and a relatively large permeability coefficient. However, soil samples under the action of higher consolidation pressure have smaller void ratio and average pore size, with more bound water existing in micropores and ultra-micropores and flowing uneasily, thus having lower permeability and a smaller permeability coefficient.

Fig.6 Changes of permeability coefficient with consolidation pressure
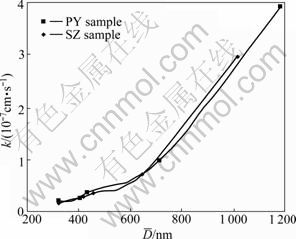
Fig.7 Changes of permeability coefficient with average pore diameter
4 Conclusions
1) The mercury intrusion method and ESEM method are effective means of microscopic study on soft soil. ESEM images can clearly reflect the shape of pores, connectivity, tortuous nature and other characteristics, thus explaining the reason why the mercury-withdrawing curve is not identical with the mercury-injecting curve. The results of void ratio and pore scale distribution obtained by two kinds of micro-tests are consistent, and can be mutually confirmed or supplemented, which is helpful to improving the reliability and accuracy of the existing micro-tests.
2) Consolidation pressure will significantly change the void ratio, pore scale and their distribution characteristics. In the period of pre-consolidation (p< 200 kPa), with the increase of pressure, void ratio significantly decreases, large or medium pores reduce very fast. However, in the period of post-consolidation (p>200 kPa), with the increase of pressure, void ratio decreases very slowly, thus micropores and ultra- micropores possess superiority.
3) Compressibility and permeability change with the pore scale distribution. In the period of pre-consolidation (p<200 kPa), there are many large and medium pores and greater amount of free water in the soil. Consequently, the soil has greater compressibility and permeability. In the period of post-consolidation (p>200 kPa), there are more tiny pores and more bound water, which brings about comparatively small compressibility and permeability of soil.
4) According to the results of microscopic tests, empirical formulae of compression coefficient and permeability coefficient vs consolidation load and average pore diameter are deduced to reflect the physical mechanism of the soil micro-structures and the non-linear relationship between the consolidation and the load.
References
[1] ZHOU Cui-ying. Research into soil mass microstructure and some progresses on soil mechanics [J]. Earth Science�CJournal of China University of Geosciences, 2000, 25(2): 215-218. (in Chinese)
[2] HUANG Zhen-guo, LI Ping-ri, ZHANG Zhong-ying. Evolution of formation and development about the Pearl River Delta [M]. Guangzhou: Guangzhou Popular Science Press, 1982: 15-24. (in Chinese)
[3] MIRANDA E, JORGE R G. Influence of stiffness degradation on strength demands of structures built on soft soil sites [J]. Engineering Structures, 2002, 24(10): 1271-1281.
[4] FREDLUND D G, RAHARDJO H. Soil mechanics for unsaturated soils [M]. New York: John Wiley and Sons, 1993: 123-128.
[5] Tovey N K, KRINSLEY D H, DENT D L, CORBETT W M. Techniques to quantitatively study the microfabric of soils [J]. Geoderma, 1992, 53(3/4): 217-235.
[6] Cheng X H, Janssen H, Barends F B J, Haan E J D. A combination of ESEM, EDX and XRD studies on the fabric of Dutch organic clay from Oostvaardersplassen (Netherlands) and its geotechnical implications[J]. Applied Clay Science, 2004, 25(3/4): 179-185.
[7] QIAN Jia-huan, YIN Zong-ze. Principle and calculation of geotechnical [M]. Beijing: China Water Conservancy and Hydropower Press, 1996: 89-97. (in Chinese)
[8] KENNETH P. Forensic examination of rocks, sediments, soils and dusts using scanning electron microscopy and X-ray chemical microanalysis [J]. Geological Society, London, Special Publications, 2004, 232(1): 103-121.
[9] ZHOU Hui, FANG Ying-guang, YU Chang-jiang. Micro-structure observation and analysis on Guangzhou soft soil during the consolidation process [J]. Chinese Journal of Rock Mechanics and Engineering, 2009, 28(S2): 3830-3837. (in Chinese)
[10] LOWELL S, SHIELDS J E. Powder surface area and porosity [M]. New York: Chapman and Hall, 1997: 10-35.
[11] LIU Pei-sheng, MA Xiao-ming. Detection of porous materials [M]. Beijing: Metallurgy Industry Press, 2006: 122-150. (in Chinese)
[12] TOVEY N K, SMART P, HOUNSLOW M W. Quantitative orientation analysis of soil microfabric [J]. Developments in Soil Science, 1990, 19: 631-639.
[13] SHEAR D L, OLSEN H W, NELSON K R. Effects of desiccation on the hydraulic conductivity versus void ratio relationship for a natural clay [C]// NRC. Transportation Research Record. Washington D C: National academy press, 1993: 1365-1370.
[14] JOZEFACIUK G, TOTH T, SZENDREI G. Surface and micropore properties of saline soil profiles [J]. Geoderma, 2006, 135: 1-15.
[15] WEI Ru-long. Derivation for coefficient of consolidation from settlement observation [J]. Chinese Journal of Geotechnical Engineering, 1993, 15(2): 12-19. (in Chinese)
(Edited by YANG Bing)
Foundation item: Project(2008ZA11) supported by State Key Laboratory of Subtropical Building Science in South China University of Technology, China; Project(20080430815) supported by China Postdoctoral Science Foundation
Received date: 2010-01-28; Accepted date: 2010-07-05
Corresponding author: ZHOU Hui, PhD; Tel: +86-20-87975258; E-mail: zhouhuianhui@126.com

