MnS����Ӧ��-Ӧ��������������Ԫ�����е�Ӧ��
��Դ�ڿ����й���ɫ����ѧ��(Ӣ�İ�)2018���10��
�������ߣ����� ������ ���θ� ������
����ҳ�룺2082 - 2093
�ؼ��ʣ������MnS��Ӧ��-Ӧ�����ߣ�����Ԫ������ò
Key words��inclusion; MnS; stress�Cstrain curve; finite element method; morphology
ժ Ҫ�����һ�ַǽ������ϸ���Ӧ��-Ӧ�����߲��Է�������������õ�MnS����Ӧ��-Ӧ���������ݽ���Ħ���������ڴ˻�������������Ԫ�����������о����β�����MnS�������ݱ��Ӱ�죬�������Ӧ����ʵ����жԱȷ��������������ʵ�鷽�����MnS���±��������нϸߵĿɿ��ԡ��ڻ�����ι����У�MnS��������״����״��Ϊ�������Ρ�ֱ��Բ��Ƭ״���һ��岻ͬλ�ô���������κ����ò��ͬ������MnS�������ʼ�ߴ�����ӣ�̽�˼�ⲻͨ���������ͼ���������֮��
Abstract: A novel method for testing stress�Cstrain curves of non-metallic materials was presented. The high temperature stress�Cstrain curves of MnS were preliminarily obtained and corrected to account for the influence of friction. Using the finite element method, the influence of deformation parameters on the deformation evolution of MnS inclusions was investigated based on the experimental reference data. The corresponding physical experiment was designed for comparative analysis. The results indicate that the experimental high-temperature deformation data of MnS are highly reliable. In the process of matrix deformation, the shapes of MnS inclusions change from spherical to ellipsoidal and even to lamellar. There are some differences in the morphological deformation of MnS inclusions located at different positions. With the increase in the initial size of MnS inclusions, the risk of failing the inclusion-flaw inspection increases and the forging quality further deteriorates.
Trans. Nonferrous Met. Soc. China 28(2018) 2082-2093
Miao JIN1, Lin-lin YU2, Xin-gang LIU1, Bao-feng GUO1
1. Key Laboratory of Advanced Forging & Stamping Technology and Science, Ministry of Education, Yanshan University, Qinhuangdao 066004, China;
2. School of Mechanical Engineering, Yanshan University, Qinhuangdao 066004, China
Received 6 July 2017; accepted 28 December 2017
Abstract: A novel method for testing stress�Cstrain curves of non-metallic materials was presented. The high temperature stress�Cstrain curves of MnS were preliminarily obtained and corrected to account for the influence of friction. Using the finite element method, the influence of deformation parameters on the deformation evolution of MnS inclusions was investigated based on the experimental reference data. The corresponding physical experiment was designed for comparative analysis. The results indicate that the experimental high-temperature deformation data of MnS are highly reliable. In the process of matrix deformation, the shapes of MnS inclusions change from spherical to ellipsoidal and even to lamellar. There are some differences in the morphological deformation of MnS inclusions located at different positions. With the increase in the initial size of MnS inclusions, the risk of failing the inclusion-flaw inspection increases and the forging quality further deteriorates.
Key words: inclusion; MnS; stress�Cstrain curve; finite element method; morphology
1 Introduction
A non-metallic inclusion, which is one of the metallurgical defects found inside large forgings, destroys the continuity of metal materials and affects their mechanical properties. This increases risks to the reliability and security of the service structure [1-3]. MnS is a type of non-metallic inclusion found inside large forgings, which is difficult to eliminate using existing metallurgical technology. MnS has good plasticity in forging deformation and exists in the forgings as a banded texture, which is the source of cracks that induce splitting of the matrix and is the main reason for crack propagation. Therefore, in the fields of industrial production of large forgings, ATKINSON and SHI [4] have aimed to elevate the metallurgy technology level of large ingots to reduce the non-metallic inclusion content. Moreover, the progress of research in which plastic inclusions are broken and dispersed without causing inclusion-fracturing porosity defects through the forging process has continued.
For a long time, the research on the deformation behavior of inclusion in materials could generally be divided into three categories. The first is experimental investigations. Representative works are as follows: RUDNIK [5], MALKIEWICZ and RUDNIK [6] researched the deformation of non-metallic inclusions during hot working and found a correlation among this deformation, the rolling temperature, and the melting temperature of the inclusions. Furthermore, MAUNDER and CHARLES [7] investigated the deformation behavior during soaking and hot rolling of inclusions in specimens taken from the center of a steel ingot (3.5 t). Similar studies were conducted by BAKER and CHARLES [8]. LOU et al [9] found that the fracture of MnS inclusions periodically varied with the enhancement of the matrix deformation and that MnS inclusions exhibited the highest relative plasticity at a rolling temperature of 900 ��C. Their investigations focused on the determination of the relative plasticity of inclusions by measuring their dimensions. The second category is theoretical work. The finite difference method was used by TUBA [10] in a plane strain analysis that considered a cylindrical rigid inclusion in an elastic�Cplastic matrix with linear strain hardening. Furthermore, a variational semi-analytical approach was presented by GILORMINI and MONTHEILLET [11].
The third category is the use of the finite element method (FEM). The deformation behavior of inclusions in steel during hot rolling has been studied by LOU et al [12,13] using FEM, and the influence of the process parameters on the morphological evolution of inclusions has been also investigated. Similar studies have also been conducted by YU et al [14,15]. However, because of the physical properties of inclusion without experimental data, some assumptions lacking a theoretical or experimental basis were applied in the study, which involved hot deformation parameters of non-metallic inclusions.
To accurately describe the hot deformation behavior of MnS, it is necessary that the basic data for high- temperature deformation of MnS are directly measured by experiment. Thus, a method to measure the high temperature stress�Cstrain curves of MnS was presented herein, and hot compression experiments of MnS cylinder specimens were conducted on a Gleeble thermo- mechanical simulator. High temperature stress�Cstrain curves of MnS inclusions were obtained using this method and were applied to the FEM simulation for MSC Marc software. Next, the influence of the forging process parameters on the deformation status of MnS inclusions was analyzed. And corresponding physical tests were carried out.
2 Experimental
2.1 Compression specimen and experimental equipment
MnS cylindrical specimens of 10 mm in diameter and 15 mm in length were prepared by hot pressing sintering using industrial-grade MnS powders as raw materials. MnS specimens had a relative density of 93.93% and an apparent porosity of 4.90%. The phase of MnS specimens was a pure phase of ��-MnS, which is the same as the phase structure of MnS inclusions in steel [16]. Cylindrical MnS specimens had high density and high strength for powder combination.
The Gleeble-3500 thermo-mechanical simulator was the main experimental equipment. To solve the problem caused by the non-conductivity and non- weldability of the MnS specimens, the heating and pressuring device was specially designed and manufactured, as shown in Fig. 1. The device comprised a stainless steel tube, a graphite tube, and two sections of anvils placed at both ends of the two tubes. The specimen was placed centrally in the space, which comprised the graphite tube and two anvils, and was clamped by the two anvils. The thermocouple to measure temperature, which was shown as K1, was welded onto the cylindrical surface of the steel anvil.
2.2 Temperature calibration and experimental procedure
To precisely control the deformation temperature of MnS specimens, the temperature relationship of the heating process between the MnS specimen and the experimental anvil (thermocoupled solder joints) was demarcated. Two groups of K-type thermocouples were welded to the anvil and the specimen at the positions indicated in Fig. 1, to measure the temperature changes of the anvil and the core section of the specimen, labeled as K1 and K2, respectively. The specimen was heated to the preset temperature of 1100 ��C at a heating rate of 55 ��C/min and held for 10 min.

Fig. 1 Heating and pressuring device for MnS specimens
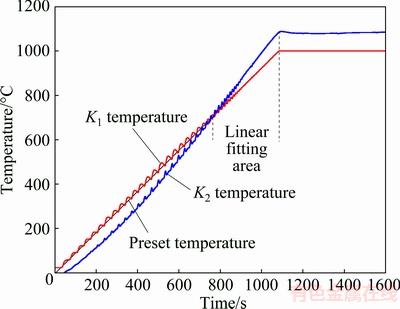
Fig. 2 Test results of temperature change between MnS specimen and anvil
Figure 2 shows the experimental results of the temperature changes between the specimen and the anvil. The temperature control of the experimental equipment is good because the curves of the K1 temperature and preset temperature are coincident. However, the K2 temperature is different from the preset temperature. At the start of heating, the K1 temperature is higher than the K2 temperature, and the difference decreases with increasing preset temperature. When the preset temperature reaches 707 ��C or the heating time equals 765 s (labeled as t0), the three temperature curves intersect. When the preset temperature is in the range of 707-1000 ��C, the K1 temperature is lower than the K2 temperature and the difference increases with increasing the preset temperature. The maximum difference is approximately 90 ��C. After the preset temperature reaches 1000 ��C, the K1 temperature is still lower than the K2 temperature, and the temperature difference remains at 90 ��C.
When the preset temperature is in the range of 707-1000 ��C, the K1 and K2 temperatures show a linear relationship with the heating time. Equations (1) and (2) are obtained through linear regression. The inter- section-point temperature of two data curve-fitting formulae is 713 ��C. Hence, according to these formulae, the relationship between the K1 and K2 temperatures above 713 ��C can be calculated, as shown in Eq. (3).
K1 = 0.918t+4.418 (Correlation coefficient R = 0.9991) (1)
K2 =1.202t-212.291 (Correlation coefficient R=0.9990) (2)
K1=0.764K2+166.597 (K1 >713 ��C) (3)
During the hot compression experiment, high temperature lubricant was applied and graphite papers were placed onto both ends of the specimens to decrease friction effects and ensure the uniformity and stability of deformation. After the atmosphere of argon was provided, MnS specimens were heated by heat conduction and heat radiation. The MnS specimens were heated to the deformation temperatures of 1150, 1200 and 1250 ��C at a rate of 55 ��C/min and held for 5 min. They were then subjected to compressive deformation at strain rates of 0.01, 0.001 and 0.0001 s-1. The true strain was approximately 0.16. After compression, the specimens were slowly cooled to room temperature.
2.3 Stress�Cstrain curves of MnS at high temperatures
Figure 3 shows the stress�Cstrain curves for MnS at high temperatures. The data curves have been smoothened. During the hot compression process of MnS specimens, the stress�Cstrain curves show three stages: (1) an initial increase and then decrease, (2) a second increase and then decrease, and (3) a tendency to stabilize. In the early stage of the deformation process, the stress value increases with the increase of the strain. When the strain value reaches a certain value, the stress value will be reduced. In the middle stage of the deformation process, the stress value again increases with the increase of the strain; in addition, the rate of stress increment first increases and then decreases. After the stress value reaches its peak value, it decreases with increasing strain. In the late stage of the deformation process, the stress tends to maintain steady-state values.
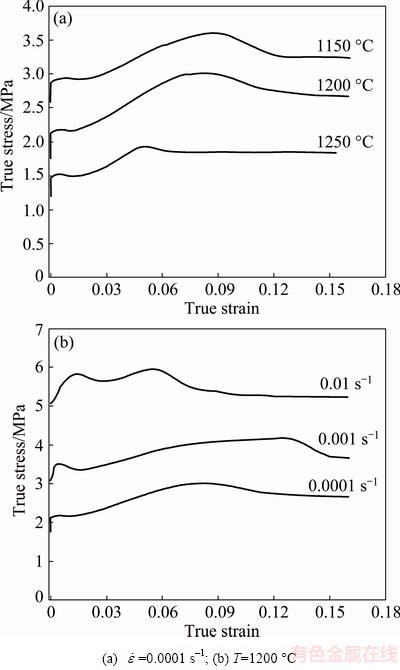
Fig. 3 Stress�Cstrain curves of MnS specimens under different conditions
With increasing deformation temperature and decreasing strain rate, the stress values of MnS decrease. When the stress remains in a steady state and the strain rate equals 0.0001 s-1, the stress values are approximately 3.24, 2.67, and 1.84 MPa at deformation temperatures of 1150, 1200, and 1250 ��C, respectively. When the deformation temperature equals 1200 ��C, the stress values are approximately 5.22, 3.51, and 2.67 MPa at strain rates of 0.01, 0.001, and 0.0001 s-1, respectively. As evident in Fig. 3, the high-temperature deformation of MnS is strongly influenced by both deformation temperatures and strain rates. The stress value required for MnS material deformation at high temperatures is generally less than that of the metal materials for large forgings. The value of high temperature tensile stress of 30Cr1Mo1V steel, which is used to manufacture the rotor forging, is approximately 60 MPa [17]. This also means that MnS inclusions can deform with the matrix as plastic inclusions.
2.4 Correction of stress�Cstrain curves
It is well known that the interfacial friction between the specimen and anvils will affect the symmetrical deformation of the specimens [18]. In practice, although lubricants and graphite papers were used to reduce the friction, the influence of friction between the specimen and anvils increases with the increase of the degree of deformation, until the interfacial friction becomes progressively more evident and leads to more serious asymmetry of deformation. Figure 4 shows photos of the specimens deformed under different conditions. Because of the influence of the interfacial friction, the specimens experience a barreling phenomenon. The measured true stress cannot accurately reflect the reality of the MnS specimen plastic deformation. Therefore, the measured flow stress should be corrected by considering the effects of interfacial friction.
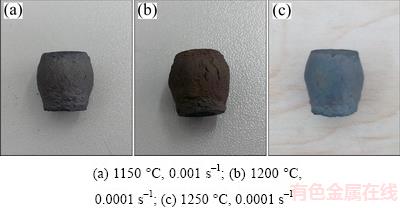
Fig. 4 Morphology photos of MnS specimens deformed under different conditions
A simple representation of a solid compression experiment is shown in Fig. 5. Here, h is the height of the deformed specimen; RM and RT are the maximum radius and the top radius of the deformed specimen, respectively; and h0 and R0 are the initial height and radius of the specimen, respectively.
Considering the friction factor, the deforming force ��f derived from the principal stress method is shown as follows [19]:
 (4)
(4)
where F is the instantaneous load during the experiment; R and h are instantaneous radius and height of specimens, respectively; and m is the friction factor. The stress �� and strain �� are calculated by gathering the instantaneous load and displacement. They are calculated as follows:
 (5)
(5)
 (6)
(6)
According to Eqs. (4)-(6), the formula corrected for the influence of friction on the flow stress in the compression process can then be deduced as follows:
 (7)
(7)
Based on the upper-bound theory found in the study of EBRAHIMI and NAJAFIZADEH [20], an equation to calculate the value of m is investigated. Under the cylindrical coordinate system, the barreling shape is assumed to be a period of arc for a circle. Through the description of the velocity field, the friction factor can be reversely calculated on the basis of the height and diameter of the compressed specimen. Thus, the friction factor m can be expressed as follows:
 (8)
(8)
 (9)
(9)
 (10)
(10)
where Rave is the average radius of specimens after deformation.
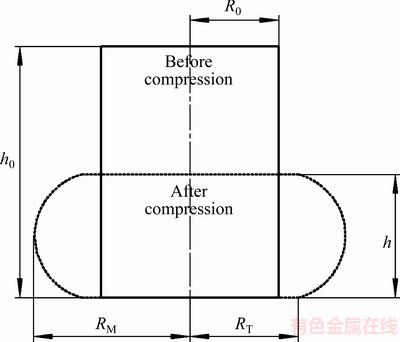
Fig. 5 Simple representation of solid compression experiment
The height, maximum radius and top radius of deformed specimens were measured, and the stress�C strain curves were modified by Eq. (7). The results are shown in Fig. 6. It is obvious that the measured flow stress is higher than the corrected one. Furthermore, with the increase of the deformation degree, the differences between the measured flow stress and the corrected one are much larger. When the strain rate is equal to 0.0001 s-1 and the strain is approximately 0.16, the stress differences corresponding to deformation temperatures of 1150, 1200, and 1250 ��C are 0.16, 0.11, and 0.06 MPa and the relative differences are 4.90%, 4.05%, and 3.47%, respectively. When the deformation temperature is equal to 1200 ��C and the strain is approximately 0.16, the stress differences corresponding to strain rates of 0.01, 0.001, and 0.0001 s-1 are 0.41, 0.26, and 0.11 MPa and the relative differences are 7.92%, 7.45%, and 4.05%, respectively. The effect of the friction is less obvious with increasing deformation temperature and decreasing strain rate.
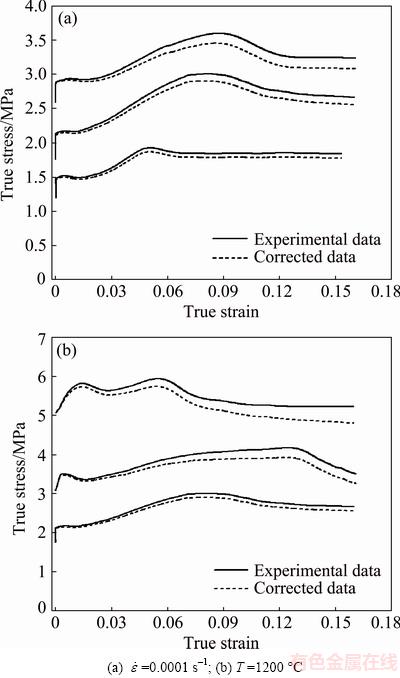
Fig. 6 Stress�Cstrain curves after correction due to friction under different conditions
3 FEM simulation
3.1 Modeling of FEM
Finite element method is one of the effective means to analyze the plastic deformation of metal [21,22]. The upsetting process of a cylinder billet was investigated as a case. Considering the billet shape and load distribution, the simulation specimen of 1/4 was modeled using MSC Marc software. The schematic of the upsetting process for the simulation specimen is shown in Fig. 7, where x-axis is the radial direction, y-axis is the circumferential direction, and z-axis is the axial direction of the billet. The simulation specimens were cylindrical specimens that were 8 mm in diameter and 12 mm in length; they had the same size as the specimens used in subsequent physical experiments. The initial diameters of the MnS inclusions (D0), which were assumed to be standardly spherical, were 10, 20, 30, 40, and 50 ��m. Seven MnS inclusions were installed in different positions of the matrix xz profile, with location coordinates of O(0, 0, 0), A((1/3)L0, 0, 0), B((2/3)L0, 0, 0), C(0, 0, (2/5)H0), D((1/3)L0, 0, (2/5)H0), E(0, 0, (4/5)H0), and F((2/3)L0, 0, (4/5)H0).
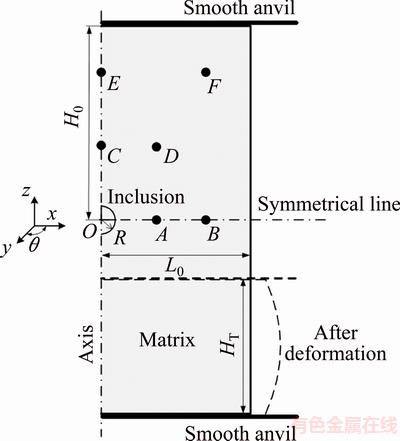
Fig. 7 Schematic diagram of upsetting process for simulation specimen
In the finite element simulation, the body cell model [23] was applied to solving the scale gap problem between the inclusions and the matrix. The matrix material was 304L stainless steel. The inclusions were MnS, and the high temperature stress�Cstrain curves that are required for a constitutive model are shown in Fig. 6. The other material property parameters for the matrix and inclusions used in the FEM models are shown in Table 1.
Table 1 Material parameters in upsetting process for matrix and inclusion
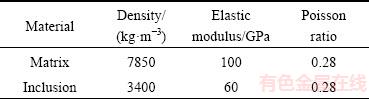
When the FEM model was established, the contact relationship between the matrix and the inclusion was said to be ��touching��. The shear-friction model was applied. The friction coefficients between the matrix and inclusions and between the matrix and flat anvil were 0.15 and 0.5, respectively [24]. The influences of deformation temperature of the specimen and velocity of the flat-anvil were not considered in this study. For the simulation, the deformation temperature was set to be 1200 ��C, and the flat-anvil velocity in the -z direction was 0.1 mm/s. The maximum deformation degree was 60%, so that the billet was pressed to a height of 4.8 mm. The upset anvil was modeled as a rigid body.
3.2 Evolution of inclusion morphology
Figure 8 shows the contour of the MnS inclusion located at the core of the matrix at different deformation rates, simplified as Dr, when the initial diameter was 30 ��m. The inclusion extended along the radial and circumferential directions and the size of the inclusion increased with the increase of the matrix deformation rate. However, the inclusion was compressed along the axial direction, and the thickness of the inclusion was reduced. Since the inclusion was located at the core of the matrix, the strain states of the x and y directions were positive and that of the z direction was negative. The contour of the MnS inclusion in the xy profile was still circular, and the diameter of inclusion gradually increased with the increase of the deformation rate. When the deformation rate reached 60%, the radial and circumferential lengths changed to 56.9 ��m and the axial length was reduced to 19.1 ��m. The three-dimensional shape of the MnS inclusion gradually changed from a spherical shape to an ellipsoidal shape, eventually reaching a lamellar shape, i.e., a higher deformation rate increased the possibility of a flaky inclusion, forming a potential crack in the center of forging.
At a deformation rate of 60%, the contours of MnS inclusions for a variety of inclusion positions are shown in Fig. 9. In the deformed billet, three deformation zones exist due to different deformation degrees, including the large deformation zone, the small deformation zone, and the difficult deformation zone [25]. When the deformation rate is 60%, the shape and size of inclusions at positions O, A, C, and D are basically the same and are located in the large deformation zone. The axial height of inclusion at position B in the small deformation zone basically equals that of the inclusions located in the large deformation zone. The circumferential length of inclusion at position B is longer than the radial length because the deformation degree of the circumferential direction is greater than that of the radial direction.
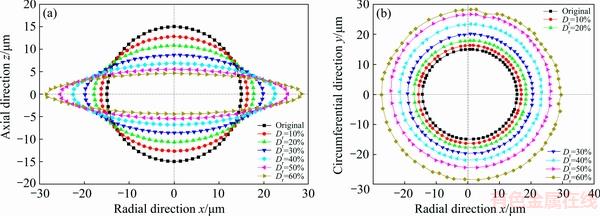
Fig. 8 MnS inclusion contours in xz (a) and xy (b) profiles for 30 ��m inclusion
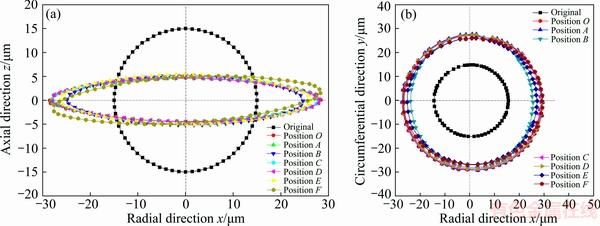
Fig. 9 MnS inclusion contours in xz (a) and xy (b) profiles at different positions
Compared with the inclusion shapes in the large deformation zone, the axial height of inclusion at position E is larger whereas the circumferential and radial lengths are smaller in the difficult deformation zone. Inclusion at position F is located at the junction of the large and difficult deformation zones, where movement is parallel to the interface occurred. Thus, the shape of inclusion at position F reverses; its circumferential length must be less than the radial length for the xy profile, which shows that the circumferential deformation of the matrix is less than the radial deformation. This is in complete contrast to the deformation characteristics of the small deformation zone.
To better analyze the influence of inclusion sizes on the deformation of inclusions, the scaled profile of inclusions was employed based on the relationship of the initial diameters of different inclusions. Figure 10 shows the contours of MnS inclusion for different sizes of D0 after deformation. When the deformation rate is 60%, all the inclusion contours with different sizes have circular xy profiles; however, their proportions are different. The inclusions have similar shapes and generally the same size when their initial diameters are between 20 and 40 ��m. However, this deformation is significantly less when the initial diameter is less than 10 ��m. Furthermore, the larger the inclusion diameter is, the greater the degree of inclusion deformations is. Thus, the contour of an inclusion of a diameter of 50 ��m is more prolate.
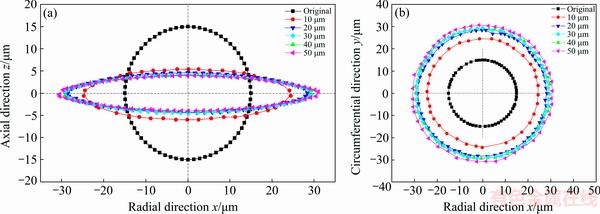
Fig. 10 MnS inclusion contours in xz (a) and xy (b) profiles with different initial diameters
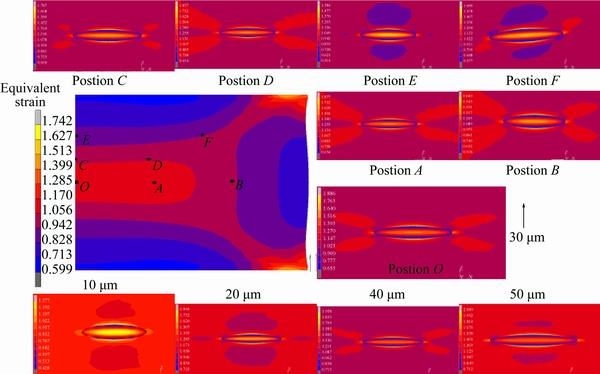
Fig. 11 Contours of equivalent strain distribution of matrix and inclusion in different deformation zones with different initial diameters in xy profile
The equivalent strain distribution of the matrix and inclusion in different deformation zones with different initial diameters is shown in Fig. 11. The strain value in the high strain zone located at the inclusion heart is greater than that of the inclusion surface. This is in accordance with the results found in Ref. [26]. Equivalent strain concentration areas for the matrix exist at the end of the long axis of elliptical inclusion. The strain value for the matrix at the end of the short axis of elliptical inclusion is greater that than for other areas. When inclusions at positions O, A, C, D, and E are found in the large and difficult deformation zones, the equivalent strains of the inclusions and matrix are symmetrically distributed for the x and z axes and are butterfly shaped. However, the equivalent strain is only symmetrically distributed for the x axis when inclusion at position B is found in the small deformation zone. In addition, the strain value of the inner matrix is greater than that of the lateral matrix. The shape of inclusion at position F is reversed for an angle of 10��, for which the distribution of the equivalent strain changes. The more prolate the inclusion shape is, greater the strain concentration is.
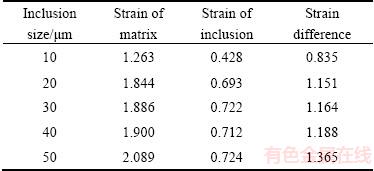
The sizes of the inclusions have less influence on the distribution of equivalent strain; however, they have an important influence on the maximum strain value of the matrix and inclusions. Table 2 shows the maximum and the minimum strains and strain gradient between the inclusions and the matrix for a variety of inclusion sizes. When the inclusion diameter is 50 ��m, the difference in the strain between the inclusion and the matrix reaches 1.365. Thus, the forging quality deteriorates with increasing inclusion sizes.
Table 2 Strain gradient between inclusion and matrix with different inclusion sizes
4 Verification of MnS inclusion evolution
Next, 304L stainless steel with no rust and no oil was prepared as a base material. Balanced amounts of electrolytic manganese and ferrous sulfide were also prepared as auxiliary materials. The molar ratio of elemental Mn and S was controlled to be 9:1. Using a medium frequency vacuum induction melting furnace (25 g), all the above mentioned raw materials were melted at a high temperature under atmospheric conditions. Neither slagging nor the deoxidization process was observed [27]. Electromagnetic stirring was conducted for 5 min, and then, the liquid steel was cast into a cooling crucible and cooled naturally in the furnace. In this experiment, the cooling crucible was composed of two crucibles of different dimensions. To reduce the solidification rate of the liquid steel and thus promote the formation of large MnS inclusions, asbestos fibers, which performed an insulation role, were placed into the space between the two crucibles.
The distribution of MnS inclusions in the specimens prepared from the ingot was observed via scanning electron microscopy (SEM), as shown in Fig. 12(a). In the specimen, the section morphologies of MnS inclusions are circular and the maximum sizes of the MnS inclusions are in the range of 15-20 ��m. The elements in the inclusions were measured with an energy dispersive spectrometer (EDS), as shown in Fig. 12(b). The main elements found in inclusions were Mn and S, with a molar ratio of approximately 1:1. This indicates that the inclusions are MnS inclusions.
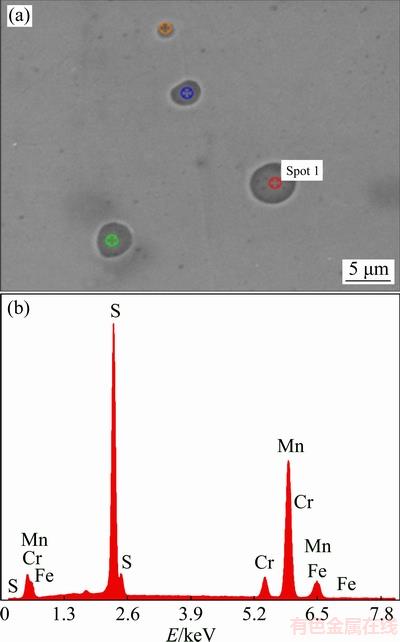
Fig. 12 SEM image (a) and EDS analysis (b) of spot 1 in (a) of MnS inclusion in ingot
Cylindrical specimens with a diameter of 8 mm and a length of 12 mm were machined from the ingot. The specimens were heated to the deformation temperature of 1200 ��C at a heating rate of 10 ��C/s on the Gleeble-3500 thermo-mechanical simulator and held for 3 min. The specimens were compressed at a strain rate of 0.001 s�C1 and various deformation rates in the range of 10%-60% at intervals of 10%. The specimens were cut longitudinally, polished, and observed for the deformation of MnS inclusions using an optical microscope.
At the geometric center of the specimen section, two axial lengths of the inclusion profile, which are found in the region of the diameter of 0.2 mm, were measured and recorded. The area of the region is small and the equivalent strain values of the region are basically equal, which results in the same conclusion as that found in Fig. 11. Thus, it can be asserted that the evolution of the MnS inclusion in this region is the same. It is assumed that the measured radial length equals the circumferential length of the deformed MnS inclusion. The volumes of different MnS inclusions deformed were calculated. The initial diameters (D0) were also calculated because the volumes of the MnS inclusions remained constant.
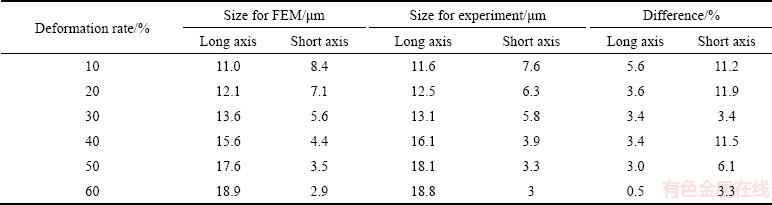
The cross-sectional shapes of these experiments and FEM were compared for MnS inclusions with an initial diameter of 10 ��m (Table 3). The corresponding sizes for FEM and the experiment are listed in Table 4. The cross-sectional shapes of MnS inclusions change from round to elliptical, finally reaching a zonary shape. As the deformation rate increases, the evolution results of the MnS inclusions from the numerical simulations are in good agreement with the experimental results. In the deformation process, cracks do not appear between the inclusions and the matrix whose bonding strength is high, and uniform deformation occurs. The difference in the size values from FEM and experiment for the long and short axes are less than 12%. These results indicate that the FE simulation results based on the MnS high-temperature stress�Cstrain data exhibit high reliability.
5 Discussion
As typical plastic inclusions, MnS inclusions have good plasticity in deformation processes and can extensionally deform along the deformation direction of the substrate material and form a banded texture. They are not only the crack source that induces matrix splitting but also the main reason for failing the inclusion-flaw inspection in large forgings. To analyze the evolution of MnS inclusions, the lengths of the long and short axes of elliptic MnS inclusions are measured and marked as a, b, and c for the x, y, and z directions, respectively. Considering the morphology evolution characteristics of MnS inclusions and the flaw detection standard of large forgings, the shape index of inclusion is applied to describing the evolution of the MnS inclusions.
Table 3 Cross-sectional shape evolution of MnS inclusions at different deformation rates
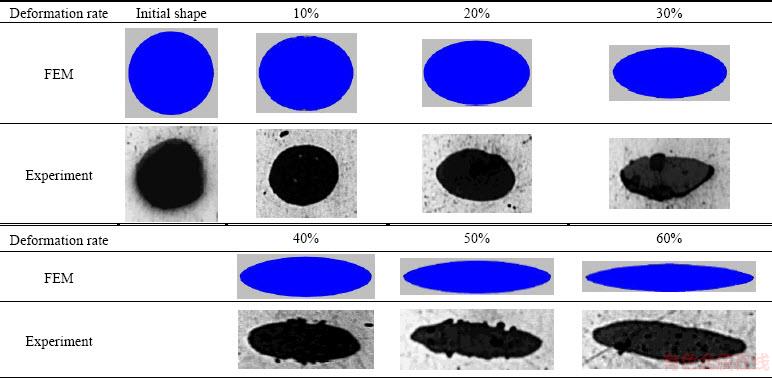
Table 4 Comparison of sizes of MnS inclusions for FEM and experiment
The shape indices of an inclusion on the xz and xy profiles are defined as ��x and ��y, respectively, as follows: ��x=a/c and ��y=b/c. The shape index can be used to describe the deformation degree of an inclusion. The larger the �� value is, the more prolate the inclusion shape is.
Figure 13 shows the influence of the deformation rate on the shape index. Since the inclusion is located at the geometric center of the matrix, the sizes of a and b are equal after deformation and the curves of the inclusion shape index are superposed. As shown in Fig. 13, the shape indices of inclusions with different initial diameters gradually increase and the rate increases, which is given by the slope of the curve, progressively increases with the increase of the deformation rate. This indicates that the greater the deformation degree for the upsetting process is and the more prolate the inclusion shape is, the greater the risk of failing the inclusion-flaw inspection is. The inclusion shape index �� increases with the increase of the initial diameter D0 at a deformation rate of 60%. The influence of the initial diameter on the shape index is also shown in Fig. 13. These results show that the improvement of the metallurgical level and the diminishment of an inclusion��s initial diameter can effectively reduce the risk of failing the inclusion-flaw inspection.
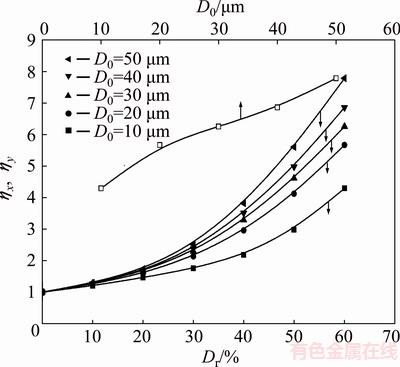
Fig. 13 Influence of deformation rate (Dr) and initial diameter (D0) on shape index (��x, ��y) of MnS inclusions
The values of a and b are not necessarily equal for inclusions of different positions. Taking the curve of ��x for example, the influence of the inclusion position on the shape index is analyzed, as shown in Fig. 14.
The inclusion shape indices gradually increase for different positions with the deformation rate. The deformation of the matrix is so inhomogeneous that the shape index is larger for the inclusion located in the large deformation zone and smaller for the inclusion located in the difficult deformation zone. The difference between the values for the two zones is small, which is less than 3%. The inclusion shape indices are smaller for the small deformation zone and the transition zone, and different shape indices of inclusions for these two zones are larger. Furthermore, the positive and negative values of the shape index values, whose maximum values are 5.1% and 11.52%, respectively, are not equal. At a deformation rate of 60%, the value of the shape index is in the range of 5.93-6.25 for the inclusion in the large deformation zone, whereas the values of difficult deformation zones and the other areas are 5.8 and in the range of 4.76-5.05, respectively. The deformation degree of the matrix metal in the large deformation zone is larger, and it improves the inclusion deformation degree and the risk of failing the inclusion-flaw inspection.
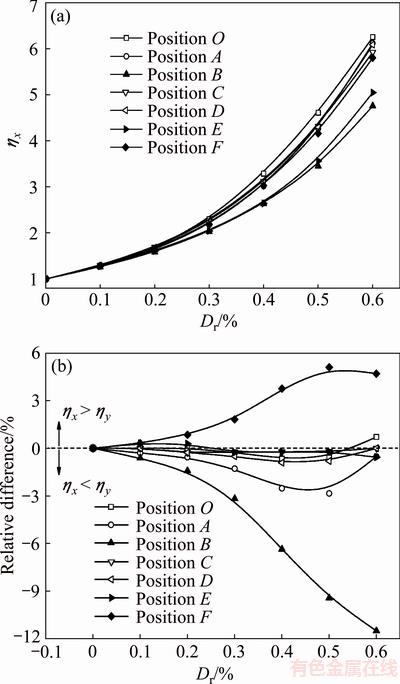
Fig. 14 Influence of inclusion position on shape index (a) and its relative difference (b) of MnS inclusions
According to this study, the MnS inclusions are synchronously deformed with the steel matrix. The bonding state at the inclusion/matrix interface is perfect, and the gap between the inclusion and matrix does not exist. The contour of the inclusion changes from a circle to an ellipse on different profiles (Figs. 8-10). The following ellipsoid equation is proposed to describe the shape change of the inclusion during the upsetting process:
 (11)
(11)
 (i=1,2,3) (12)
where the initial radius of inclusion r0=0.5D0; fi(Dr) is the exponential function of the deformation rate Dr as the independent variable. The data between the values of a, b, and c and the deformation rate Dr are conducive to an exponential function. The constant values of Eq. (12) are obtained. For example, the initial diameter of the MnS inclusion is 30 ��m at position O of the matrix, and the parameters are as follows: r0=15 ��m, mi=0.489, 0.589, and 1.299, ni=1.753, 1.555, and -1.332, and si=0.504, 0.400, and -0.292, respectively.
In the upsetting process, MnS inclusions in the matrix are compressed into the slice layer and the deformed area perpendicular to the main deformation direction of matrix is greatly increased. This destroys the continuity of the ingot metal material. If this type of lamellar inclusion is not effectively dispersed, it will likely exceed the standard of ultrasonic flaw detection.
6 Conclusions
1) The high-temperature stress�Cstrain curves of MnS inclusions were preliminarily obtained through physical experiment and modified to consider the friction correction. These were then applied to the FEM model. The MnS deformation state revealed by FEM simulation results was verified through physical experiments.
2) With an increase in the forging deformation rate, MnS inclusions elongated along the radial direction and circumferential direction of the billet but compressed along the axial direction of the billet. The shape of the MnS inclusions changed from spherical to ellipsoidal and even to lamellar. The shape index of MnS inclusions gradually increased. It is possible that lamellar inclusions form as the potential crack source in forging.
3) The deformed inclusion shapes are different at different positions. The strain distribution is also different near the inclusion and matrix. In the forming process of large forging, it is necessary to actively break plastic inclusions in the forging core and disperse them by the forging process. It is also necessary to avoid the formation of lamellar inclusions.
4) The inclusion shape index and the non-uniform deformation around the inclusions increase with the increase of the initial size of inclusions. When the initial diameter of a MnS inclusion is equal to 50 ��m, the equivalent strain difference between the matrix and the inclusion reaches 1.365; under these conditions, the quality of forging will deteriorate with increasing inclusion size.
References
[1] LIANG Min-jie, WU Guo-hua, DING Wen-jiang, WANG Wei. Effect of inclusion on service properties of GW103K magnesium alloy [J]. Transactions of Nonferrous Metals Society of China, 2011, 21: 717-724.
[2] MATSUMIYA T. Recent topics of research and development in continuous casting [J]. ISIJ International, 2006, 46: 1800-1804.
[3] MA Qing-xian, WANG Zhi-cheng, ZHONG Yue-xian. The mechanism of faults originating from inclusions in the plastic deformation processes of heavy forging [J]. Journal of Materials Processing Technology, 2002, 123: 61-66.
[4] ATKINSON H V, SHI G. Characterization of inclusions in clean steels: A review including the statistics of extremes methods [J]. Progress in Materials Science, 2003, 48: 457-520.
[5] RUDNIK S. Discontinuities in hot-rolled steel caused by non-metallic inclusions [J]. Journal of the Iron and Steel Institute, 1966, 204: 374-376.
[6] MALKIEWICZ T, RUDNIK S. Deformation of non-metallic inclusions during rolling of steel [J]. Journal of the Iron and Steel Institute, 1963, 201: 33-38.
[7] MAUNDER P H J, CHARLES J A. Behavior of non-metallic inclusions in a 0.2% carbon steel during hot rolling [J]. Journal of the Iron and Steel Institute, 1968, 206: 705-715.
[8] BAKER T J, CHARLES J A. Deformation of MnS inclusions in steel [J]. Journal of the Iron and Steel Institute, 1972, 210: 680-690.
[9] LOU De-chun, CUI Kun, WU Xiao-chun, ZHOU Feng-yun. Behavior of MnS inclusion during hot deformation [J]. Journal of Iron and Steel Research, 1996, 8: 11-14. (in Chinese)
[10] TUBA S. Elastic-plastic analysis of a flat plate with a circular rigid inclusion [J]. Applied Scientific Research, 1966, 16: 241-255.
[11] GILORMINI P, MONTHEILLET F. Deformation of an inclusion in a viscous matrix and induced stress concentrations [J]. Journal of the Mechanics and Physics of Solids, 1986, 34: 97-123.
[12] LUO C H, STAHLBERG U. Deformation of inclusions during hot rolling of steels [J]. Journal of Materials Processing Technology, 2001, 114: 87-97.
[13] LUO C H. Evolution of voids close to an inclusion in hot deformation of metals [J]. Computational Materials Science, 2001, 21: 360-374.
[14] YU Hai-liang, BI Hong-yun, LIU Xiang-hua, CHEN Li-qing, DONG Ni-ni. Behavior of inclusions with weak adhesion to strip matrix during rolling using FEM [J]. Journal of Materials Processing Technology, 2009, 209: 4274-4280.
[15] YU Hai-liang, LIU Xiang-hua, BI Hong-yun, CHEN Li-qiang. Deformation behavior of inclusions in stainless steel strips during multi-pass cold rolling [J]. Journal of Materials Processing Technology, 2009, 209: 455-461.
[16] QI Rong-sheng, JIN Miao, GUO Bao-feng, LIU Xin-gang, CHEN Lei, JING Yang-duan. Preparation of MnS hot compressed specimens and measurement of high temperature stress-strain curves [J]. Journal of the Chinese Ceramic Society, 2015, 43: 1271-1276. (in Chinese)
[17] LIU Xin-gang, MENG Dong-ning, WANG Yu-hui, CHEN Huan, JIN Miao. Influences of high-temperature diffusion on the homogenization and high-temperature fracture behavior of 30Cr1Mo1V [J]. Journal of Materials Engineering and Performance, 2015, 24: 1079-1085.
[18] LIN Y C, XIA Y C, CHEN X M, CHEN M S. Constitutive descriptions for hot compressed 2124-T851 aluminum alloy over a wide range of temperature and strain rate [J]. Computational Materials Science, 2010, 50: 227-233.
[19] PENG Ning-qi, TANG Guang-bo, LIU Zheng-dong. Correcting method of flow stress curve of hot compression [J]. Hot Working Technology, 2012, 41: 12-15.
[20] EBRAHIMI R, NAJAFIZADEH A. A new method for evaluation of friction in bulk metal forming [J]. Journal of Materials Processing Technology, 2004, 152: 136-143.
[21] YANG Xia-wei, ZHU Jing-chuan, LAI Zhong-hong, LIU Yong, HE Dong, NONG Zhi-sheng. Finite element analysis of quenching temperature field, residual stress and distortion in A357 aluminum alloy large complicated thin-wall workpieces [J]. Transactions of Nonferrous Metals Society of China, 2013, 23: 1751-1760.
[22] HU Hong-jun. Grain refinement of Mg-Al alloys by optimization of process parameters based on three-dimensional finite element modeling of roll casting [J]. Transactions of Nonferrous Metals Society of China, 2013, 23: 773-780.
[23] QI Rong-sheng, KANG Dong, JIN Miao, GUO Bao-feng, LIU Xin-gang. Multi-scale simulation method of evolution behavior of internal defect in large forgings [J]. China Mechanical Engineering, 2015, 26: 2821-2826. (in Chinese)
[24] LI Rong-jiu. Ceramic�Cmetal complex materials [M]. Beijing: Metallurgical Industry Press, 1995. (in Chinese)
[25] YAO Ze-kun. Forging technology and die design [M]. 2nd ed. Xi��an: Northwestern Polytechnical University Press, 2007. (in Chinese)
[26] YU Hai-liang, BI Hong-yun, LIU Xiang-hua, TU Yan-feng. Strain distribution of strips with spherical inclusion during cold rolling[J]. Transactions of Nonferrous Metals Society of China, 2008, 18: 919-924.
[27] XIA Yun-jin, WANG Fu-ming, WANG Jin-long, ZHAO Jing. Effect of oxygen content on the formation behavior of sulfides in free-cutting steel [J]. Journal of University of Science and Technology Beijing, 2010, 32: 1271-1276. (in Chinese).
�� ��1��������2�����θ�1��������1
1. ��ɽ��ѧ �Ƚ���ѹ���μ������ѧ�������ص�ʵ���ң��ػʵ� 066004��
2. ��ɽ��ѧ ��е����ѧԺ���ػʵ� 066004
ժ Ҫ�����һ�ַǽ������ϸ���Ӧ��-Ӧ�����߲��Է�������������õ�MnS����Ӧ��-Ӧ���������ݽ���Ħ���������ڴ˻�������������Ԫ�����������о����β�����MnS�������ݱ��Ӱ�죬�������Ӧ����ʵ����жԱȷ��������������ʵ�鷽�����MnS���±��������нϸߵĿɿ��ԡ��ڻ�����ι����У�MnS��������״����״��Ϊ�������Ρ�ֱ��Բ��Ƭ״���һ��岻ͬλ�ô���������κ����ò��ͬ������MnS�������ʼ�ߴ�����ӣ�̽�˼�ⲻͨ���������ͼ���������֮��
�ؼ��ʣ������MnS��Ӧ��-Ӧ�����ߣ�����Ԫ������ò
(Edited by Wei-ping CHEN)
Foundation item: Projects (51575475, 51675465) supported by the National Natural Science Foundation of China
Corresponding author: Bao-feng GUO; Tel: +86-335-8056775; E-mail: guobfysu@163.com
DOI: 10.1016/S1003-6326(18)64852-6

