���ڷ��������Ľ����ڻ���������Եij�������
��Դ�ڿ����й���ɫ����ѧ��(Ӣ�İ�)2013���10��
�������ߣ��� �� �ƽ��� ��Ң�� ��ѧ��
����ҳ�룺3145 - 3152
�ؼ��ʣ������ڻ�����������ԣ��������ԣ�MF-DCCA���������ط��Σ��������������ط�����
Key words��metal futures; price-volume correlation; long memory; MF-DCCA method; multifractal; fractal features; multifractal spectrum
ժ Ҫ������MF-DCCA���������ҹ������ڻ��г���������ԵĶ��ط��������ͳ���������������ʵ֤���顣��������ҹ������ڻ����۹�ϵ�����ž���һ��ʱ�����ij�������������ͨ��������������Դ��ڶ��ط���������ԭ��һ��֤���ҹ������ڻ��г���������Դ��ڳ��������������ط��������ͳ������ԵĴ�����ζ�Ž������г������Լ������ķ��������ۺͷ������뵽���ҹ������ڻ��г���Ϊ�ķ�����������Ҫ����ʵ���塣
Abstract: An empirical test on long memory between price and trading volume of China metals futures market was given with MF-DCCA method. The empirical results show that long memory feature with a certain period exists in price-volume correlation and a further proof was given by analyzing the source of multifractal feature. The empirical results suggest that it is of important practical significance to bring the fractal market theory and other nonlinear theory into the analysis and explanation of the behavior in metal futures market.
Trans. Nonferrous Met. Soc. China 23(2013) 3145-3152
Hui CHENG1,2, Jian-bai HUANG1,2, Yao-qi GUO2,3, Xue-hong ZHU1,2
1. School of Business, Central South University, Changsha 410083, China;
2. Institute of Metal Resources Strategy, Central South University, Changsha 410083, China;
3. School of Mathematics and Statistics, Central South University, Changsha 410083, China;
Received 10 May 2013; accepted 18 September 2013
Abstract: An empirical test on long memory between price and trading volume of China metals futures market was given with MF-DCCA method. The empirical results show that long memory feature with a certain period exists in price-volume correlation and a further proof was given by analyzing the source of multifractal feature. The empirical results suggest that it is of important practical significance to bring the fractal market theory and other nonlinear theory into the analysis and explanation of the behavior in metal futures market.
Key words: metal futures; price-volume correlation; long memory; MF-DCCA method; multifractal; fractal features; multifractal spectrum
1 Introduction
Price and trading volume have always been the important indexes for the evaluation of futures markets. The changes of prices have reflected the market��s response to new information, while trading volume has manifested the different recognition over new information of investors. A large number of theories and empirical studies have shown that price-volume correlation plays a critical role in helping people to understand the fluctuations of the market and it is helpful for the in-depth understanding of the price transmission mechanism of the market. Therefore, this has always been a hot topic in the financial field.
Currently, research of price-volume relationship mainly covers features such as positive relationship, linear and nonlinear relationship, short-term and long-term correlation. Study on long-term correlation (namely long memory) in price-volume relation is complicated, in which series is nonstationary and nonlinear. Present research examines long memory in time series by studying variables relative to price and volume respectively through statistical analysis [1-3]. Recent years, with the development of fractal theory, autoregressive fractionally integrated moving average (ARFIMA) model, rescaled range (R/S) analysis, modified R/S approach and multifractal detrended fluctuation analysis (MFDFA) approach are newly used in researching long memory of time series. PANAS [4] applied ARFIMA model, R/S approach, modified R/S approach to investigate the price behavior of six base metals in the London Metal Exchange and empirical results in the case of aluminum support the long memory hypothesis. ALVAREZ et al [5] and SERLETIS [6] provided empirical evidence of long memory in crude oil prices with persistent structure by means of R/S approach. TABAK et al [7] found that the oil price volatilities were significantly long range correlated although the degree of correlations seemed to be weaker and weaker using R/S approach. POWER and TURVEY [8] investigated the nature of long memory in the volatility of 14 energy and agricultural commodity futures price series using an improved Hurst estimator. The results showed the evidence of long memory for all 14 commodities and of a non-stationary Hurst coefficient estimator for 9 of 14 commodities. WANG et al [9] investigated the long memory of WTI crude oil volatility series employing MFDFA, and found that for small time scales, the auto-correlations of volatilities are multifractal while for large time scales, the auto-correlations are nearly monofractal. JIA et al [10] examined the multifractal properties of the realized volatility (RV) and realized bipower variation (RBV) series in the Shanghai Stock Exchange Composite Index (SSECI). They indicated that the long term correlation was sensitive to the sampling frequency. QIU et al [11] introduced an instantaneous and an average instantaneous cross-correlation function to detect the temporal cross-correlations between individual stocks based on the daily data of the United States and the Chinese stock markets. Empirical results showed that long memory was observed for the average instantaneous cross-correlations, and persisted up to a month magnitude of timescale for the United States stock market and half a month magnitude of timescale for the Chinese stock market. FLEMING and KIRBY [12] used fractionally-integrated time-series models to investigate the joint dynamics of equity trading volume and volatility. Their results indicated that volume and volatility both display long memory, and a strong correlation between the innovations to volume and volatility, which suggested that trading volume can be used to obtain more precise estimates of daily volatility for cases in which high-frequency returns were unavailable.
Summarizing a variety of papers, there is considerable evidence suggesting that price and trading volume may possess long memory feature. However, studies in the current literature fail to realize that many characteristic variables of financial markets, such as price and volume, are actually spatially and/or temporally correlated, so that they merely discussed these variables individually instead of incorporating them simultaneously and analyzing their cross-correlated relationship. Therefore, the results from the previous researches may be biased for their ignorance of the complex cross-correlations between those highly interacted and correlated variables. Only a few researches considered and analyzed multifractal features of price-volume correlation simultaneously. HE and CHEN [13] applied a new methodology called multifractal detrended cross-correlation analysis (MF-DCCA) to perform an empirical study and found that power-law cross-correlation and multifractal features of price-volume correlations are significant in agricultural commodity futures markets. YUAN et al [14] also found that both Shanghai stock market and Shenzhen stock market showed pronounced long-range cross-correlations between stock price and trading volume by applying MF-DCCA. So, in this work previous results were extended by analyzing long memory of price-volume correlation simultaneously in metal futures market within the MF-DCCA methodological framework and a further proof was given by analyzing the source of multi-fractal feature. Empirical results will help us to further understand and explain the nonlinear relationship and potential dynamics mechanism between price and volume in China metal futures market.
2 Methodology
By combining multifractal detrended fluctuation analysis (MF-DFA) and DCCA approach, MF-DCCA is a technique employed in statistical physics to detect multifractal features of two cross-correlated nonstationary time series [15-17]. Let us briefly introduce the MF-DCCA method.
Suppose that there are two time series x(i) and y(i), i=1, 2, ��, L, where L is the length of series. Then the ��profile�� is determined:
 (1)
(1)
Each profile is divided into m=int(L/s) non-overlapping segments of equal length s. Since the length L of the series is often not a multiple of the given time scale s, a short part at the end of the profile may remain unused. In order not to disregard this part of the series, the same procedure is repeated starting from the opposite end. Thereby, 2m segments are obtained altogether. And then for each of the 2m segments, the local trends are estimated by means of the kth order polynomial fit.
Then the detrended covariance is given by
 (2)
(2)
where  and
and  are the fitting polynomials for each segment v (v=1, 2, ��, 2m). And then the qth order is defined as
 (3)
(3)
When q=0, the limit of Eq. (3) can be given by
 (4)
(4)
If the power-law cross-correlations do exist, the scaling or power-law relationship should be satisfied
 (5)
(5)
The cross-correlation exponent hxy(q) in Eq. (5) can describe the power-law relationship between two spatially or temporally correlated time series. Especially, if the time series x is identical to y, MF-DCCA is equivalent to MF-DFA; and if q=2, the cross-correlation exponent hxy(q) is equivalent to the well-known generalized Hurst exponent.
According to SHADKHOO and JAFARI [18], a similar relationship between classical multifractal scaling exponents ��xy(q) and q can be given by
 (6)
(6)
If ��xy(q) is linear with q, the cross-correlation of the correlated series is monofractal; otherwise, it is multifractal. By means of a Legendre transformation, we can obtain the multifractal spectrum and following relationship:
 (7)
(7)
 (8)
(8)
3 Empirical analyses
3.1 Data
We apply MF-DCCA to investigating the long memory feature of price-volume correlation in China metal futures markets. The data chosen are daily closing prices and trading volumes of Shanghai Futures Exchange (SHFE) in China. That is, data about SHFE copper and aluminum are from 15 September, 1993 to 4 July, 2011 and from 5 October, to 4 July, 2011. The total numbers of the data span L=4203 and 3055, respectively.
3.2 Empirical analyses
This paper gives an empirical analysis of nonlinear dependency and long-memory feature of price-volume correlation in SHFE copper and aluminum metal futures markets. According to Eqs. (1)-(8), numeric area of scale s is from 10 to L/4 (L represents length of time series), while the order of the local regression fitted equation is set at 1.
Figure 1 shows cross-correlation exponent hxy(q) of the price-volume correlation for SHFE copper and aluminum. According to Fig. 1, one can clearly observe that cross-correlation exponent hxy(q) varies with different values of q, which means that different power law correlations do exist between price and trading volume for SHFE copper and aluminum and cross-correlation exponents hxy(q) are dependent on q deeply. This also means that price-volume correlation is multifractal. When q changes from -10 to 10, cross-correlation exponents hxy(q) decrease progressively from 1.3215 to 0.8192 for SHFE copper and from 1.2908 to 0.5953 for SHFE aluminium. Both cross-correlation exponents hxy(q) differ from a constant significantly, which is another piece of empirical evidence that nonlinear dependency and multifractality exist in price-volume correlation for both two metals in SHFE, and it is inappropriate to describe metal futures markets with monofractal model. When q=2, cross-correlation exponent hxy(q) is the well-known Hurst exponent. We can know from Fig. 1, when q=2, cross-correlation exponent hxy(q)=0.9376>0.5 for SHFE copper and 0.7900>0.5 for SHFE aluminum. This means that long memory and persistent properties exist in price-volume relationship for SHFE copper and aluminum.
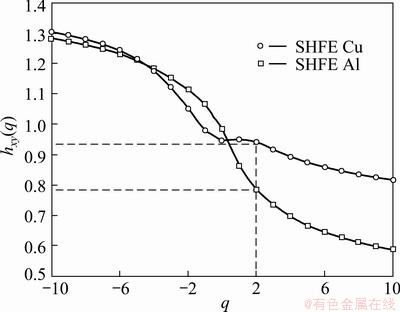
Fig. 1 Cross-correlation exponents hxy(q) in price-volume correlation of SHFE copper and aluminum
Financial time series usually contain some trends brought about by economic growth or inflation, thus spurious correlation does exist when impacted by external trends. Therefore, in order to analyze the long memory features of price-volume correlation more accurately and distinguish between external trends and inherent long-term trend, a lg��lg plot of the q-order correlation coefficient function Fq(s) vs scale size s for the selected two metals (denary logarithm), which has eliminated the trends brought about by 1-order, 2-order and 3-order of the price-volume series for SHFE copper and aluminum, was worked out and shown in Figs. 2 and 3. If we consider positive values of q, the segments v with large variance Fv(s) (i.e. large deviations from the corresponding fit) will dominate the average Fq(s) in Eq.(3). Thus, for positive values of q, hxy(q) describes the scaling behavior of the segments with large fluctuations. For negative values of q, the segments v with small variance Fv(s) will dominate the average Fq(s). Hence, for negative values of q, hxy(q) describes the scaling behavior of the segments with small fluctuations.
According to Fig. 2, a nonlinear relation does exist between price-volume correlation coefficient function Fq(s) and the sale size s when q varies from -10 to 10. Besides, all the figures show that when q��0 and 1��lg s��2 or lg s��2.6, the figures mainly feature dispersing, shaking, and nonlinear features, but when 2��lg s��2.6, the figure is relatively concentrated and displays significant linear features. Therefore, the small fluctuation components in the series possess scale invariance feature when 2��lg s��2.6; when q��0 and 1��lg s��2.2 or lg s��2.7, the figures mainly show strange oscillations and deviates from the initial scaling behavior, but when 2.2��lg s��2.7, the figure is relatively concentrated and displays significant linear features, which proves the fact that the large fluctuations components in the series possess scale invariance feature when 2.2��lg s��2.7. Therefore, when 2.2��lg s��2.6, ie, between 158 and 400 d, the price-volume correlation of SHFE copper possesses long memory and persistent properties and the long memory will almost completely disappear after 501 d.
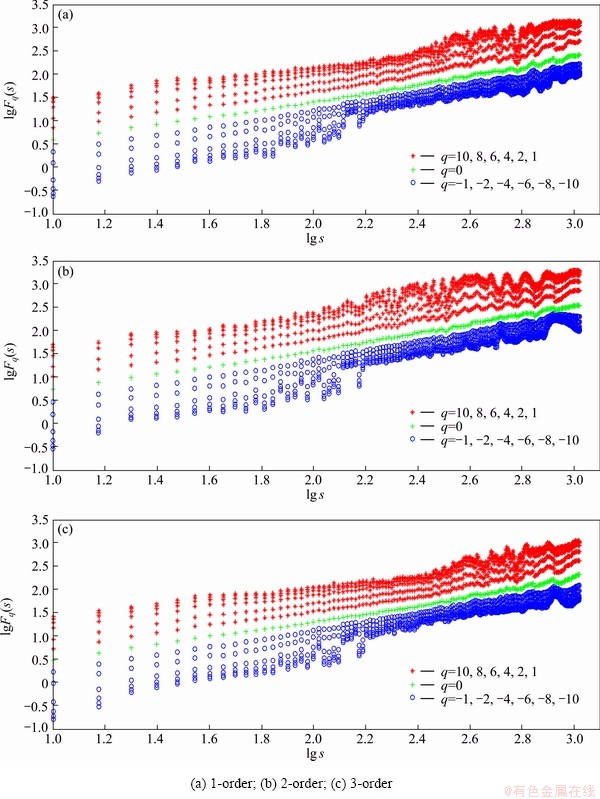
Fig. 2 lg��lg plot of Fq(s) vs scale size s of SHFE copper after 1,2,3-order detrend
Similar to that of SHFE cooper, a nonlinear relation does exist between price-volume correlation coefficient function Fq(s) and the sale s when q varies from -10 to 10. When q��0 and 2��lg s��2.5, the small fluctuation components in the series possess scale invariance feature; when q��0 and 2��lg s��2.8, the large fluctuation compo-nents in the series possess scale invariance feature.
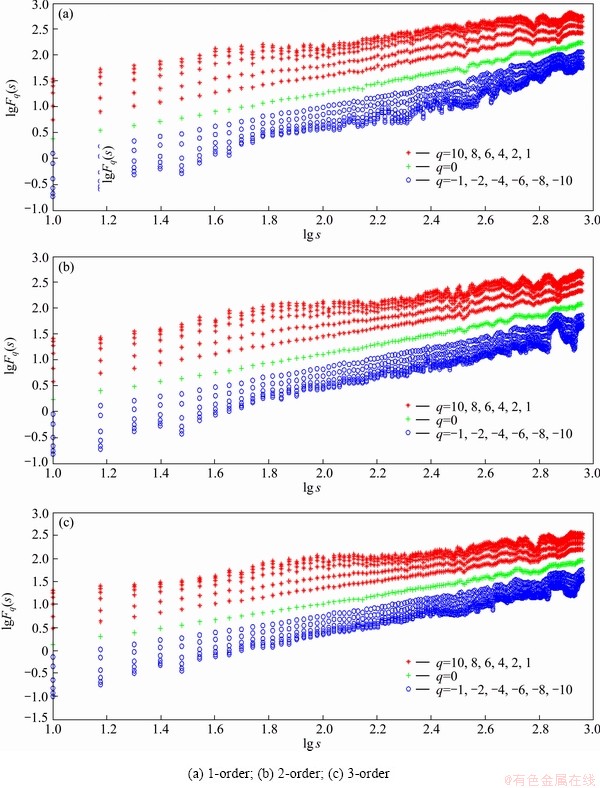
Fig. 3 lg��lg plot of Fq(s) vs scale size s of SHFE aluminum after 1,2,3-order detrend
Therefore, when 2��lg s��2.5, i.e., between 100 and 316 d, the price-volume correlation of SHFE aluminum displays long memory and persistent properties but tends to lose its memory after a period of about 316 d.
3.3 Further analyses
In the current literature, two major sources of multifractality are widely acknowledged, which can be found in various time series. One is the long-range correlation for small and large fluctuations, and the other is the non-Gaussian probability distribution of increments [19,20]. Therefore, the long memory of the series can be further proved by figuring out the resources of the multifractal features of the series. Usually, two procedures can be applied to identifying the contributions of two sources, which are shuffling and phase randomization. In order to investigate the dynamical causes of multifractality in the markets, both of the two methods are used. The shuffling procedure will destroy any long-range correlations, but the distributions remain exactly the same; while the surrogate data created by phase randomization will weaken the non-Gaussian distribution but still preserve the linear properties of the time series. If the multifractality derives from non-Gaussian distribution, the cross-correlation exponent hxy(q) obtained by the surrogate data should be a constant of 0.5; if the temporal correlation is the only reason for the multifractal features, after the series is shuffled, hxy(q) should be independent of q; nevertheless, if both of the two sources are the reasons, the multifractality should remain but its strength should be weaker.
For Shanghai copper futures market, from the results of the shuffled and surrogate cases in Fig. 4 and Table 1, it can be found that compared with original series, the variation amplitudes of cross-correlation exponents hxy(q) are successfully weakened by means of shuffled and surrogate procedure, which decrease progressively from 0.7196 to 0.4801 for surrogate series and from 1.2475 to 0.8092 for shuffled series, the differences change from 0.5023 to 0.2395 and 0.4383. This means long-range correlation and non-Gaussian probability distribution of the data are the possible main explanation to market multifractality formation in Shanghai copper futures market. Another piece of evidence is the alteration of multifractal spectrum. Compared with surrogate case, the spectrum width becomes significantly narrower after shuffled procedure. The shuffling procedure has destroyed long memory in the series, but the distribution remains exactly the same, so we can believe that the main sources about multifractality existing in price-volume correlation is long memory, that is, it can be proved that there exists long memory feature in the price-volume correlation of SHFE copper.
Table 1 and Fig. 5 show that, compared with the original series, the variation amplitudes of cross- correlation exponents hxy(q) of SHFE aluminum are successfully weakened by the means of shuffled and surrogate procedure, which is similar to the case of SHFE copper. The width of the multifractal spectra is also significantly narrowed down, which proves that the multifractal features of the shuffled and surrogated series have significantly been weakened. This proves the fact that the fat-tailed distributions and long memory are the sources of the existence of multifractal features in the price-volume correlation of SHFE aluminum. That is, it can also be proved that there exists the long memory feature in the price-volume correlation of SHFE aluminum.
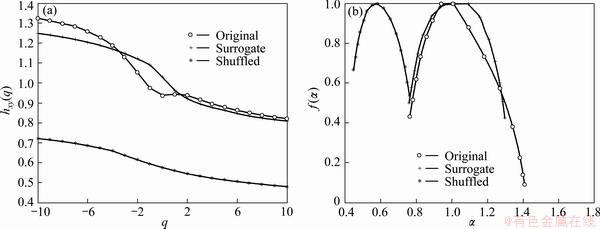
Fig. 4 Multifractal features of original, shuffled and phase-randomization cases of SHFE copper
Table 1 Cross-correlation exponent hxy(q) for original, shuffled and phase-randomization cases
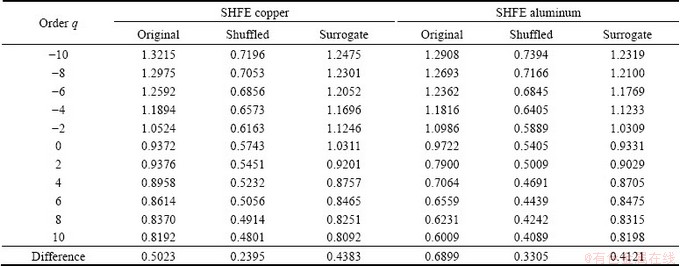
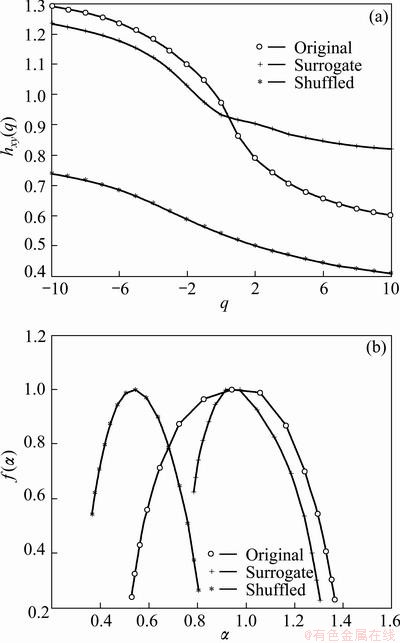
Fig. 5 Multifractal features of original, shuffled and phase- randomization cases of SHFE aluminum
4 Discussion
Firstly, as shown in the empirical analysis, multifractal features can be clearly found in China metal futures markets by MF-DCCA approach. The results imply that China metal futures market is not a so-called ��efficient market��, efficient market hypothesis (EMH), which is a foundation for economists to research and analyze the market phenomena and behaviors, and cannot be used to explain and analyze the economic phenomena perfectly and deeply. In June 2011, United Nations Conference on Trade and Development also explicitly pointed out that EMH had been suitable for analyzing commodities futures markets, such as oil or metal futures markets. Therefore, it is of important theoretical and practical significance to bring the fractal market theory and other nonlinear theory into the analysis and explanation of the behavior in metal futures market.
Secondly, there is an obvious nonlinear dependency relationship in price-volume correlation in China metal futures market, so a researcher or a technical analyst should complement his/her understandings on market dynamics by obtaining more comprehensive knowledge from the integrated point of view rather than from separated price or volume variable. The results, which studied on only one variable without a simultaneous discussion of another variable, may be biased for their ignorance of the complex cross-correlations between those highly interacted and correlated variables [21].
Thirdly, when q=2, both of the two Hurst exponents are greater than 0.5. This also means that long range correlation and persistent properties exist in price- volume correlation for both two metals. Furthermore, we confirm that long range correlation and non-Gaussian probability distribution are the main sources of the existence of multifractal features of price-volume relationship in China metal futures market. So, this suggests that the presence models, based on the assumption ��independent identically distributed��, must eliminate long memory effect from original series, if time span is longer than the length of memory. Otherwise, models may not come to rational results. On the other hand, the presence of long range correlation also means that the effects of events and information may not die out quickly, but have a long term effect on futures markets. Thereby, under some time span, we can predict price volatility and market behavior based on the more historical information.
5 Conclusions
The long memory feature of price-volume correlations in China metal futures market was empirically tested by applying MF-DCCA approach. Empirical results show that long memory feature with a certain period exists in price- volume correlation, which suggests that it is significance to bring the fractal market theory and other nonlinear theory into the analysis and explanation of the behavior in the theory and practice. And we should understand the market behavior by a simultaneous discussion of both two variables, price and trade volume in metal futures market.
References
[1] BOLLERSLEV T, JUBINSKI D. Equity trading volume and volatility: Latent information arrivals and common long-run dependencies [J]. Journal of Business & Economic Statistics, 1999, 17(1): 9-21.
[2] LAMOUREUX C, LASTRAPES W D. Endogenous trading volume and momentum in stock return volatility [J]. Journal of Business & Economic Statistics, 1994, 12(2): 253-260.
[3] LOBATO I N. Long memory in stock market trading volume [J]. Journal of Business & Economic Statistics, 2000, 18(4): 410-427.
[4] PANAS E. Long memory and chaotic models of prices on the London metal exchange [J]. Resources Policy, 2001, 27(4): 235-246.
[5] ALVAREZ J R, CISNEROS M, IBARRA C V, SORIANO A. Multifractal Hurst analysis of crude oil prices [J]. Physica A, 2002, 313(3-4): 651-670.
[6] SERLETIS A, ANDREADIS L. Random fractal structures in north American energy markets [J]. Energy Economics, 2004, 26(3): 389-399.
[7] TABAK B M, CAJUEIRO D O. Are the crude oil markets becoming weakly efficient over time? A test for time-varying long-range dependence in prices and volatility [J]. Energy Economics, 2007, 29(1): 28-36.
[8] POWER G J, TURVEY C G. Long-range dependence in the volatility of commodity futures prices: Wavelet-based evidence [J]. Physica A, 2010, 389(1): 79-90.
[9] WANG Y, WEI Y, WU C. Auto-correlated behavior of WTI crude oil volatilities: A multiscale perspective [J]. Physica A, 2010, 389(24): 5759-5768.
[10] JIA Z, CUI M, LI H. Research on the relationship between the multifractality and long memory of realized volatility in the SSECI [J]. Physica A, 2012, 391(3): 740-749.
[11] QIU T, CHEN G, ZHONG L X, LEI X W. Memory effect and multifractality of cross-correlations in financial markets [J]. Physica A, 2011, 390(5): 828-836.
[12] FLEMING J, KIRBY C. Long memory in volatility and trading volume [J]. Journal of Banking & Finance, 2011, 35(7): 1714-1726.
[13] HE L Y, CHEN S P. Nonlinear bivariate dependency of price-volume relationships in agricultural commodity futures markets: A perspective from multifractal detrended cross-correlation analysis [J]. Physica A, 2011, 390(2): 297-308.
[14] YUAN Y, ZHUANG X T, LIU Z Y. Price�Cvolume multifractal analysis and its application in Chinese stock markets [J]. Physica A, 2012, 391(12): 3484-3495.
[15] KANTELHARDT J W, ZSCHIEGNER S A, KOSCIENLNY E B, HAVLIN S, BUNDE A, STANLEYB H E. Multifractal detrended fluctuation analysis of nonstationary time series [J]. Physica A, 2002, 316(1-4): 87-114.
[16] PODOBNIK B, STANLEY H E. Detrended cross-correlation analysis: A new method for analyzing two nonstationary time series [J]. Physical Review Letters, 2008, 100(8): 084102.
[17] ZHOU W X. Multifractal detrended cross-correlation analysis for two nonstationary signals [J]. Physical Review E, 2008, 77(6): 066211.
[18] SHADKHOO S, JAFARI G R. Multifractal detrended cross-correlation analysis of temporal and spatial seismic data [J]. The European Physical Journal B, 2009(72): 679-683.
[19] MOVAHED S. Multifractal detrended fluctuation analysis of sunspot time series [J]. Journal of Statistical Mechanics: Theory and Experiment, 2006(2): P02003.
[20] BOLGORIAN M, RAEI R. A multifractal detrended fluctuation analysis of trading behavior of individual and institutional traders in Tehran stock market [J]. Physica A, 2011, 390(21-22): 3815-3825.
[21] HE L Y, CHEN S P. Are developed and emerging agricultural futures markets multifractal? A comparative perspective [J]. Physica A, 2010, 389(18): 3828-3836.
�� ��1,2���ƽ���1,2����Ң��2,3����ѧ��1,2
1. ���ϴ�ѧ ��ѧԺ����ɳ 410083��
2. ���ϴ�ѧ ������Դս���о�Ժ����ɳ 410083��
3. ���ϴ�ѧ ��ѧ��ͳ��ѧԺ����ɳ 410083��
ժ Ҫ������MF-DCCA���������ҹ������ڻ��г���������ԵĶ��ط��������ͳ���������������ʵ֤���顣��������ҹ������ڻ����۹�ϵ�����ž���һ��ʱ�����ij�������������ͨ��������������Դ��ڶ��ط���������ԭ��һ��֤���ҹ������ڻ��г���������Դ��ڳ��������������ط��������ͳ������ԵĴ�����ζ�Ž������г������Լ������ķ��������ۺͷ������뵽���ҹ������ڻ��г���Ϊ�ķ�����������Ҫ����ʵ���塣
�ؼ��ʣ������ڻ�����������ԣ��������ԣ�MF-DCCA���������ط��Σ��������������ط�����
(Edited by Xiang-qun LI)
Foundation item: Project (13&ZD024) supported by the Major Program of the National Social Science Fund of China; Project (71073177) supported by the National Natural Science Foundation of China; Project (CX2012B107) supported by the Graduate Student Innovation Project of Hunan Province, China; Project (13YJAZH149) supported by the Social Science Fund of Ministry of Education of China; Project (2011ZK2043) supported by the Key Program of the Soft Science Research Project of Hunan Province, China; Project (12JJ4077) supported by Natural Science Foundation of Hunan Province of China
Corresponding author: Yao-qi GUO; Tel: +86-13787798224; E-mail: guoyaoqi912@qq.com
DOI: 10.1016/S1003-6326(13)62845-9

