拉伸加载下应变速率对Al-Mg-Si-Cu合金力学性能、显微组织及织构的影响
来源期刊:中国有色金属学报(英文版)2020年第1期
论文作者:汪小锋 史同亚 王和斌 周宋泽 彭文飞 王永刚
文章页码:27 - 40
关键词:Al-Mg-Si-Cu合金;应变速率;力学性能;显微组织;织构
Key words:Al-Mg-Si-Cu alloy; strain rate; mechanical properties; microstructure; texture
摘 要:通过拉伸测试、显微组织和织构表征研究应变速率对Al-Mg-Si-Cu合金力学性能、显微组织及织构的影响。结果表明,应变速率对力学性能和显微组织有一定的影响,但对织构几乎无影响。总的来说,随着应变速率的增加,合金的屈服强度、极限抗拉强度及伸长率均呈先增加、然后保持不变、最后增加的趋势。所有合金断口附近区域的显微组织与应变速率无关,均由轻微拉长的晶粒组成,但晶界角度分布存在一定差异;随着应变速率的增加,小角度晶界先增加后减少。应变速率的变化对断口附近区域的织构几乎无影响。
Abstract: The effects of strain rate on the mechanical properties, microstructure and texture of Al-Mg-Si-Cu alloy were investigated through tensile test, microstructure and texture characterization. The results show that strain rate has some influences on the mechanical properties and microstructure, but a slight influence on the texture. Overall, yield strength, ultimate tensile strength and elongation increase first, then remain unchanged, and finally increase with increasing strain rate. Independent of strain rate, microstructure in the vicinities of the fracture regions of all the specimens is composed of the slightly elongated grains. However, some differences in misorientation angle distributions can be observed. As strain rate increases, the low angle grain boundaries (LAGBs) increase first, and then decrease. Textures in the vicinities of the fracture regions are almost identical with increasing strain rate.
Trans. Nonferrous Met. Soc. China 30(2020) 27-40
Xiao-feng WANG1, Tong-ya SHI1, He-bin WANG2, Song-ze ZHOU1, Wen-fei PENG1, Yong-gang WANG1
1. Key Laboratory of Impact and Safety Engineering, Ministry of Education, Ningbo University, Ningbo 315211, China;
2. School of Materials Science and Engineering, Jiangxi University of Science and Technology, Ganzhou 341000, China
Received 7 April 2019; accepted 28 November 2019
Abstract: The effects of strain rate on the mechanical properties, microstructure and texture of Al-Mg-Si-Cu alloy were investigated through tensile test, microstructure and texture characterization. The results show that strain rate has some influences on the mechanical properties and microstructure, but a slight influence on the texture. Overall, yield strength, ultimate tensile strength and elongation increase first, then remain unchanged, and finally increase with increasing strain rate. Independent of strain rate, microstructure in the vicinities of the fracture regions of all the specimens is composed of the slightly elongated grains. However, some differences in misorientation angle distributions can be observed. As strain rate increases, the low angle grain boundaries (LAGBs) increase first, and then decrease. Textures in the vicinities of the fracture regions are almost identical with increasing strain rate.
Key words: Al-Mg-Si-Cu alloy; strain rate; mechanical properties; microstructure; texture
1 Introduction
Automotive manufacturers are concerning the development of new materials for improving safety and reducing fuel consumption, therefore, aluminum alloys have been an attractive candidate owing to their high specific strength ratio, sufficient formability, excellent corrosion resistance and good recyclability [1-4]. Heat-treatable Al- Mg-Si-Cu alloys belonging to 6xxx series alloys have gained extensive attention for their use in the auto-body outer panels, owing to their excellent properties combining the good formability in the T4P state (solution treatment plus pre-aging treatment) and relatively high service strength in the age-hardened state (paint baking treatment) [5,6].
Crash safety is very critical to the automotive application, which is considered to be significantly influenced by the strength and elongation of the structural parts. Structural parts with high strength and elongation reveal good energy absorption ability [7-9]. A car crash involves crushing of the energy absorbing parts of the car body, which may be over in fractions of a second, and the strain rate is always in the range of 5-500 s-1. Accordingly, besides quasi-static mechanical property, dynamic mechanical property is also very important for predicting the crash safety.
Currently, extensive studies have been devoted to investigate the effect of strain rate on the mechanical properties of aluminum alloys [10-16].
ZHANG et al [10] revealed that the strain rate had a significant effect on mechanical property of 7075-T6 aluminum alloy. At strain rates below 1×10⁻² s-1, strain rate hardly influenced the mechanical property; when the strain rate was in the range of 10-500 s-1, the strain hardening effect was weak; whereas at strain rates above 1000 s-1, the strain hardening effect was significant. CHEN et al [11] found that AA6xxx alloys exhibited no significant rate sensitivity, whereas moderate strain rate sensitivity was found in AA7xxx alloys. However, DJAPIC OOSTERKAMP et al [12] concluded that both AA6082 and AA7108 alloys exhibited the low strain rate sensitivity. SMERD et al [13] pointed out that AA5754 alloy exhibited a mild increase in the flow stress with the increase of strain rate, while the flow stress of AA5182 alloy appeared to be insensitive to the strain rate. YE et al [14] found that the flow stress of AA6063 aluminum alloy increased with increasing strain rate. In general, the above researches reveal that the effect of strain rate on the mechanical property of aluminum alloys is determined by the strain rate and alloy element to some extent. In addition, strain rate may influence microstructure according to several studies. MA et al [15] found that higher strain rate could be favorable for developing more apparent necking, larger and deeper by dimples in 5A02 alloy. YANG et al [16] suggested that annealing behavior of 1050 commercial aluminum was a continuous process of grain coarsening under dynamic loading, while that was a discontinuous recrystallization under quasi-static loading. According to the microstructural observation of AA5052 alloy [17], dynamic loading was beneficial to the dislocation motion along multi-slip systems and the development of dislocation nucleation. Under dynamic loading, the dislocation of AA6063 aluminum alloy increased with the increase of strain rate; on the contrary, the GP zones or β" precipitates decreased [18]. Based on research results in Ref. [19], a strong precipitation could be found in an aged AA6005 aluminum alloy during dynamic compression.
Obviously, the texture may have some changes as result of the microstructure transformation. Some references about the effect of strain rate on the textures of alloys have been revealed. GURAO et al [20] suggested that high strain rate compression could lead to weak texture compared to quasi-static compression in Cu-10Zn alloy. TIWARI et al [21] also concluded that the overall texture of AA7075 alloy became weak with the increase in the strain rate under torsion loading. PANDEY et al [22] got a different conclusion that there was little change in texture with the increase of strain rate at room temperature in AA5754 alloy.
Overall, although the effect of strain rate on the mechanical property and microstructureof Al-Mg-Si-Cu alloy has been revealed by some researchers, there is still lack of systematic study about its effect on texture of Al-Mg-Si-Cu alloys under tensile loading in the range of medium strain rate. Furthermore, the microstructure and texture variation of Al-Mg-Si-Cu alloys after tensile deformation under different strain rate conditions is still not well understood. Accordingly, the aim of the present study is to understand the effect of strain rate on mechanical property, microstructure and texture of Al-Mg-Si-Cu alloy, and hopefully provide a guide for application of Al-Mg-Si-Cu alloy.
2 Experimental
2.1 Material preparation
The starting material was a cold-rolled Al- Mg-Si-Cu alloy sheet with a thickness of 1 mm and its chemical composition is Al-0.7Mg- 0.9Si-0.7Cu-0.3Fe-0.2Mn (wt%). The sheet was solution-treated in a salt bath at 828 K (555 °C) for 2 min and subsequently quenched in water, and then pre-aged at 353 K (80 °C) for 12 h, followed by naturally aging for 14 d (T4P treatment). After that, the alloy sheet was pre-stretched 2% to simulate the form processing. Finally, it was kept in an aging furnace at 443 K (170 °C) for 20 min (bake hardening).
2.2 Mechanical property characterization
The mechanical property was measured by quasi-static and dynamic uniaxial tensile tests. Flat dog-bone shaped tensile specimens were cut along the rolling direction (RD).
The tensile tests at a strain rate of 1×10⁻³ s-1 were conducted at room temperature using the Instron E1000 electrical tensile testing machine. The strain of specimens was measured by an extensometer. Three sets of tests were carried out to ensure the accuracy of the results.
The tensile tests at other different strain rates of 1×10⁻², 1, 10, 200 and 800 s-1 were carried out at room temperature by the Zwick-Roell HTM5020 high velocity hydraulic servo testing machine. The strain of specimen was measured by digital image correlation (DIC) technology. Prior to testing, the specimens were sprayed using paints to create random and isotropic speckle pattern on the gauge length. All images of the tensile specimens during tensile tests were captured by a high speed camera. The coordinate value of lattice piece at each time step on gauge length was measured by VIC-2D correlation software, thus, the full-field strain on gauge length was obtained. Due to the heterogeneous distribution of stress and strain on the parallel segment of specimen, the entire gauge area was chosen for the correlation analysis. The dynamic tensile tests were also repeated three times.
2.3 Microstructure and texture characterization
The microstructure of the alloy was studied using a Carl ZEISS Axio Imager A2m optical microscope (OM). Longitudinal sections of the specimens were ground and polished via standard metallographical technique. The grain structure was revealed by etching in Keller’s reagent (95 mL H2O, 2.5 mL HNO3, 1.5 mL HCL and 1 mL HF).
The fracture surfaces of the tensile specimens were investigated using a Hitachi SU 5000 scanning electron microscope (SEM). Due to the non- uniform strain distribution within the gauge length, in order to understand the phenomena occurring in the alloy during the tensile deformation, the vicinities in the fracture regions of the tensile specimens at different strain rates were examined on a Hitachi SU 5000 SEM equipped with the Oxford Instruments AZtec HKL electron backscatter diffraction (EBSD) system to study the void distributions, microstructure and texture. Longitudinal sections of the EBSD specimens were prepared by grinding, mechanical polishing and electro-polishing using a solution of 6% perchloric acid and 94% ethanol at -20 °C for 8 s. A scanning step size of 2.5 μm was applied, in accordance with the grain size. The EBSD results including texture component maps, Taylor factor (TF) maps, grain size distributions and misorientation angle distributions were analyzed using the HKL Channel 5 software. Orientation distribution functions (ODFs) were calculated using the harmonic series expansion method (orthorhombic sample symmetry, lmax=22; Gaussian spread=5°). The ODFs were represented as plots of constant  2 sections with isointensity contours in Euler space defined by the Euler angles 1, Φ and 2.
3 Experimental results
3.1 Mechanical properties
The engineering stress-strain curves of the Al-Mg-Si-Cu alloy sheet at different strain rates are shown in Fig. 1. It is shown that the strain rate has some influences on the flow stress. With increasing strain rate from 1×10⁻³ to 1×10⁻² s-1, the flow stress has a slight increase; with increasing strain rate from 1×10⁻² to 200 s-1, the flow stress is almost kept unchanged; with increasing strain rate from 200 to 800 s-1, the flow stress increases appreciably. Notably, when the strain rate reaches 200 and 800 s-1, the curves have a downward trend in stress after yielding, owing to the stress oscillation and the thermal softening. This phenomenon has also been observed in Ref. [15].
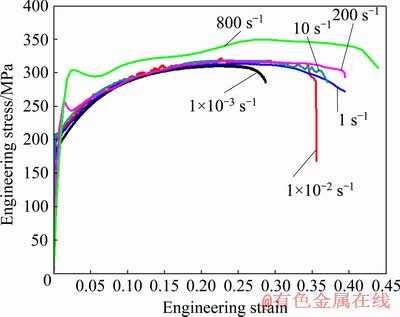
Fig. 1 Engineering stress-engineering strain curves of Al-Mg-Si-Cu alloy sheet at different strain rates
In the present study, under different strain rate conditions, the yield strength is the engineering stress at which 0.2% plastic deformation occurs, and the ultimate tensile strength is the peak stress. Variation of yield strength and ultimate tensile strength with strain rate is presented in Fig. 2. As can be observed, both yield strength and ultimate tensile strength increase first, and then remain unchanged, and finally increase. Accordingly, a high enough strain rate is beneficial to increasing yield strength and ultimate tensile strength.
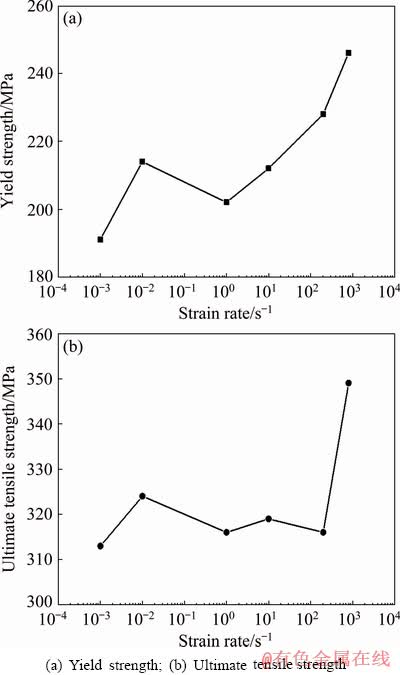
Fig. 2 Variation of strengths of Al-Mg-Si-Cu alloy as function of strain rate
Relationship between elongation and strain rate is revealed in Fig. 3. This relationship is the same as that between strength and strain rate, reflecting that high strain rate is also favorable to the improvement of elongation.
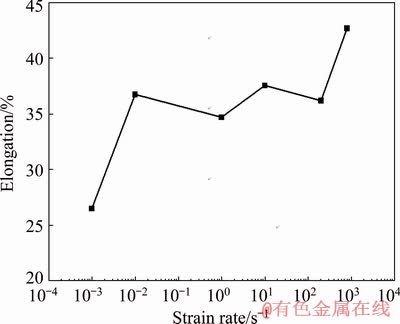
Fig. 3 Variation of elongation of Al-Mg-Si-Cu alloy as function of strain rate
Overall, the mechanical property of the Al-Mg-Si-Cu alloy is largely determined by strain rate. It possesses very weak strain rate sensitivity in the range of 1×10⁻²-200 s-1. In contrast to the strain rate of 10-3 s-1, a higher strain rate is beneficial to obtaining the superior mechanical property.
3.2 Fracture morphology and void nucleation characterization
The mechanical property differences under different strain rate conditions could be reflected by fracture mode. Therefore, it is essential to observe the fracture morphologies.
Figure 4 illustrates the fracture morphologies of the tensile specimens at different strain rates. There are a large number of dimples on the fracture surfaces of all the tensile specimens. This indicates that a ductile failure mode is dominant, independent of strain rate. By comparison of the fracture morphology changes of the specimens at different strain rates, it can be found that dynamic loading is easier to develop the larger and deeper dimples in fracture zone, although their number densities are close. The specimen at a strain rate of 800 s-1 has the deepest dimples, which is in accord with the elongation result.
Furthermore, some particles could be observed at the bottom of the dimples, and they have been confirmed as un-dissolved Al(Fe,Mn)Si in the previous study [23]. It is generally accepted that damage starts from the particles and experiences the process of void nucleation, growth and coalescence.
Because void evolution is critical to the fracture mechanical behavior, the tensile specimens at the strain rates of 1×10⁻³, 10 and 800 s-1 possessing the different elongations are selected to analyze the void distributions. Figure 5 shows their void distributions in the vicinities of the fracture regions. It is clear that most of the voids tend to distribute at grain boundaries, independent of strain rate, owing to the fact that grain boundary is always weaker than intracrystalline. The voids possess a wide size range, implying that the voids experienced a growth process. The large black regions indicate that a few voids were coalesced. According to the comparison of void distributions, it can be found that void coalescence gradually increases with increasing strain rate. In other words, the damage degree increases with the increase of strain rate. Accordingly, this phenomenon explains why the high strain rate is beneficial to the elongation.
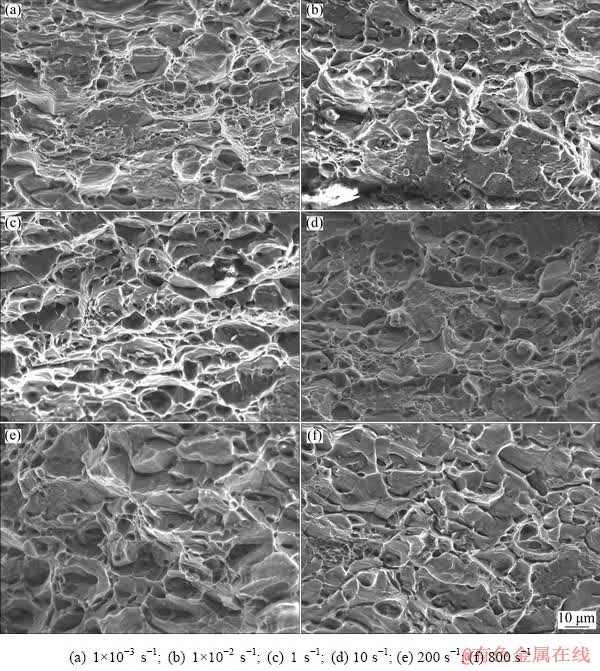
Fig. 4 Fracture morphologies of tensile specimens at different strain rates
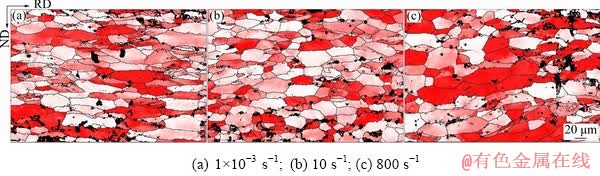
Fig. 5 Void distributions in vicinities of fracture regions of tensile specimens at different strain rates
3.3 Microstructure characterization
The microstructure of the Al-Mg-Si-Cu alloy in BH (bake hardening) state is shown in Fig. 6(a). It can be seen that the recrystallization micro- structure is primarily comprised of equiaxied grains with the size of 10-80 μm (as shown in Fig. 6(b)), and the average grain size is approximately 21 μm. In addition, according to Fig. 6(c), there are a large number of high angle grain boundaries (HAGBs) in the alloy, also implying that the recrystallization structure is dominant in BH state. Obviously, BH treatment is difficult to change the grain structure because of the low temperature.
After tensile tests, microstructure may have some changes and therefore it is essential to characterize it. Texture component maps in the vicinities of the fracture regions of the tensile specimens at different strain rates are presented in Fig. 7. As can be seen, all the microstructures have transformed from equiaxed grains to elongated grains along the tensile direction. The similar grain structure indicates that the effect of strain rate on the grain structure is negligible. Figure 8 shows the grain size distributions. It can be found that they are non-uniform, which may be ascribed to the non-uniform recrystallization microstructure and tensile deformation. In addition, their grain size distributions are also similar, indicating the effect of strain rate on grain size is slight. According to statistical calculation, the average grain size of the tensile specimens is approximately 19 μm. Consequently, the tensile deformation is able to refine grains, not depending on strain rate. Figure 9 presents the misorientation angle distributions in the vicinities of the fracture regions. As can be seen, the relationship between strain rate and misorientation angle is not monotonic. With the increase of strain rate, the fraction of low angle grain boundaries (LAGBs) increases first, and then decreases. This implies that the misorientation angle distribution is significantly affected by strain rate.
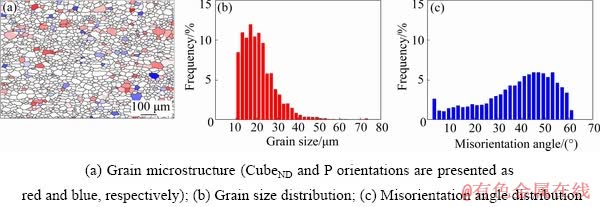
Fig. 6 EBSD analysis of alloy sheet in BH state
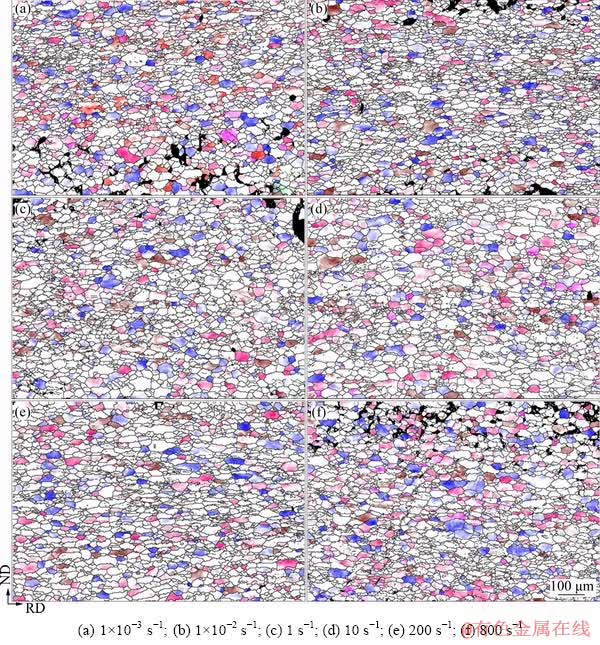
Fig. 7 Texture component maps in vicinities of fracture regions of tensile specimens at different strain rates (The grain orientations are presented as follows: red, CubeND; purple, Goss; pink, Copper; brown, Cube; blue, P)
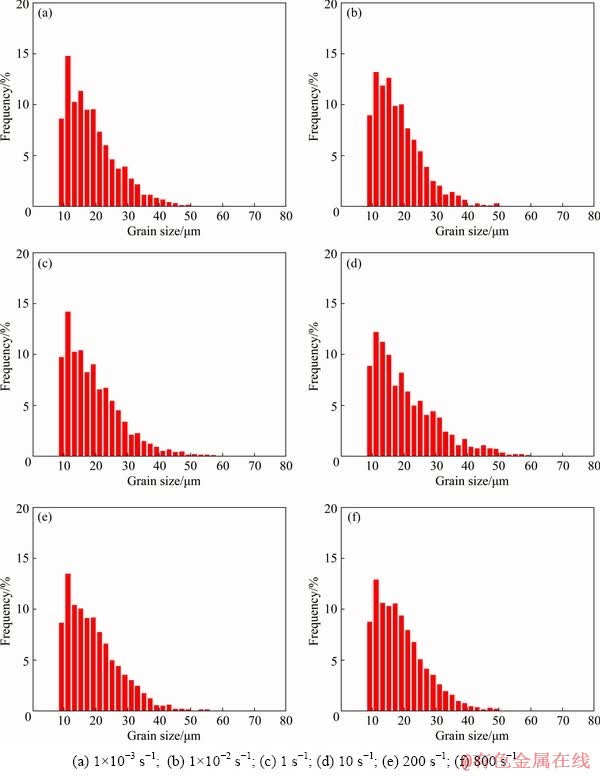
Fig. 8 Grain size distributions in vicinities of fracture regions of tensile specimens at different strain rates
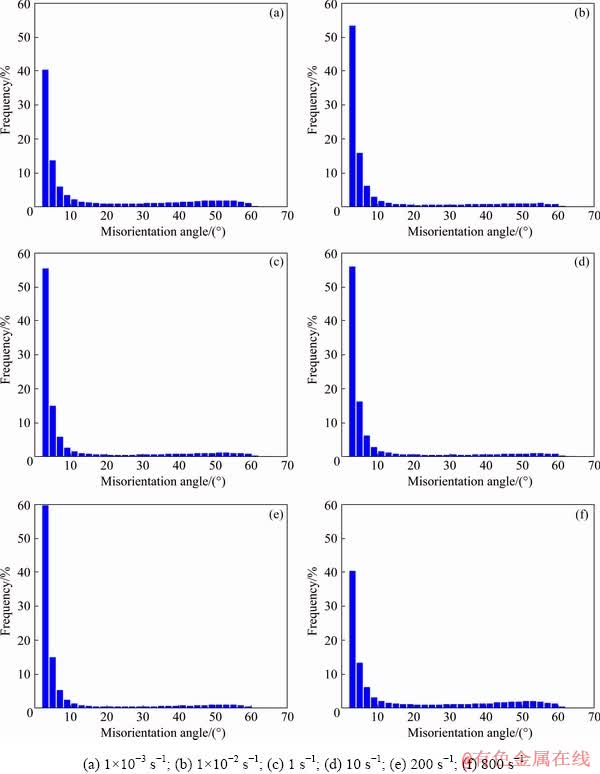
Fig. 9 Misorientation angle distributions in vicinities of fracture regions of tensile specimens at different strain rates
3.4 Texture characterization
Based on the microstructure results, the strain rate has some influences on the misorientation angle distributions, and it may influence the texture further.
Figure 10 shows the textures of the Al-Mg-Si-Cu alloy in BH state. It reveals the typical recrystallization texture mainly consisting of CubeND {001}<310> and P {011}<122> orientations with intensities of 4.1 and 2.2, respectively. The texture components have been reported in some references [24-26], which are likely to be developed by particle stimulated nucleation (PSN) mechanism. Therefore, it is also implied that other recrystallization nucleation mechanisms are suppressed. The spatial distribution of grains within 15° of their exact orientations is shown in Fig. 6(a). The grain color gradually fades with the increase of angle deviation from the exact orientation.
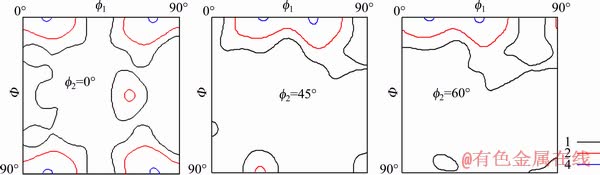
Fig. 10 Textures of alloy sheet in BH state
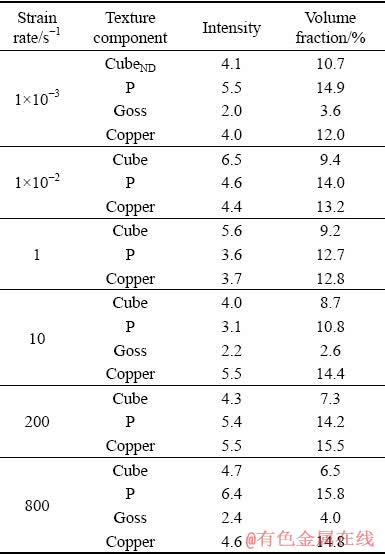
Although the texture after tensile deformation is generally characterized by inverse pole figure (IPF), ODF is still used to characterize the texture in the present study owing to the fact that the alloy sheets were prepared by rolling. The ODFs in the vicinities of the fracture regions of the tensile specimens under different strain rate conditions are presented in Fig. 11. After the tensile tests, the initial recrystallization texture has taken place great changes. Specific texture components and their corresponding intensities and volume fractions are summarized in Table 1. In contrast to the alloy in the BH state, the alloy experienced tensile tests possesses stronger texture including recrystallization texture and deformation texture. According to the comparison of volume fraction, it can be found that strain rate has a very slight influence on texture. Notably, P orientation is still the main texture component indicating that recrystallization microstructure is not completely replaced by deformed structure. The common recrystallization texture component Cube {001}<100> and the typical deformation texture component Copper {112}<111> were developed during the tensile tests. Additionally, Goss {110}<001> orientation can be found, which is attributable to the relatively small deformation. It is worth noting that the alloy at a strain rate of 1×10⁻³ s-1 possesses CubeND orientation, which is different from the conventional CubeND orientation. The former is 5° ND (normal direction) rotated Cube orientation, while the latter is 20° ND rotated Cube orientation. Maybe the 5° ND rotated Cube orientation is the exact Cube orientation, and the angle deviation could be attributed to the fact that the cut direction of the sample has a slight deviation. Texture component maps are shown in Fig. 7. As can be seen, the distributions of different oriented grains are appreciable.
4 Discussion
4.1 Effect of grain orientation on void nucleation
It has been reported [27,28] that grain orientation characterized by Taylor factor (TF) value may affect void nucleation. In general, TF is dependent on the texture and the orientation of the tensile axis, and it relates the applied stress to the critical shear stress acting on the active slip system, which reflects the resistance of plastic deformation. Nowadays, there is a dispute about the effect of grain orientation on void nucleation. YANG el al [27] claimed that voids preferred to nucleating at the boundaries of those grains with high TF values. However, ESCOBEDO and CERRETA [28] drew a contrary conclusion that voids were likely to nucleate at the boundaries of those grains with low TF values, and they may be subjected to more severe damage than those with high TF values.
In the present study, the microstructure maps in Fig. 5 are also the TF maps. Red represents the TF values of grains, and it gradually fades with increasing TF. As can be seen, a variety of voids nucleate at the grain boundaries with low TF values. Since grains with low TF values always possess low resistance of plastic deformation, they could undergo deformation more easily. Consequently, they may be subjected to severer damage and the voids can be developed. Furthermore, according to Fig. 12, as the strain rate increases, the frequency of low TF values gradually increases, indicating that the tensile specimens at the high strain rate could occupy plastic deformation more easily, and thus lead to higher elongation. This is consistent with the experimental results.
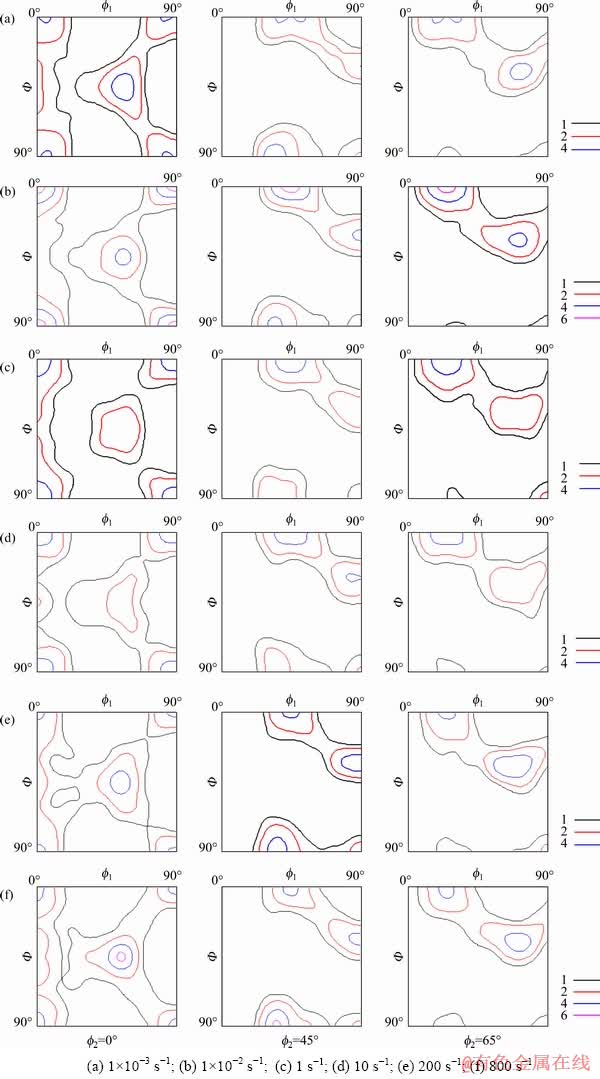
Fig. 11 ODFs in vicinities of fracture regions of tensile specimens at different strain rates
Table 1 Volume fractions of texture components in vicinities of fracture regions of tensile specimens at different strain rates
4.2 Effect of strain rate on microstructure and mechanical property
In Section 3.3, the misorientation angle distributions of the tensile specimens reveal that when the strain rate increases from 1×10⁻³ to 1×10⁻² s-1, LAGBs increase; when the strain rate is in the range of 1×10⁻²-200 s-1, LAGBs almost remain unchanged; when the strain rate reaches 800 s-1, LAGBs decrease significantly. It is well accepted [18,29] that dynamic deformation is able to accelerate generating dislocation. Accordingly, the increase of LAGBs in the range of 1×10⁻³ to 1×10⁻² s-1 could be attributed to the increase of dislocation. The almost unchanged LAGBs in the range of 1×10⁻²-200 s-1 indicate that the increase of dislocation in this strain rate range is very limited. Under the strain rate of 800 s-1 condition, the increase of HAGBs at the expense of LAGBs may be attributed to recrystallization or grain fragmentation.
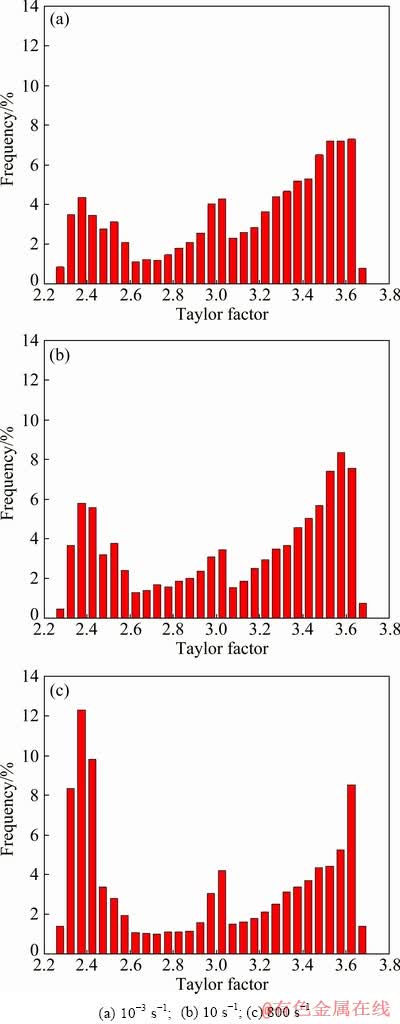
Fig. 12 TF distributions in vicinities of fracture regions of tensile specimens at different strain rates
All the tensile tests in the present study were performed under room temperature. When the strain rate is very high, the tensile tests could be approximately considered as adiabatic due to a short completion time, and the tensile specimens may experience an increase in temperature due to plastic deformation. The temperature rise could be calculated by the portion of plastic work transformed into heat, and the equation could be expressed as
 (1)
(1)
where △T is the temperature rise, cp is the specific heat capacity, ρ is the density of the material, σ is the axial stress and εp is the axial plastic strain. The integral in the equation represents total plastic work. The parameter β is the fraction of the total plastic work that is converted into heat. For aluminum alloy, cp is about 900 J/(kg・K), ρ is equal to 2.7×10³ kg/m3, and β is generally thought to be 0.90-0.95.
The true stress-strain curves are more reasonable to calculate the plastic work and they could be obtained based on the engineering stress-strain curves. Obviously, the maximum strain rate of 800 s-1 should give rise to the highest temperature rise as a result of the highest plastic work. According to the integral of the plastic part of the true stress-strain curve, the plastic work at the strain rate of 800 s-1 is approximately 135 MJ/m3. Substituting the above parameters to Eq. (1), it can be calculated that the temperature rise △T is approximately 50 °C. The actual temperature rise is expected to be lower due to the heat loss. Therefore, it seems impossible to lead to the occurrence of recrystallization. The increase of HAGBs at the strain rate of 800 s-1 may be resulted from the grain fragmentation under the great impact.
The experimental results have demonstrated that strain rate has some influences on the mechanical property. Generally, MEYERS [29] pointed out that the effect of strain rate on strength could be ascribed to two aspects. On one hand, the high dislocation velocity corresponds to the high threshold shear stress, meaning that improving strain rate is beneficial to improving strength. On the other hand, the increase of dislocation is beneficial to improving strength due to dislocation hardening. In the present study, although the specimen at a strain rate of 800 s-1 possesses a low density of dislocation because of the low volume fraction of LAGBs, more HAGBs in the specimen mean that grain boundary strengthening is also the main strengthening mechanism. Accordingly, the competition among threshold shear stress, dislocation and HAGBs results in the strength variation with strain rate.
The relationship between elongation and strain rate could be explained as follows. Under dynamic loading, the dislocations could be subjected to the very high stress in a short time, and the stress could exceed threshold shear stresses of more slip systems, thus more slip systems start besides common slip systems. This is beneficial to the ductility. However, the generation of dislocation with the increase of strain rate is detrimental to the ductility. Furthermore, under the high strain rate deformation condition, the necking development could be slowed down and the fracture may be delayed due to the inertia effect, which is favorable to the elongation. Accordingly, the competition of movable slip systems, dislocation and inertia force finally results in the elongation variation with strain rate. Especially in the specimen at a strain rate of 800 s-1, the low dislocation density, high inertia effect and lots of slip systems make the specimen exhibit the highest elongation.
4.3 Effect of strain rate on texture
The previous results have revealed that there is little change in texture with the increase of strain rate. This result is consistent with the conclusion in Ref. [22]. However, CANOVA et al [30] have revealed that at high strain rates, the increased number of active slip systems could reduce plastic spin, thereby retarding texture evolution, and thus could lead to weak texture. GURAO et al [20] also have explained the texture weakening by grain fragmentation model. During plastic deformation, the gradual reorientation of grains could take place due to generation of dislocations. However, there is no sufficient time to make the entire grains reorient themselves at a high strain rate, which may result in the grain fragmentation and texture weakening.
In the present study, on one hand, the fracture strain increases with increasing strain rate, which could enhance texture. On the other hand, as strain rate increases, the increase of active slip systems could play a positive role in weakening texture. In addition, the grain structure almost has no effect on texture due to their similar grain size distributions. Accordingly, it could be concluded that the comprehensive effect of strain and active slip systems make the texture almost remain unchanged with the increase of strain rate.
5 Conclusions
(1) Strain rate has a substantial effect on the mechanical property of the BH treated Al-Mg-Si-Cu alloy. As strain rate increases, yield strength, ultimate tensile strength and elongation increase first, then remain unchanged, and finally increase.
(2) Although fractures of all the specimens are dominant by the ductile fracture mode, compared with the quasi-static loading, the loading at a higher strain rate is more beneficial to the development of the larger and deeper dimples in fracture zones. Voids prefer to nucleating at grain boundaries.
(3) Strain rate has some influences on the microstructure in the vicinities of the fracture regions of the tensile specimens. After the tensile tests at different strain rates, the slightly elongated grain structure could be observed over a wide strain rate range, and their grain size distributions are similar. However, their misorientation angle distributions are different. As strain rate increases, the fraction of LAGBs increases at first and then decreases.
(4) Strain rate plays little role in the formation of texture. After the tensile tests at different strain rates, all the deformation textures are comprised of Cube, P, Goss and Copper, and their volume fractions are very close.
References
[1] HIRSCH J, Al-SAMMAN T. Superior light metals by texture engineering: Optimized aluminum and magnesium alloys for automotive applications [J]. Acta Materialia, 2013, 61: 818-843.
[2] HIRSCH J. Recent development in aluminium for automotive applications [J]. Transactions of Nonferrous Metals Society of China, 2014, 24: 1995-2002.
[3] ROWE J. Advanced materials in automotive engineering [M]. Cambridge: Woodhead Publishing Limited, 2012.
[4] GAO G J, HE C, LI Y, LI J D, WANG Z D, MISRA R D K. Influence of different solution methods on microstructure, precipitation behavior and mechanical properties of Al-Mg-Si alloy [J]. Transactions of Nonferrous Metals Society of China, 2018, 28: 839-847.
[5] ENGLER O, HIRSCH J. Texture control by thermomechanical processing of AA6xxx Al-Mg-Si sheet alloys for automotive applications―A review [J]. Materials Science and Engineering A, 2002, 336: 249-262.
[6] SIDOR J, MIROUX A, PETROV R, KESTENS L. Microstructural and crystallographic aspects of conventional and asymmetric rolling processes [J]. Acta Materialia, 2008, 56: 2495-2507.
[7] OLIVER S, JONES T B, FOURLARIS G. Dual phase versus TRIP strip steels: Comparison of dynamic properties for automotive crash performance [J]. Materials Science and Technology, 2007, 23: 423-431.
[8] XU S, TYSON W R, BOUCHARD R, GERTSMAN V Y. Effect of strain rate and temperature on tensile flow behavior and energy absorption of extruded magnesium AM30 alloy [J]. Journal of Materials Engineering and Performance, 2009, 18: 1091-1101.
[9] LI S C, KANG Y L, ZHU G M, KUANG S. Effects of strain rates on mechanical properties and fracture mechanism of DP780 dual phase steel [J]. Journal of Materials Engineering and Performance, 2015, 24: 2426-2434.
[10] ZHANG D N, SHANGGUAN Q Q, XIE C J, LIU F. A modified Johnson-Cook model of dynamic tensile behaviors for 7075-T6 aluminum alloy [J]. Journal of Alloys and Compounds, 2015, 619: 4186-4194.
[11] CHEN Y, CLAUSEN A H, HOPPERSTAD O S, LANGSETH M. Stress-strain behaviour of aluminium alloys at wide range of strain rates [J]. International Journal of Solids and Structures, 2009, 46: 3825-3835.
[12] DJAPIC OOSTERKAMP J, IVANKOVIC A, VENIZELOS G. High strain rate properties of selected aluminium alloys [J]. Materials Science and Engineering A, 2000, 278: 225-235.
[13] SMERD R, WINKLER S, SALISBURY C, WORSWICK M, LLOYD D, FINN M. High strain rate tensile testing of automotive aluminum alloy sheet [J]. International Journal of Impact Engineering, 2005, 32: 541-560.
[14] YE T, WU Y Z, LIU A, XU C C, LI L X. Mechanical property and microstructure evolution of aged 6063 aluminum alloy under high strain rate deformation [J]. Vacuum, 2019, 159: 37-44.
[15] MA H J, HUANG L, TIAN Y, LI J J. Effects of strain rate on dynamic mechanical behavior and microstructure evolution of 5A02-O aluminum alloy [J]. Materials Science and Engineering A, 2014, 606: 233-239.
[16] YANG Y, WANG J L, CHEN Y D, HU H B. Effect of strain rate on microstructural evolution and thermal stability of 1050 commercial pure aluminum [J]. Transactions of Nonferrous Metals Society of China, 2018, 28: 1-8.
[17] LIU D H, YU H P, LI C F. Comparative of the microstructure of 5052 aluminum alloy sheets under quasi-static and high-velocity tension [J]. Materials Science and Engineering A, 2012, 551: 280-287.
[18] SCAPIN M, MANES A. Behaviour of Al6061-T6 alloy at different temperatures and strain rates: Experimental characterization and material modelling [J]. Materials Science and Engineering A, 2018, 734: 318-328.
[19] ZHANG L, HE H, LI S, WU X D, LI L X. Dynamic compression behavior of 6005 aluminum alloy aged at elevated temperatures [J]. Vacuum, 2018, 155: 604-611.
[20] GURAO N P, KAPOOR R, SUWAS S. Texture evolution in high strain rate deformed Cu-10Zn alloy [J]. Materials Science and Engineering A, 2012, 558: 761-765.
[21] TIWARI S, MISHRA S, ODESHI A, SZPUNAR J A, CHOPKAR M. Evolution of texture and microstructure during high strain rate torsion of aluminum zinc magnesium copper alloy [J]. Materials Science and Engineering A, 2017, 683: 94-102.
[22] PANDEY A, KHAN A S, KIM E Y, CHOI S H, HEROLD T G. Experimental and numerical investigations of yield surface, texture and deformation mechanisms in AA5754 over low to high temperatures and strain rates [J]. International Journal of Plasticity, 2013, 41: 165-188.
[23] WANG X F, GUO M X, ZHANG Y, XING H, LI Y, LUO J R, ZHANG J S, ZHUANG L Z. The dependence of microstructure, texture evolution and mechanical properties of Al-Mg-Si-Cu alloy sheet on final cold rolling deformation [J]. Journal of Alloys and Compounds, 2016, 657: 906-916.
[24] HUMPHREYS F J, HATHERLY M. Recrystallization and related annealing phenomena [M]. 2nd ed. Amsterdam: Elsevier, 2004.
[25] VATNE H E, ENGLER O, NES E. Influence of particles on recrystallisation textures and microstructures of aluminium alloy 3103 [J]. Materials Science and Technology, 1997, 13: 93-102.
[26] LILLYWHITE S J, PRANGNELL P B, HUMPHREYS F J. Interactions between precipitation and recrystallisation in an Al-Mg-Si alloy [J]. Materials Science and Technology, 2000, 16: 1112-1120.
[27] YANG Y, PENG Z Q, CHEN X Z, GUO Z L, TANG T G, HU H B, ZHANG Q M. Spall behaviors of high purity copper under sweeping detonation [J]. Materials Science and Engineering A, 2016, 651: 636-645.
[28] ESCOBEDO J P, CERRETA E K. Influence of boundary structure and near neighbor crystallographic orientation on the dynamic damage evolution during shock loading [J]. Philosophical Magazine, 2013, 93: 833-846.
[29] MEYERS M A. Dynamic behavior of materials [M]. New York: John Wiley & Sons, 1994.
[30] CANOVA G R, FRESSENGEAS C, MOLINARI A, KOCKS U F. Effect of rate sensitivity on slip system activity and lattice rotation [J]. Acta Metallugica, 1988, 36: 1961-1970.
汪小锋1,史同亚1,王和斌2,周宋泽1,彭文飞1,王永刚1
1. 宁波大学 冲击与安全工程教育部重点实验室,宁波 315211;
2. 江西理工大学 材料科学与工程学院,赣州 341000
摘 要:通过拉伸测试、显微组织和织构表征研究应变速率对Al-Mg-Si-Cu合金力学性能、显微组织及织构的影响。结果表明,应变速率对力学性能和显微组织有一定的影响,但对织构几乎无影响。总的来说,随着应变速率的增加,合金的屈服强度、极限抗拉强度及伸长率均呈先增加、然后保持不变、最后增加的趋势。所有合金断口附近区域的显微组织与应变速率无关,均由轻微拉长的晶粒组成,但晶界角度分布存在一定差异;随着应变速率的增加,小角度晶界先增加后减少。应变速率的变化对断口附近区域的织构几乎无影响。
关键词:Al-Mg-Si-Cu合金;应变速率;力学性能;显微组织;织构
(Edited by Wei-ping CHEN)
Foundation item: Project (TZ2018001) supported by the Science Challenge Project, China; Project (LQ17E010001) supported by the Zhejiang Provincial Natural Science Foundation, China; Project (2019-Z02) supported by the State Key Lab of Advanced Metals and Materials, China; Project (2018A610174) supported by the Ningbo Natural Science Foundation, China; Project supported by K. C. Wong Magna Fund from Ningbo University, China
Corresponding author: Xiao-feng WANG; Tel: +86-574-87600302; E-mail: wangxiaofeng@nbu.edu.cn
DOI: 10.1016/S1003-6326(19)65177-0

