
Thermodynamic modelling and applications of Ce-La-O phase diagram
GONG Wei-ping1, 2, ZHANG Rui1, CHEN Zhong-sheng1
1. State Key Laboratory of Powder Metallurgy, Central South University, Changsha 410083, China;
2. Department of Electronics, Institute of Huizhou, Huizhou 516001, China
Received 22 March 2011; accepted 28 July 2011
Abstract: The Ce-La-O system was investigated via experiments and thermodynamic modeling. A series of CeO2-LaO1.5 mixtures were prepared by co-precipitation technique and examined by X-ray diffraction. Mutual solubilities between LaO1.5 and CeO2 at 1273 K were determined. Using the new experimental data together with literature information, a set of self-consistent thermodynamic parameters for the CeO2-LaO1.5 system were optimized. Combined with thermodynamic descriptions of Ce-O and La-O systems from literature, several property diagrams of Ce-La-O system were calculated and used to explain oxidation process of the Ce-La alloys. The fluorite phase is the unique oxidation products for most of the Ce-La alloys.
Key words: Ce-La alloy; phase diagram; thermodynamics; oxidation
1 Introduction
During past few years, attention has been paid to surface reaction of Ce-La alloys [1-3]. Motivation for these works came from the application of alloy who takes place an electronic promotion of the 4f electrons to the 5d conduction band. Thermodynamic calculations on the Ce-La-O system can provide information to better quantify what happened to the Ce-La alloys during oxidation and to explain the microstructure changes due to oxidation. To the best of our knowledge, so far no thermodynamic modeling has been performed on the Ce-La-O system and the experimental data for the system were limited. The binary Ce-O and La-O have been assessed by ZINKEVICH et al [4] and GRUNDY et al [5], respectively. The purposes of this work were: 1) to provide new experimental phase diagram data and to obtain a set of self-consistent thermodynamic parameters for the CeO2-LaO1.5 system; 2) to describe the phases existing in the ternary Ce-La-O system and to investigate the microstructure evaluation of Ce-La alloy during oxidation.
GSCHNEIDNER and CALDERWOOD [6] reviewed the experimental information on the Ce-La system and published an assessed phase diagram. The phase diagram contained following phases: liquid, BCC, FCC, and DHCP. Because Ce and La are adjacent elements in the periodic table and form a continuous series of solid solutions, the liquidus and solidus and the lines of the FCC?BCC transformation, respectively, were drawn as straight lines connecting the two meltings or the two transformation points of Ce and La. Without further information, the ideal solution model was used to describe the liquid phase and the solid solution phases in this work.
A self-consistent set of Gibbs energy functions describing the Ce-O and La-O systems in the whole composition range have been reported by ZINKEVICH et al [4] and GRUNDY et al [5], respectively. The model parameters successfully explained most of the experimental data and reasonably predicted the thermodynamic properties of the systems, thus the descriptions from ZINKEVICH et al [4] and GRUNDY et al [5] were adopted in this work, but the thermodynamic model of La2O3-based solid solution phases in the La-O system was slightly modified in order to maintain the consistency with the Ce-O binary system.
A-, C-, H- and X-form rare earth sesquioxide structures have been reported for CeO1.5 and LaO1.5 [7]. At normal conditions, hexagonal A-form is stable structure for CeO1.5 and LaO1.5, it transforms into hexagonal H-form at sufficiently high temperatures, and the H-form converts into high-temperature cubic X-form before the melting occurs. Due to the similar properties between CeO1.5 and LaO1.5, four continuous solid solution phases named as A, C, H and X should be formed in the CeO1.5-LaO1.5 system. No experimental phase diagram data have been reported for the CeO1.5-LaO1.5 system.
Three solid solution phases, named as fluorite, A and H, existed in the CeO2-LaO1.5 system [8-15]. The fluorite, A and H phases originate from CeO2, A- and H-form LaO1.5. In the early studies of CeO2-LaO1.5 by BRAUER and GRADINGER [8], BEVAN and MANN [9] and MINKOVA and ASLANIAN [10], an extended fluorite homogeneity range was reported. DU et al [11] calculated the phase diagram of CeO2-LaO1.5 for the first time by adopting the parameters analogy from the ZrO2-LaO1.5 system. The results of these researchers [8-11] differed greatly in regarding to the mutual solubility between CeO2 and LaO1.5. Recently, MOGENSEN et al [12], RYAN et al [13], WILKES et al [14] and BELLIERE et al [15] reported the solubility of LaO1.5 in CeO2, respectively, but their data were inconsistent with each other as well as with the data of authors mentioned above [8-11]. Consequently, the experimental procedure was designed in the next section to clarify the homogeneity range for the CeO2-based solid solution and to check the experimental uncertainty of literature data [8-10, 12-15].
2 Experimental
2.1 Experimental procedure
Ten CeO2-LaO1.5 mixtures with the nominal compositions, which are listed in Table 1, were prepared via reactive co-precipitation technique. Cerium nitrate, Ce(NO3)3.6H2O (99.99%) and lanthanum nitrate, La(NO3)3.6H2O (99.99%), were adopted as the starting materials and were dissolved in distilled water. Magnetic stirring was employed during the dissolution. The two solutions were mixed in order to obtain required concentrations of cations while ammonium hydrate being added dropwise to keep the pH value above 9.0 for precipitation. The gel-like precipitates were then filtered and washed with distilled water prior to drying at 393 K for 12 h and followed by heat-treatment at 873 K for 10 h to remove residual organics. 10 g sample was grounded for 30 min in an agate mortar, and then pressed into small pellets. Finally, heat treatment was carried out in air using an electric furnace, whose temperature was controlled to about 1 K by a conventional electronic controller. The samples were held at 1273 K for enough time to establish equilibrium and then air quenched by rapid withdrawal from the furnace. The resultant phases were identified using XRD and the lattice parameters measurements.
Table 1 Compositions for CeO2-LaO1.5 mixtures and identified phase after annealing at 1 273 K for 10 h

2.2 Experimental results
Detailed experimental results from XRD are presented in Table 1. The lattice parameters of identified phases were refined with the Jade.5 software. Figures 1(a) and (b) show the XRD patterns of two typical mixtures (samples 7 and 8 have 60% and 70% LaO1.5, respectively). Figure 2 plots the lattice parameters of the CeO2-LaO1.5 mixtures versus the composition of LaO1.5. It can be seen that for the mixtures over the major part of the composition range up to 60% LaO1.5, LaO1.5 forms a solid solution in CeO2; above 95% LaO1.5, CeO2 forms a solid solution in LaO1.5, and in the range of 60%-95%, the mixed phases form. The XRD results indicate that the solubility of LaO1.5 in CeO2 at 1 273 K is about 60% and that of CeO2 in LaO1.5 is less than 5%. But due to the very limited solubility of CeO2 in LaO1.5, the lattice parameters change of the mixtures at the LaO1.5-rich side was not detected in this work.
3 Thermodynamic modeling
In this section, the thermodynamic assessment of the CeO2-LaO1.5 system was carried out by incorporating the literature information and the present experimental data. The thermodynamic model and the analytical expressions for the Gibbs energy of every phase were briefly presented in this section.

Fig. 1 X-ray diffraction patterns for CeO2-LaO1.5 mixtures (Samples 7 and 8) heat treated at 1 273 K for 10 h (Samples 7 and 8 are CeO2-60LaO1.5 and CeO2-70LaO1.5 mixtures, respectively.)

Fig. 2 Average lattice parameter of CeO2-LaO1.5 mixture
The liquid phase was described with an associated solution model. Since the CeO2 and LaO1.5 are the stable compounds and they melt congruently, and CeO1.5 has the quite similar properties as LaO1.5, CeO1.5, CeO2 and LaO1.5 were chosen as the associated species in the liquid phase. The Gibbs energy of liquid was expressed as follows:
 (1)
(1)
where  ,
,  and are the mole fractions of the species;
  ,
,  and
and 
are the Gibbs energies of liquid CeO1.5, CeO2 and LaO1.5, their values were from the Ce-O and La-O binary systems [4, 5], respectively. The binary interaction parameters between the CeO1.5, CeO2 and LaO1.5 species

 and
and  were to be evaluated in this work.
The experimental data from this work and literature [8-15] showed that the solubility of LaO1.5 in CeO2 was quite large, thus the associate solution model with the LaO1.5, CeO1.5 and CeO2 species was used to describe the fluorite phase. The Gibbs energy of fluorite has the similar expression as that of liquid and was not given here.
ZINKEVICH et al [4] and GRUNDY et al [5] have used a three-sublattice ionic solution model to describe the A- and H-form solid solution phases in Ce-O and La-O. For the sake of compatibility, the description (Ce+3, La+3, Ce+4)2(O-2)3(O-2, VA)1 was adopted here to describe the A- and H-type solid solutions. The Gibbs energy function was expressed as follows:
 (2)
(2)
where  and
and  are the site fractions of i and j on the first and third sublattices, respectively. The parameters denoted
  ,
,  and
and  were expressed relative to the Gibbs energies of compounds CeO1.5, LaO1.5 and CeO2 in A- or H-form structure. The values of the other three G parameters were given by
 (3)
(3)
 (4)
(4)
 (5)
(5)
 in Eq. (2) is the excess Gibbs energy which depends on the interaction between the species within each sublattice. It was here described by a Redlich-Kister polynomial and the interaction parameters were taken from the corresponding binary systems with some modifications of A- and H-LaO1.5.
The interactive parameters related to the CeO2-LaO1.5 system were evaluated using the computer-operated optimization program PARROT [16], which works by minimizing the square sum of the differences between measured and calculated values. The phase diagram information and thermodynamic parameters provided by DU et al [11] were used as a reference and the present experimental results were employed in the optimization.
Because CeO1.5 and LaO1.5 have the similar properties and form a continuous series of solid solutions, no interactive parameter between CeO1.5 and LaO1.5 was introduced in this work.
4 Results
The obtained thermodynamic parameters are listed in Table 2. These parameters together with the Gibbs energies of CeO2 and LaO1.5 evaluated by ZINKEVICH et al [4] and GRUNDY et al [5] allow the calculation of thermodynamic properties and the phase diagram of the CeO2-LaO1.5 system. Figure 3 shows the complete CeO2-LaO1.5 phase diagram calculated using the present set of thermodynamic parameters. The fit to most of the experimental data is good. But the data from MINKOVA and ASLANIAN [10] were obviously different with the other data and the present calculation.
Table 2 Optimized thermodynamic parameters of CeO2- LaO1.5*

Combining the thermodynamic parameters of Ce-O, La-O, Ce-La with those of CeO2-LaO1.5, some key sections of the Ce-La-O system are calculated. Figures 4 and 5 show the isothermal sections at 673 and 1 273 K, respectively. It can be seen that the A-type solid solution can co-exist with the CeLa solid solutions at lower temperature or co-exist with the liquid phase at higher temperature. The calculated vertical section of x(Ce)=9x(La) is shown in Fig. 6.

Fig. 3 Present calculated CeO2-LaO1.5 phase diagram
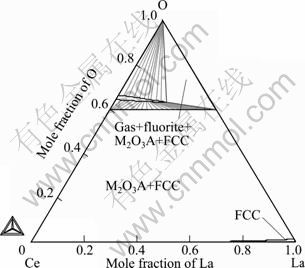
Fig. 4 Calculated isothermal section of Ce-La-O at 673 K
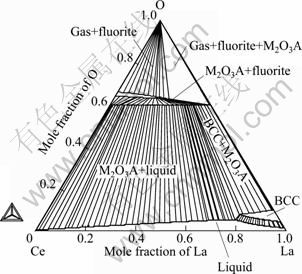
Fig. 5 Calculated isothermal section of Ce-La-O at 1 273 K
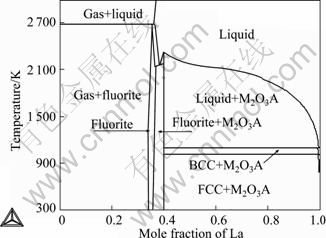
Fig. 6 Model-predicted vertical section at x(Ce)=9x(La) composition
5 Application
As mentioned in the previous section, this work will employ the thermodynamic functions of the Ce-La-O system to study the oxidation process of the Ce-La alloys. Thus the oxidation experiments of the Ce-La alloys and the corresponding thermodynamic calculation were implemented in this section.
5.1 Oxidation experiments
Three binary alloys with the compositions of 10%, 50% and 80 % La, respectively, were arc-melted using cerium (99.5%, mass fraction) and lanthanum (99.5%, mass fraction) by an arc furnace under high purity argon atmosphere. The buttons were cut into rectangular pieces with 3 mm��5 mm��5 mm in dimensions then the samples were ground with the kerosene protection.
Oxidation experiments on the Ce-La alloys were performed using Netzsch STA449C-type DSC at 473 K for 1-2 h, under an industrial air flow at 1.5 L/h. As shown in Fig. 7, a very obvious thermal effect is observed for the Ce-10 La alloy when the test took place about 1.5 h. For the other alloys, no sharp thermal effects are detected. After oxidation tests, all the samples were analyzed with XRD. The results from XRD analysis show that the Ce-10La and Ce-50La alloys are completely oxidized to fluorite (CeO2-based solid solution), while the Ce-80La alloy is oxidized to fluorite and LaO1.5. No CeO1.5 is detected for all the samples. Since the corresponding XRD patterns are very similar to those of CeO2�CLaO1.5 mixtures, they are not presented here.
5.2 Thermodynamic calculation and discussion
In order to understand the oxidation process and the relative products, the thermodynamic calculation were carried out. Figure 8 shows the stable Ce-La-O phase diagrams in air. The metastable phase diagram without fluorite phase is shown in Fig. 9. Compared with the two phase diagrams, the following conclusions can be drawn: Ce and La were first oxidized to CeO1.5 and LaO1.5, respectively, but CeO1.5 was quickly and completely oxidized to CeO2 since CeO1.5 was unstable. The obvious thermal effect observed for the Ce-10La alloy (Fig. 7) should be connected with the very rapid oxidation from CeO1.5 to CeO2. And since the solubility of LaO1.5 in CeO2 is large, the fluorite phase is unique oxidation products for most of the Ce-La alloys until the La content is very high.
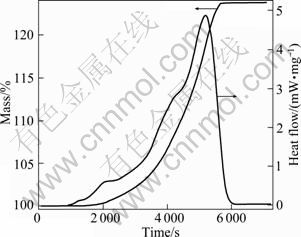
Fig. 7 TG-DSC pattern of Ce-10La alloy during oxidation

Fig. 8 Calculated phase diagram of Ce-La-O in air
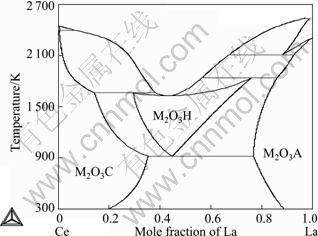
Fig. 9 Metastable phase diagram of Ce-La-O in air without considering fluorite
6 Conclusions
1) The mutual solubility between CeO2 and LaO1.5 at 1 273 K was investigated by XRD technique. The solubility of LaO1.5 in CeO2 is about 60%, and that of CeO2 in LaO1.5 is less than 5%.
2) The thermodynamic interactive parameters between CeO2 and LaO1.5 were assessed based on the new measured experimental data and literature information. The calculated phase diagram of CeO2-LaO1.5 using the obtained thermodynamic parameters agrees well with most of experimental data.
3) The oxidation experiments of the Ce-La alloys were designed and their behaviors were explained by the calculated phase diagrams and thermodynamic properties of Ce-La-O.
References
[1] WILKES M F, HAYDEN P, BHATTACHARYA A K. Surface segregation of lanthanum and cerium ions in ceria/lanthana solid solutions: Comparison between experimental results and a statistical-mechanical model [J]. App Sur Sci, 2003, 206: 12-19.
[2] ZHANG Y, GONG W P. Characterization of the surface oxidization reaction of Ce-5La alloy [J]. Min & Metall Eng, 2007, 27: 77-79.
[3] CHEN T F, GONG W P, YANG D R. Characterization of surface vapor reaction of Ce-10La alloy in pure hydrogen [J]. Min & Metall Eng, 2008, 28(8): 94-96.
[4] ZINKEVICH M, DJUROVIC D, ALDINGER F. Thermodynamic modeling of the cerium-oxygen system [J]. Solid state Ion, 2006, 177: 989-1001.
[5] GRUNDY A N, HALLSTEDT B, GAUCKLER L J. Thermodynamic assessment of the lanthanum-oxygen [J]. J Phase Equil, 2001, 22: 105-113.
[6] GSCHNEIDNER K A, CALDERWOOD F W. Ce-La phase diagram [J]. Bull Alloy Phase Diagr, 1982, 2(4): 445-446.
[7] ZINKEVICH M. Thermodynamics of rare earth sesquioxides [J]. Prog in Mater Sci, 2007, 52: 597-647.
[8] BRAUER G, GRADINGER H. Heterotype mixed phases among rare earth oxides [J]. Z Anorg Allgem Chem, 1954, 276: 209-226.
[9] BEVAN D J M, MANN A W. The crystal structure of Y7O6F9 [J]. Acta Cryst B, 1975, 31: 1406-1411.
[10] MINKOVA N, ASLANIAN S. Isomorphic substitutions in the CeO2-La2O3 system at 850 ��C [J]. Cryst Res Technol, 1989, 24: 351-354.
[11] DU Y, YASHIMA M, KOURA T, KAKIHANA M, YOSHIMURA M. Measurement and calculation of the ZrO2-CeO2-LaO1.5 phase diagram [J]. Calphad, 1996, 20: 95-108.
[12] MOGENSEN M, SAMMES N M, TOMPSETT G A. Physical, chemical and electrochemical properties of pure and doped ceria [J]. Solid state Ion, 2000, 129: 63-94.
[13] RYAN K M, MCGRATH J P, FARRELL R A, O��NEILL W M, BARNES C J, MORRIS A M. Measurements of the lattice constant of ceria when doped with lanthana and praseodymia��The possibility of local defect ordering and the observation of extensive phase separation [J]. J Phys: Condens Matter L, 2003, 15: 49-58.
[14] WILKES M F, HAYDEN P, BHATTACHARYA A K. Catalytic studies on ceria lanthana solid solutions III: Surface segregation and solid state studies [J]. J Catal, 2003, 219: 305-309.
[15] BELLIERE V, JOORST G, STEPHAN O, de GROOT F M F, WECKHUYSEN B M. Phase segregation in cerium-lanthanum solid solutions [J]. J Phys Chem B, 2006, 110: 9984-9990.
[16] SUNDMAN B, JANSSON B, ANDERSSON J O. The thermo-calc databank system [J]. Calphad, 1985, 9: 153-190.
Ce-La-O��ϵ��ͼ����ѧ��Ӧ��
��ΰƽ1, 2, �� ��1, ����ʤ1
1. ���ϴ�ѧ ��ĩұ������ص�ʵ���ң���ɳ 410083��
2. ����ѧԺ ���ӿ�ѧϵ������ 516001
ժ��Ҫ������ʵ�����������ѧ�������ϵķ�����ϵͳ�о�Ce-La-O��ϵ��ͼ����ѧ��Ce-La�Ͻ��������Ӧ���̡��Ʊ�һϵ�в�ͬ�ɷֵ�CeO2-LaO1.5����ﲢ�������X-������������������LaO1.5��CeO2�� 1 273 Kʱ������ܶȣ����ø��о������Լ����ױ�����ʵ�����ݣ��Ż���CeO2-LaO1.5��ϵ��ͼ��������е�Ce-O��La-O��ϵ����ѧ������������Ce-La-O��ϵ״̬ͼ��������Ce-La�Ͻ��������Ӧ���̣�����ֻҪLa����������80%��Ce-La�Ͻ���������γ�CeO2Ϊ���Ĺ����塣
�ؼ��ʣ�Ce-La�Ͻ���ͼ������ѧ��������Ӧ
(Edited by LI Xiang-qun)
Foundation item: Project (51171069) supported by the National Natural Science Foundation of China; Project (S2011010004094) supported by Natural Science Foundation of Guangdong Province, China; Project support by the Special Talents of Higher Education Office of Guangdong Province ,China
Corresponding author: GONG Wei-ping; Tel: +86-731-88877824; E-mail: weiping_gong@mail.csu.edu.cn
DOI: 10.1016/S1003-6326(11)61109-6

