Dynamic simulation of pilot thickener operation using phenomenological model with results validation for continuous and discontinuous tests
��Դ�ڿ������ϴ�ѧѧ��(Ӣ�İ�)2017���5��
�������ߣ�Rahimi Mehdi Unesi Majid Rezai Bahram Abdollahzadeh Ali
����ҳ�룺1207 - 1216
Key words��dynamic simulation; dewatering; thickener behavior; pilot thickener; validation
Abstract: The phenomenological theory of sedimentation-thickening processes predicts the settling behavior of a flocculated suspension in dependence of two functions, the batch flux density function and the effective solid stress. These functions were determined using batch settling tests. The governing equations for sedimentation were then solved numerically for these functions and the predictions were compared to the experimental results from pilot scale thickener tests. Firstly, the continuous tests were performed in the plexiglass pilot thickener at different feed flow rates and discharge rates and the solid volume fraction of discharge, the bed height and the time were recorded for each condition. These tests were also simulated and it was observed that there is a good agreement between the results of continuous tests and the results of dynamic simulation. Secondly, the discontinuous tests were performed in the plexiglass pilot thickener at different feed flow rates with a discharge rate of zero. The bed formation rate was determined for each condition. These tests were also simulated and it was observed that there is a good agreement between the results of discontinuous tests and the results of simulation.
Cite this article as: Rahimi Mehdi, Rezai Bahram, Abdollahzadeh Ali, Unesi Majid. Dynamic simulation of pilot thickener operation using phenomenological model with results validation for continuous and discontinuous tests [J]. Journal of Central South University, 2017, 24(5): 1207-1216. DOI: 10.1007/s11771-017-3524-7.
J. Cent. South Univ. (2017) 24: 1207-1216
DOI: 10.1007/s11771-017-3524-7

Rahimi Mehdi1, Unesi Majid2, Rezai Bahram1, Abdollahzadeh Ali1, 3
1. Department of Mining and Metallurgical Engineering, Amirkabir University of Technology,
Tehran 15875-4413, Iran;
2. Young Researchers and Elites Club, Science and Research Branch, Islamic Azad University,
Tehran 1477893855, Iran;
3. Department of Mining Engineering, University of Kashan, Kashan 8731753153, Iran
 Central South University Press and Springer-Verlag Berlin Heidelberg 2017
Abstract: The phenomenological theory of sedimentation-thickening processes predicts the settling behavior of a flocculated suspension in dependence of two functions, the batch flux density function and the effective solid stress. These functions were determined using batch settling tests. The governing equations for sedimentation were then solved numerically for these functions and the predictions were compared to the experimental results from pilot scale thickener tests. Firstly, the continuous tests were performed in the plexiglass pilot thickener at different feed flow rates and discharge rates and the solid volume fraction of discharge, the bed height and the time were recorded for each condition. These tests were also simulated and it was observed that there is a good agreement between the results of continuous tests and the results of dynamic simulation. Secondly, the discontinuous tests were performed in the plexiglass pilot thickener at different feed flow rates with a discharge rate of zero. The bed formation rate was determined for each condition. These tests were also simulated and it was observed that there is a good agreement between the results of discontinuous tests and the results of simulation.
Key words: dynamic simulation; dewatering; thickener behavior; pilot thickener; validation
1 Introduction
In the industry, tailings should be thickened to high solids content to recover water but not too high so as to damage the thickener or underflow pump. During thickener operation, it is often desired to control the underflow solids concentration to be within a certain range. Researchers have presented many models and experimental results to present the thickening process and predict the relationships between parameters but many of these works have empirical nature [1]. Many other researchers have presented the ODE model to present the thickening process [2-8] but PDE model is more acceptable than ODE model for thickening process [9].
The phenomenological model was proposed [10-12] for the sedimentation and thickening process by considering several constitutive assumptions. This theory allows the incorporation of compression/consolidation effects to the thickener modeling which was unavailable previously due to the non-existence/insignificance of bed/sediment inside conventional thickeners. In this model, the authors have considered the effect of effective solid stress, solid volume fraction at the beginning of compressive zone, hindered settling, feed flow rate and discharge rate and cross sectional area of the thickener for the designing and simulation of a continuous thickener. The other parameters such as flocculant dosage, pH and particle size can affect the effective solid stress, solid volume fraction at the beginning of compressive zone and hindered settling. Therefore, these parameters can affect the thickening performance.
USHER and SCALES [13] developed an algorithm to account for the solid volume fraction of the thickener underflow and mudline height of fundamental suspension properties. This algorithm could not predict suspension properties in the shear process. GLADMAN [14] improved this model by shearing the suspension, but did not consider aggregate densification. USHER et al [15] developed the suspension dewatering equations based on aggregate densification. They presented the liquid flow velocity around and through aggregates. GLADMAN et al [16] investigated the effect of shear on gravity thickening. They developed an experimental method that enabled shear to be incorporated into the suspension dewatering characterization. They found that an order of magnitude increase in solid flux density can be expected under the controlled shear conditions with polymer flocculated aggregates. The results also indicate that the mechanical shear is not the only factor that can enhance dewatering, since higher beds, and hence longer residence times, also improve the achievable solids flux density. DEVENTER et al [17] used the aggregate densification theory to predict the final equilibrium bed height by densification rate and bed compression. Moreover, the relationship between aggregate size and thickening time was obtained. EBRAHMIZADEH et al [18] combined the population balance models with computational fluid dynamics (CFD) for modeling the tailing thickener. They simulated the industrial tailing thickener using computational fluid dynamics (CFD) method and the effect of feed flow rate, flocculant dosage, inlet solid percent and feedwell was investigated. The simulation results showed good agreement with the operational data. GALVEZ et al [19] presented a method for optimizing the design of dewatering systems that employs hydrocyclones and thickeners. Mathematical models were generated to determine the maximum water recovery rate and to determine the minimum cost of the equipment and the corresponding system structure for the given water recovery rates. The models were based on mixed integer nonlinear programming. ZHOU et al [20] established validated mathematical model as well as three-dimensional computational fluid dynamics (CFD) model to characterizing the flow regions in red mud separation thickener's feedwells. Their results showed that the inlet feed rate and the aspect ratio of feedwells are the most important parameters which affect the RTD of feedwell. They showed that under the optimal operation conditions, the volume fraction of dead zone can be reduced by 10.8% and the volume fraction of mixing flow can be increased by 6.5%. BETANCOURT et al [21] presented a recent approach for the flux identification in the case of a suspension that shows no compressive behavior. RAHIMI et al [22] investigated the effect of pH, flocculant dosage and particle size on gel point and effective solid stress parameters of coal flotation tailing.
In this work experimental tests were performed using a plexiglass thickener ( 4 m in height and 0.2 m in internal diameter) at different feed flow rates and discharge rates and for each condition, solid volume fraction of discharge and bed height were measured at different times. Also, these tests were simulated using the phenomenological model proposed by BURGER et al [11] and solid volume fraction of discharge and bed height were obtained at different times. On the other hand, the results of dynamic simulation using the phenomenological model were validated using the experimental tests with plexiglass pilot thickener that has been considered less by the other investigators.
2 Mathematical model of sedimentation and thickening
The following field equation is presented [10-12] for the solid volume fraction (��) in the thickener as a function of height 0��z��L and time 0��t��T:
 (1)
(1)
where �� is the solid volume fraction; z is the thickener height; ���� is the solid�Cfluid density difference and g is acceleration of gravity. In Eq. (1), we have:
q=(QD/S)��0
where QD is the volumetric discharge rate and S is the cross-sectional area of the thickener. In Eq. (1), fbk(��) is the batch flux density function. It is usually assumed that fbk(��)=0 for ��=0 and ��=1 and fbk(��)<0 for 0<��<1. A typical semi-empirical constitutive equation is given by [23]
fbk(��)=u����(1-��)b (2)
where the parameter b is a constant that is obtained through using the experimental tests and u�� represents the settling velocity of a single particle in unbounded fluid. For a particle of small diameter d, the velocity u�� is usually assumed to be given by the Stokes formula.
u��=-����gd2/(18��f) (3)
where ��f is the dynamic viscosity of the pure fluid.
In Eq. (1), we have:
 (4)
(4)
where ��e(��) is the effective solid stress and ��c is the critical solid volume fraction or gel point. The critical solid volume fraction (��c) or gel point is the solid volume fraction at the beginning of the compression zone and is the lowest volume fraction that flocs begin to touch each other. By increasing the pressure, the solid volume fraction increases. The effective solid stress (��e(��)) which represents the stress in the compression zone is the stress which must be exceeded by an applied stress before the consolidation will occur. BUSCALL and WHITE [24] suggested that the effective solid stress, ��e(��), is a function of the solid volume fraction, ��, and can be obtained through using Eq. (5):
 (5)
(5)
where parameters ��0 and n are the constant parameters that are obtained using experimental tests and ��c is the critical solid volume fraction or gel point. Equation (1) is a second order quasilinear parabolic partial differential equation degenerating into first order hyperbolic type for the interval of solution values [0, ��c]. Equation (1) does not have an analytical solution, but can be solved numerically using a finite difference method. The following initial conditions for solving degenerate parabolic partial differential equation (PDE) should be determined:
��(z, 0)=��0(z), 0��z��L (6)
��(L, t)=��1(t), 0��t��T (7)
The boundary conditions at z=0 and z=L for solving the degenerate parabolic partial differential equation (PDE) are as follows:
 (8)
(8)

 (9)
(9)
where QF is the feed flow rate, ��F is the solid volume fraction of the thickener feed and QD is the volumetric discharge rate
As mentioned before, Eq. (1) is complicated and does not have an analytical solution, but can be solved numerically using the finite difference method. PDE is discretized such that the entire thickener is modelled as a number of vertical sections (cells) with the height of ��x=L/J and ��t=T/N, where J and N are integers representing the number of cells and number of time-steps respectively. Let  denote the approximate value of �� at (xj, tn) where xj=j��x, tn=n��t. With assuming initial conditions
  for j=0, 1, 2, ��, J, the discretized Eq. (1) is as follows:


 (10)
(10)
where
Sj+1/2=(Sj+Sj+1)/2 (11)
 (12)
(12)
 for �աܦ�c and A(��)=
 for ��>��c, where

 (13)
(13)
That parameters b and n are obtained using Eqs. (2) and (5), respectively.

 (14)
(14)
 (15)
(15)
Incorporating the approximated boundary conditions given in Eqs. (8) and (9), the process descriptions in the discharge (j=0) and feed (j=J) are given as follows:


(16)


 (17)
(17)
To ensure the convergence of the resulting scheme, the following stability criterion must be satisfied:

 (18)
(18)
3 Material and method
3.1 Material
3.1.1 Sample preparation and characterization
Tailing samples from Sarcheshmeh Copper Flotation Plant, located in Iran, were used in all experiments. Particle size analysis and XRD test was then conducted using this samples. Chemical and mineralogical analyses were performed by X-ray fluorescence (XRF) spectrometry and X-ray diffraction (XRD). Table 1 shows these results.
Table 1 X-ray Fluorescence (XRF) and X-ray diffraction (XRD) analysis of tailings sample

Sieve analysis for this sample was done and these results were obtained:
d100=300 ��m, d80=120 ��m, d50=40 ��m
The solid density (��s) was determined using a pycnometer (100 cm3), and solid density for this sample was 2800 kg/m3.
3.1.2 Pilot column
A plexiglass column, which was 4 m in height and 0.2 m in internal diameter, was used for pilot experiments. The feed and flocculant were introduced to the column at a height of approximately 3 m via a feed-well by peristaltic pumps. The feed flow rate and flocculant dosage can be adjusted using these peristaltic pumps. The diluent water was also introduced at this column height. Overflow was then collected by a peripheral launder. The discharge rate can also be adjusted using a peristaltic pump. Figure 1 shows this setup.
1) Continuous column tests
In continuous tests, the dynamic column tests were performed. In this section, column test was performed at one feed flow rate and one discharge rate. When the pulp
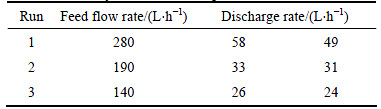
reached to steady state condition, the solid volume fraction of discharge, the bed height and the time were recorded and the discharge rate was changed and when the pulp reached to steady state condition, these parameters were recorded for this condition and then the discharge rate was changed. For each condition, 4 column underflow samples were collected at 15 min intervals. This method was repeated for the other feed flow rates. Table 2 shows the conditions at which these continuous experiments were performed.

Fig. 1 A schematic diagram of pilot thickener
Table 2 Summary of continuous experiments
No solids were recorded in the overflow for each condition used in the experiments, and the supernatant was always observed to be clear.
2) Discontinuous tests
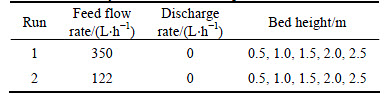
Discontinuous tests were also conducted for different feed flow rates and for each feed flow rate, the discharge rate was zero. After column start-up, the bed of solids began to form, and the relevant interface could be readily detected (by eye). The bed height gradually increased and when the solid bed reached the desired height (0.5 to 2.5 m), the time was recorded and bed formation rate for each feed flow rate (the discharge rate was zero) was determined. Table 3 shows the conditions that these discontinuous experiments were performed.
Table 3 Summary of discontinuous experiments
In this work, an anionic flocculant with a trade name of NF43U from SNF Company was used for the experimental tests. For all experiments, flocculant dosage was 25 g/t and the pH of the thickener feed was kept as 11 which were the flocculant dosage and pH and in the plant.
3.2 Method
3.2.1 Gel point and effective solid stress measurement
For numerical simulation of the pilot thickener using Eqs. (10)-(18) and comparison of these results with the results of pilot experiments, the results of the gel point and the effective solid stress measurement at the same condition of the pilot experiments (d80=120 ��m, pH=11 and flocculant dosage=25 g/t) are required.
Experimental methods for the measurement of the gel point and effective solid stress have completely been explained in Ref. [22].
The gel point (��c) can be found from the initial slope of ��0h0 as a function of hc obtained from different settling tests.
��c=d(��0��h0)/dhc (19)
where ��0 and h0, are the initial solid volume fraction and initial height of the suspension respectively for each settling test and hc is the equilibrium height of the sediment bed that can be calculated from each batch settling curve.
According to the experimental tests, the gel point or critical solid volume fraction at d80=120 ��m, pH=11 and flocculant dosage=25 g/t was obtained 0.17 (��c=0.17)
The effective solid stress for this work is assumed to be in the functional form given in Eq. (5) and the constants n and ��0 are determined by the best fit to the experimental data. In Eq. (5), ��0 and n are constant parameters that can be obtained using batch centrifuge experiments. Using experimental tests, several effective solid stress and corresponding solid volume fraction are obtained and using Eq. (5), constant parameters ��0 and n are calculated.
According to the experimental tests, the constant parameters of effective solid stress equation as a function of the solid volume fraction at d80=120 ��m, pH=11 and flocculant dosage=25 g/t are as follows:
��0=2818 Pa, n=1.8
Therefore, the effective solid stress equation as a function of the solid volume fraction at d80=120 m, pH=11 and flocculant dosage=25 g/t is as follows:
��e(��)=2818[(��10.17)1.8-1]
Figure 2 compares the data obtained from experimental tests and data predicted from mentioned model.

Fig. 2 Comparison of data obtained from experimental tests and data predicted from model
It can be seen from Fig. 2 that the results of experimental tests are in agreement with results of the model. Therefore, this model is suitable for measurement of the effective solid stress.
3.2.2 Determination of batch flux density function
As mentioned in section 3.2.1, for numerical simulation using Eqs.(10)-(18), the equation of the batch flux density as a function of solid volume fraction at the same condition of the pilot experiments (pH=11, flocculant dosage=25 g/t and d80=120 ��m) is required.
Batch flux density function is obtained using the batch settling curve and Eq. (20) [25]:
fbk(��i)=vi����i (20)
where vi and ��i are settling velocity and corresponding solid volume fraction, respectively. Thus, on the sedimentation curve, if tangents are drawn at several points, the slope of each tangent gives the vi and intercept with the y-axis gives the Hi. Then the ��i is obtained from this equation:
��i=(��0��h0)/Hi (21)
where the ��0 and h0 are initial solid volume fraction and initial suspension height of batch settling test, respectively. Therefore, the batch flux density function is obtained using this equation:
fbk(��i)=vi��(��0��h0)/Hi (22)
For each tangent, fbk and the corresponding solid volume fraction are obtained. Therefore, several fbk and corresponding solid volume fraction are obtained. According to section 2, batch flux density function, fbk (��), as a function of the solid volume fraction, �� can be obtained by best fit to the functional form given in Eq. (2). Therefore, using obtained data and Eq. (2), the parameter b can be obtained.
According to the experimental tests, the constant parameter of the batch flux density, fbk(��), as a function of the solid volume fraction at d80=120 ��m, pH=11 and flocculant dosage=25 g/t is as follows:
b=20
Therefore, batch flux density as a function of the solid volume fraction at d80=120 ��m, pH=11 and flocculant dosage=25 g/t is as follows:
fbk(��)=-0.01412���ա�(1-��)20
Figure 3 compares the data obtained from experimental tests and data predicted from mentioned model.
It can be seen from Fig. 3 that the results of experimental tests are in agreement with results of the model. Therefore, this model is suitable for measurement of the effective solid stress.

Fig. 3 Comparison of data obtained from experimental tests and data predicted from model
4 Results and discussion
4.1 Continuous pilot column tests
1) Experimental tests
As mentioned in section 3.1.2, in continuous tests, the dynamic column tests were performed at different feed flow rates and discharge rates and for each condition, the solid volume fraction of discharge, the bed height and the time ware recorded. It should be mentioned that the other conditions (d80=120 ��m, pH=11 and flocculant dosage=25 g/t) were constant for all pilot thickener experiments. Table 4 shows the results of pilot thickener experiments.
2) Dynamic simulation
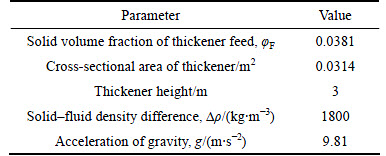
In order to carry out the dynamic simulation of the pilot thickener, gel point, effective solid stress function and batch flux density function were determined at the same condition of the pilot experiments (d80=120 ��m, pH=11 and flocculant dosage=25 g/t). The other
parameters, which are used for simulation, have been shown in Table 5.
Table 4 Results of continuous tests with pilot thickener
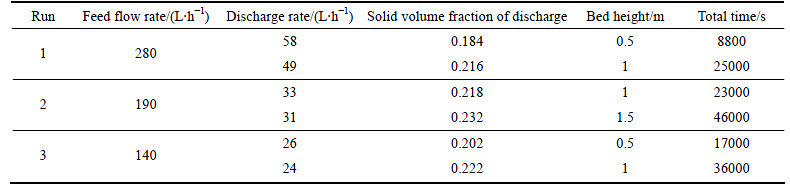
Table 5 Properties proposed to solve model
In this study, ��x=0.12 m (selected by us) and according to Eq. (18), the time step (��t) was obtained 10 s (��t=10 s).
Therefore, dynamic simulation is performed using Eqs.(10)-(18), results of gel point, effective solid stress function and batch flux density function measurement and also parameters that have been shown in Table 5.
Figure 4 shows the dynamic simulation for QF= 280 L/h and two discharge rates that were changed with time (QD=58 and 49 L/h).

Fig. 4 Results of dynamic simulation, QF=280 L/h, QD=58 and 49 L/h
It can be seen from Fig. 4 that for QF=280 L/h and QD=58 L/h, time reaching the steady state condition, the solid volume fraction of discharge and the bed height were 1��105 s, 0.182 and 0.4 m. Then, the discharge rate was changed to 49 L/h. The results show that for this condition, the total time and the time from steady state 1 to 2 were 2.7��104 s and 1.7��104 s, respectively. For new condition, the solid volume fraction of discharge and the bed height were 0.213 and 0.9 m, respectively.
With comparing the results of dynamic simulation using phenomenological model (Fig. 4) and the results of experimental tests with pilot thickener for QF=280 L/h and two discharge rates (Table 4. Run 1), these results are obtained:
�� It can be seen from Table 4. Run 1 that for QD=58 L/h, the total time to reach the steady state condition, the bed height and the solid volume fraction of discharge are 8800 s, 0.5 m and 0.184, respectively. It can be seen from Fig. 4 that for this condition, the mentioned parameters are 1��104 s, 0.4 m and 0.182, respectively.
�� It can be seen from Table 4. Run 1 that for QD=49 L/h, the total time, the time from steady state condition 1 to 2, the bed height and solid volume fraction of discharge are, 2.5��104 s, 1.62��104 s, 1 m and 0.216, respectively. It can be seen from Fig. 4 that for this condition, the mentioned parameters are 2.7��104 s, 1.7��104 s, 0.9 m and 0.213, respectively
Therefore, it can be observed that for QF=280 L/h and two discharge rates QD=58 and 49 L/h, the results of dynamic simulation are agreement with the results of experimental tests with pilot thickener. It can be concluded from Fig. 4 and Table 4 that with 18.3% increase in volumetric discharge rate, the solid volume fraction of discharge decreased from 0.216 to 0.184 and the bed height decreased from 1 m to 0.5 m.
Figure 5 shows the dynamic simulation for QF= 190 L/h and two discharge rates that were changed with time (QD=33, 31 L/h).

Fig. 5 Results of dynamic simulation, QF=190 L/h, QD=33 and 31 L/h
It can be seen from Fig. 5 that for QF=190 L/h and QD=33 L/h the time to reach the steady state condition, the solid volume fraction of discharge and the bed height were 2.5��104 s, 0.2155 and 0.9 m. Then the discharge rate was changed to 31 L/h. The results show that for this condition, the total time and the time from steady state 1 to 2 were 4.9��104 s and 2.4��104 s, respectively. For the new condition, the solid volume fraction of discharge and the bed height were 0.23 and 1.4 m, respectively.
With comparing the results of dynamic simulation using phenomenological model (Fig. 5) and the results of experimental tests with pilot thickener for QF=190 L/h and two discharge rates (Table 4. Run 2), these results are obtained.
�� It can be seen from Table 4. Run 2 that for QD=33 L/h, the total time to reach the steady state condition, the bed height and the solid volume fraction of discharge are 2.3��104 s, 1 m and 0.218, respectively. It can be seen from Fig. 5 that for this condition, the mentioned parameters are 2.5��104 s, 0.9 m and 0.2155, respectively.
�� It can be seen from Table 4. Run 2 that for QD=31 L/h, the total time, the time from steady state condition 1 to 2, the bed height and solid volume fraction of discharge are, 4.6��104 s, 2.3��104 s, 1.5 m and 0.232, respectively. It can be seen from Fig. 5 that for this condition, the mentioned parameters are 4.9��104 s, 2.4��104 s, 1.4 m and 0.23, respectively.
Therefore, it can be observed that for QF=190 L/h and two discharge rates QD=33 and 31 L/h, the results of dynamic simulation are agreement with the results of experimental tests with pilot thickener.
It can be concluded from Fig. 5 and Table 4 that with 6.4% increase in volumetric discharge rate, the solid volume fraction of discharge decreased from 0.232 to 0.218 and the midline height decreased from 1.5 m to 1 m.
Figure 6 shows the dynamic simulation for QF= 140 L/h and two discharge rates that were changed with time (QD=26, 24 L/h). It can be seen from Fig. 6 that for QF=140 L/h and QD=26 L/h the time to reach the steady state condition, the solid volume fraction of discharge and the bed height were 2��104 s, 0.201 and 0.5 m. Then the discharge rate was changed to 24 L/h. The results show that for this condition, the total time and the time from steady state 1 to 2 were 3.9��104 s and 1.9��104 s, respectively. For the new condition, the solid volume fraction of discharge and the bed height were 0.22 and 0.9 m, respectively.
With comparing the results of dynamic simulation using phenomenological model (Fig. 4) and the results of experimental tests with pilot thickener for QF=140 L/h and two discharge rates (Table 4. Run 3), these results are obtained.
�� It can be seen from Table 4. item 3 that for QD=26 L/h, the total time to reach the steady state condition, the bed height and the solid volume fraction of discharge are 1.7��104 s, 0.5 m and 0.202, respectively. It can be seen from Fig. 4 that for this condition, the mentioned parameters are 2��104 s, 0.5 m and 0.2, respectively.
�� It can be seen from Table 4. Run 3 that for QD=24 L/h, the total time, the time from steady state condition 1 to 2, the bed height and solid volume fraction of discharge are, 3.6��104 s, 1.9��104 s, 1 m and 0.222, respectively. It can be seen from Fig. 6 that for this condition, the mentioned parameters are 3.9��104 s, 1.9��104 s, 0.9 m and 0.22, respectively.
Therefore, it can be observed that for QF=140 L/h and two discharge rates QD=26 and 24 L/h, the results of dynamic simulation are agreement with the results of experimental tests with pilot thickener. It can be concluded from Fig. 6 and Table 4 that with 8.4% increase in the volumetric discharge rate, the solid volume fraction of discharge decreased from 0.222 to 0.202 and the bed height decreased from 1 m to 0.5 m.
Therefore, the results show that there is a good agreement between the results of dynamic simulation of the pilot thickener using phenomenological model and the results of continuous column tests.

Fig. 6 Results of dynamic simulation, QF=140 L/h, QD=26 and 24 L/h
4.2 Discontinuous tests
Discontinuous tests were also conducted for different feed flow rates and for each feed flow rate, the discharge rate was zero. Also, dynamic simulation was performed using Eqs. (10)-(18) and these results were compared to the results of experimental tests. Figures 7 and 8 compare the results of discontinuous column tests and the results of dynamic simulation for feed flow rates 350 and 122 L/h, respectively.
It can be seen from Fig. 7 (QF=350 L/h) that:�� The bed formation rate was obtained 0.0491 m/min (0.000818 m/s) from experimental tests. �� The bed formation rate was obtained 0.0448 m/min (0.000747 m/s) from dynamic simulation using phenomenological model. �� It can be observed that the difference between the results of dynamic simulation and experimental tests for this feed flow rate is 8.7%. Therefore, it can be concluded that there is a good agreement between the results of dynamic simulation and the results of experimental tests.

Fig. 7 Comparing results of discontinuous tests and results of dynamic simulation for QF=350 L/h
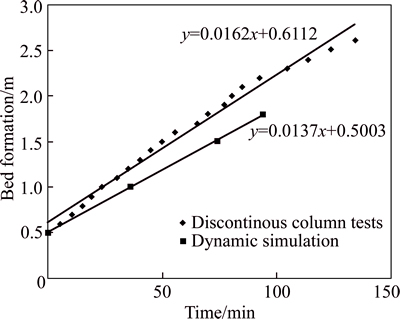
Fig. 8 Comparing results of discontinuous tests and results of dynamic simulation for QF=122 L/h
It can also be seen form Fig. 8 (QF=122 L/h) that: �� The bed formation rate was obtained 0.0162 m/min (0.00027 m/s) from experimental tests. ��The bed formation rate was obtained 0.0137 m/min (0.000228 m/s) from dynamic simulation using phenomenological model. �� It can be observed that the difference between the results of dynamic simulation and the experimental tests for this feed flow rate is 15%. Therefore, it can be concluded that there is a good agreement between the results of dynamic simulation and the results of experimental tests.
Therefore, Figs. 7 and 8 show that there is a good agreement between the results of dynamic simulation and the results of discontinuous column tests.
5 Conclusions
In this work, the continuous and discontinuous tests were performed in the pilot thickener at different feed flow rates and discharge rates and solid volume fraction of discharge and bed height were recorded for different conditions and these tests were simulated using the phenomenological model for sedimentation and thickening and results of experimental tests and dynamic simulation were compared. It was observed that the results of continuous and discontinuous tests are in good agreement with the results of dynamic simulation. Therefore, it can be concluded that the dynamic simulation using the phenomenological model can be used for prediction of thickener behavior and the results of the simulation are reliable.
References
[1] BUSCALL R, MILLS P D A, STEWART R F, SUTTON D, WHITE L R, YATES G E. The rheology of strongly-flocculated suspensions [J]. Journal of Non-Newtonian Fluid Mechanics, 1987, 24(2): 183-202.
[2] VITASOVIC Z Z. Continuous settler operation: A dynamic model [M]// PATRY G G, CHAPMAN D. Dynamic Modelling and Expert Systems in Wastewater Engineering. USA: Lewis, Chelsea, MI, 1989.
[3] VACCARI D A, UCHRIN C G. Modeling and simulation of compressive gravity thickening of activated sludge [J]. Journal of Environmental Science and Health A, 1989, 24(6): 645-674.
[4] OTTERPOHL R, FREUND M. Dynamic models for clarifiers of activated sludge plants with dry and wet weather flows [J]. Water Science and Technology, 1992, 26: 1391-1400.
[5] HARTEL L, POPEL H J. A dynamic secondary clarifier model including processes of sludge thickening [J]. Water Science and Technology, 1992, 25: 267-284.
[6] HAMILTON J, JAIN R, ANTONIOU P, SVORONOS S A, KOOPMAN B, LYBERATOS G. Modeling and pilot scale experimental verification for predenitrification process [J]. Journal of Environmental Engineering, 1992, 118(1): 38-55.
[7] OZINSKY A E, EKAMA G A, REDDY B D. Mathematical simulation of dynamic behaviour of secondary settling tanks [R]. Technical Report W85. South Africa: Dept of Civil Engineering, University of Cape Town, 1994.
[8] WATTS R W, SVORONOS S A, KOOPMAN B. One-dimensional modeling of secondary clarifiers using a concentration and feed velocity-dependent dispersion coefficient [J]. Water Research, 1996, 30(29): 2112-2124.
[9] BURGER R, DIEHL S, NOPENS I. A consistent modelling methodology for secondary settling tanks in wastewater treatment [J]. Water Research, 2001, 45: 2247-2260.
[10] BURGER R, CONCHA F. Mathematical model and numerical simulation of the settling of flocculated suspensions [J]. International Journal of Multiphase Flow, 1998, 24: 1005-1023.
[11] BURGER R, BUSTOS M C, CONCHA F. Settling velocities of particulate systems: 9. Phenomenological theory of sedimentation processes: numerical simulation of the transient behavior of flocculated suspensions in an ideal batch or continuous thickener [J]. International Journal of Mineral Processing, 1999, 55(4): 267-282.
[12] GARRIDO P, BURGOS R, CONCHA F, BURGER R. Settling velocities of particulate systems: A simulator for batch and continuous sedimentation of flocculated suspensions [J]. International Journal of Mineral Processing, 2004, 73(2-4): 131-144.
[13] USHER S P, SCALES P J. Steady state thickener modeling from the compressive yield stress and hindered settling function [J]. Chemical Engineering Journal, 2005, 111(2, 3): 253-261.
[14] GLADMAN B R. The effect of shear on dewatering of flocculated suspensions [D]. Melbourne, Australia: Department of Chemical and Biomolecular Engineering, The University of Melbourne, 2005.
[15] USHER S P, SPEHAR R, SCALES P J. Theoretical analysis of aggregate densification: impact on thickener performance [J]. Chemical Engineering Journal, 2009, 151(1-3): 202-208.
[16] GLADMAN B R, RUDMAN M, SCALES P J. The effect of shear on gravity thickening: Pilot scale modeling [J]. Chemical Engineering Science, 2010, 65(14): 4293-4301.
[17] van DEVENTER B B G, USHER S P, KUMAR A, RUDMAN M, SCALES P J. Aggregate densification and batch settling [J]. Chemical Engineering Journal, 2011, 171(1): 141-151.
[18] EBRAHIMZADEH M, GOHARRIZI A S, SHAHRIVAR A A, ABDOLLAHI H. Modeling industrial thickener using computational fluid dynamics (CFD), A case study: Tailing thickener in the Sarcheshmeh copper mine [J]. International Journal of Mining Science and Technology, 2013, 23(6): 885-892.
[19] GALVEZ E D, CRUZ R, ROBLES P A, CISTERNAS L A. Optimization of dewatering systems for mineral processing [J]. Minerals Engineering, 2014, 63: 110-117.
[20] ZHOU T, MAO Li M, LI Q L, LEI B, CHENN Q Z, ZHOU J M. Numerical simulation of flow regions in red mud separation thickener��s feedwell by analysis of residence-time distribution [J]. Transactions of Nonferrous Metals Society of China, 2014, 24(4): 1117-1124.
[21] BETANCOURT F, BURGER R, DIEHL S, MEJIAS C. Advanced methods of flux identification for clarifier�Cthickener simulation models [J]. Minerals Engineering, 2014, 63: 2-15.
[22] RAHIMI M, ABDOLLAHZADEH A, REZAI B. The effect of particle size, pH and flocculant dosage on the gel point, effective solid stress and thickener performance of coal washing plant [J]. International Journal of Coal Preparation and Utilization, 2015, 35: 125-142.
[23] RICHARDSON J F, ZAKI W N. The sedimentation of a suspension of uniform spheres under conditions of viscous flow [J]. Chemical Engineering Science, 1954, 3(2): 65-73.
[24] BUSCALL R, WHITE L R. The consolidation of concentrated suspensions part 1. The theory of sedimentation [J]. Journal of the Chemical Society, 1987, 83: 873-891.
[25] KYNCH C J. A theory of sedimentation [J]. Transactions of the Faraday Society, 1952, 48: 166-176.
(Edited by DENG L��-xiang)
Cite this article as: Rahimi Mehdi, Rezai Bahram, Abdollahzadeh Ali, Unesi Majid. Dynamic simulation of pilot thickener operation using phenomenological model with results validation for continuous and discontinuous tests [J]. Journal of Central South University, 2017, 24(5): 1207-1216. DOI: 10.1007/s11771-017-3524-7.
Received date: 2016-02-26; Accepted date: 2016-07-27
Corresponding author: Razai Bahram, PhD; Tel: +989123873642; E-mail: b.rezai@hotmail.com

