
Cross-sectional distortion behaviors of thin-walled rectangular tube in rotary-draw bending process
ZHAO Gang-yao(赵刚要), LIU Yu-li(刘郁丽), YANG He(杨 合), LU Cai-hong(卢彩红)
College of Materials Science and Engineering, State Key Laboratory of Solidification Processing,
Northwestern Polytechnical University, Xi’an 710072, China
Received 25 December 2008; accepted 19 May 2009
Abstract: The cross-sectional distortion usually appears during rotary-draw bending process of thin-walled rectangular tube with small bending radius. To study the cross-sectional distortion of the tube, a three-dimensional finite-element model of the process was developed based on ABAQUS/Explicit code and its reliability was validated by experiment. Then, the cross-sectional distortion behaviors of the tube were investigated. The results show that a zone of larger circumferential stress appears on the tube when bending angle reaches 30?. And in the larger circumferential stress zone, the sagging phenomenon is produced obviously. The maximum cross-sectional distortion is located in the larger circumferential stress zone and the angle between the plane of maximum cross-sectional distortion and the bending reference plane is about 50?. The position of the maximum cross-sectional distortion keeps almost unchanged with the variation of the clearances between dies and tube.
Key words: thin-walled rectangular tube; aluminum alloy 3A21; rotary-draw bending; cross-sectional distortion; die clearance
1 Introduction
The bent parts of thin-walled rectangular aluminum alloy tube are widely used in aerospace, aviation and radar system etc with the advantages of light-weight, good vibration absorbability, and low waveguide loss and so on. This type of tube can be prepared using several methods, such as rotary-draw bending, stretch bending and press bending[1-2]. Among these methods, the rotary-draw bending (shown in Fig.1) is the most versatile, cost-effective, and precise method for tight bending radii and thin-walled tubes[3] because it can meet the requirement of high precision, high efficiency, and large bending angle etc.

Fig.1 Sketch of rotary-draw bending process
However, the cross-sectional distortion is easily produced in thin-walled rectangular tube bending process if the process parameters are inappropriate. Especially, large power capacity, highly tight structure and highly complex space call for the tube with high inner surface quality, small bending radius and high precision. So, the prediction and the control of the cross-sectional distortion have become an urgent problem.
Over the years, lots of scholars have studied cross-sectional distortion of tube in bending process. MILLER et al[4-6] found that modest levels of pressure can reduce this distortion of extruded aluminum tubes in stretch bending. CORONA[7] presented an efficient formulation to predict the cross-sectional distortion of cross-section. KYRIAKIDES et al[8] studied the effect of yield surface evolution on bending-induced cross-sectional deformation of thin-walled sections. The experiment on the effects of mandrel and axial tensile force on cross-sectional distortion were performed by UTSUMI and SAKAKI[9]. YANG et al[10-12] investigated the forming characteristics and the effects of process parameters on cross section quality of thin-walled circular tube in bending process. LIU et al[13-15] used experiments and an explicit finite element model to study the effects of process parameters on cross-sectional distortion of thin-walled rectangular tube in rotary-draw bending process. However, very few attempts have been made in trying to study the cross-sectional distortion behaviors of rectangular tube during rotary-draw bending process. From this point of view, the present work aims to investigate the cross-sectional distortion behaviors of thin-walled rectangular 3A21 aluminum alloy tube in rotary-draw bending process by using FE numerical simulation method combined with theoretical analysis and experimental study. These efforts are significant for efficiently studying the law of cross-sectional distortion, disclosing the mechanism and the main factors of cross-sectional distortion.
2 FE modeling and its key problems to be resolved
2.1 Material modeling
Accurate material property parameters are very important to obtain the reliable FE numerical simulation results. Thus, the basic mechanical property parameters of thin-walled rectangular aluminum alloy 3A21 tube have been obtained, such as elastic modulus E=60.2 GPa, Poisson ratio υ=0.33, density ρ=2.73 g/mm3, coefficient of extension δ=15% and tensile strength σb=191.4 MPa, through uniaxial tensile test[16]. The material hardening behaviour is expressed using the power exponent hardening model as Eq.(1):

 (1)
(1)
The dies are assumed to be rigid, while the rectangular tube is the deformable body, so the material properties must be assigned to model the material response to contact action or load exerted on it during the forming process. The material properties are defined by the parameters of elastic modulus E, density ρ, and Poisson ratio υ.
2.2 Dynamic loading technologies
Usually, velocity is used as the controlling parameter for the rotary-draw bending process of thin-walled rectangular tube, such as boost velocity of pressure die, angular velocity of bending die and clamp die. In the modelling, the bending process is realized through defining the velocity or angular velocity of dies; sequentially, the bending loads are applied on the tube through the contact surfaces between dies and tube.
2.3 Meshing and FE model
The rectangular tube is discretized using linear, 4-node shell elements with reduced integration (S4R). 4-node 3-D bilinear rigid quadrilateral discrete rigid elements are selected to describe the discrete rigid dies in the process. The 3D-FE model of rotary-draw bending process of rectangular 3A21 aluminum alloy tube is shown in Fig.2.

Fig.2 Illustration of FE model for rotary-draw bending process of thin-walled rectangular tube
2.4 Validation of FE model
In order to validate the reliability of the FE model built in this work, the experiments were done using the PLC controlling hydraulic bender W27YPC-63NC.
The conditions are as follows. The sectional dimension of rectangular tube is 24.86 mm×12.2 mm×1 mm; the bending angle, θ, is 90?; the radius of bending die is 33.9 mm; the sectional dimensions of pressure die, clamp die and insert die are all 25 mm×5 mm; the dimension of mandrel is 154 mm×22.64 mm×9.92 mm; the maximum sectional dimensions of core is 22.64 mm×9.92 mm; and the number of cores is 3. Other parameters are listed in Table 1.
Table 1 Main parameters of bending process

Fig.3 shows the comparison of minimum cross section heights between experiment and simulation. From this figure, the variation trend of minimum cross section heights along the tube from the experiment and simulation are extraordinarily similar, and the value of the maximum error of the minimum cross section heights is less than 5%. So, the reliability of the FE model built in this work is validated. Then, the cross-sectional distortion behaviors of the tube in the bending process are studied by using this 3D-FE model.

Fig.3 Comparison of minimum cross-sectional heights between experimental and simulated results
3 Results and discussion
3.1 Analysis of circumferential stress
Fig.4 shows the distribution of circumferential stress in different bending stages. It can be seen that the distribution of circumferential stress is uniform when the bending angle is less than 30?. Namely, the zone of larger circumferential stress does not appear. After the bending angle reaches 30?, the zone of larger circumferential stress appears, and the symmetrical line of the zone just locates in the vicinity of symmetrical plane of bent tube. The zone increases slightly with the progress of the bending process, but the relative position of it is almost unchanged. And the sagging phenomenon is produced obviously in this zone.

Fig.4 Distribution of circumferential stress in different bending stages: (a) Bending angle 15?; (b) Bending angle 30?; (c) Bending angle 45?; (d) Bending angle 60?; (e) Bending angle 75?; (f) Bending angle 90?
3.2 Distribution of cross-sectional distortion
3.2.1 Cross-sectional sagging distribution along tube width
In order to study the cross-sectional distortion distribution along tube width, a certain cross section is selected. The serial numbers of the edge nodes of the section are shown in Fig.5. The sagging distance ΔBi of the two corresponding nodes (i and i′, i=1, 2, 3, …, 25) is calculated by
ΔBi=B-Bi′ (2)
where B is the initial distance between edge nodes i and i′ of the section, Bi′ is the deformed distance between edge nodes i and i′ of the section.

Fig.5 Nodal serial numbers
The distribution of ΔBi along the width of the tube, as shown in Fig.6, is symmetric about the nodes 13 and 13′. And the maximum sagging distance is obtained between the nodes 13 and 13′. Defining the maximum sagging distance of the two corresponding nodes as the cross-sectional distortion ΔB, the cross-sectional distortion is located at the symmetrical line AA′ (seen in Fig.5) of the cross section.
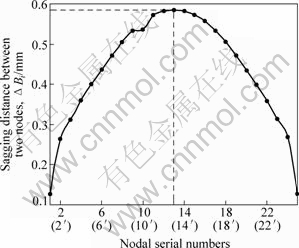
Fig.6 Distribution of sagging distance ΔBi along tube width
3.2.2 Cross-sectional distortion distribution along tube length
In order to investigate the distribution of cross-sectional distortion of the tube, ten sections are selected from the bending reference plane (see Fig.7) in the bent zone of the tube, and the angle between the two adjacent sections is 10?.
The distribution of cross-sectional distortion ΔB along the tube length is given in Fig.8. It can be seen that ΔB is almost unchanged when the angle between bending reference plane and a certain section is smaller than 20?. After the value of the angle reaches 20?, the value of ΔB begins to increase sharply. Moreover, the section of the maximum cross-sectional distortion is obtained in the vicinity with the angle of 50?. Furthermore, the section of the maximum cross-sectional distortion just locates in the zone of larger circumferential stress, as shown in Fig.7.

Fig.7 Distribution of circumferential stress
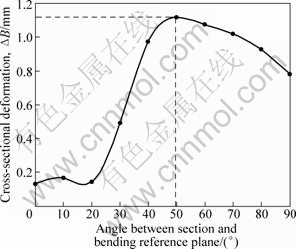
Fig.8 Cross-sectional distortion distribution along tube length
3.3 Effects of clearances on cross-sectional distortion behaviors
3.3.1 Effects of clearance between pressure die and tube
The calculation condition is as follows. Clearances between pressure die and tube, ΔCp, are 0.1, 0.2, 0.3, 0.4 mm, and other parameters are listed in Table 1.
The distributions of cross-sectional distortion along the tube length under different clearances between pressure die and tube are shown in Fig.9. It can be seen that the distribution characteristics of cross-sectional distortion with different clearances are very similar. And the sectional positions of the maximum cross-sectional distortion slightly move backwards along the tube with the increase of the clearance ΔCp. Namely, the angle between the sections of the maximum cross-sectional distortion and bending reference plane is appreciably larger than 50? when the clearance ΔCp increases.
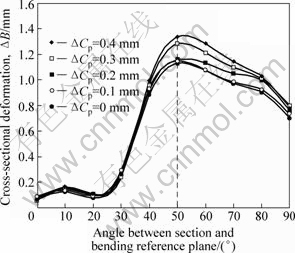
Fig.9 Effects of clearance ΔCp on distribution of cross-sectional distortion
3.3.2 Effects of clearance between mandrel and tube
The calculation condition is as follows. Clearances between mandrel and tube, ΔCm, are 0, 0.1, 0.2, 0.3, 0.4 and 0.5 mm, and other parameters are listed in Table 1.
Fig.10 shows the cross-sectional distortion distributions along the tube with different clearances ΔCm. It can be seen that the fluctuant phenomenon of cross-sectional distortion distribution along tube is obviously produced with the increase of the clearance ΔCm. Fortunately, the sectional positions of the maximum cross-sectional distortion are not changed with the increase of clearance ΔCm. Namely, they still locate at the angle of 50? between bending reference plane and a certain section.

Fig.10 Effects of clearance ΔCm on distribution of cross-sectional distortion
3.3.3 Effects of clearance between wiper die and tube
The calculation condition is as follows. Clearances between wiper die and tube, ΔCw, are 0, 0.1, 0.2, 0.3 and 0.4 mm, and other parameters are listed in Table 1.
The cross-sectional distortion distribution curves along the tube with different clearances ΔCw, as shown in Fig.11, are nearly identical. The sectional positions of the maximum cross-sectional distortion are not changed with the variation of clearance ΔCw, and still locate at the angle of 50? between bending reference plane and a certain section.

Fig.11 Effects of clearance ΔCw on distribution of cross-sectional distortion
3.3.4 Effects of clearance between bend die and tube
The calculation condition is as follows. Clearances between bend die and tube, ΔCb, are 0, 0.1, 0.2, 0.3 and 0.4 mm, and other parameters are listed in Table 1.
The cross-sectional distortion distributions along the tube with different clearances ΔCb are shown in Fig.12. It can be seen that the differences of the cross-sectional distortion distribution trends are larger when the angle between bending reference plane and a certain section is larger than 50?, and the sectional positions of the maximum cross-sectional distortion move backwards along the tube with the increase of the clearance ΔCb. However, the angle that the sectional positions move backwards is smaller than 5?. So, it is considered that the sectional positions of the maximum cross-sectional distortion are not yet changed with the variation of clearance ΔCb.

Fig.12 Effects of clearance ΔCb on distribution of cross-sectional distortion
4 Conclusions
1) The distribution of circumferential stress is uniform in the initial bending stage of rectangular aluminum alloy 3A21 tube in rotary-draw bending process. However, when the bending angle reaches 30?, the zone of larger circumferential stress appears, and the sagging phenomenon is produced obviously in this zone.
2) The distribution of sagging distance along the width of the cross section of the tube is symmetric. And the cross-sectional distortion locates at the symmetrical line along the width of the cross section.
3) The maximum cross-sectional distortion is obtained in the vicinity with the angle of 50? between the bending reference plane and a certain section in the symmetrical plane of the bent tube. And its position is almost unchanged with the variation of clearances between dies and tube.
References
[1] VOLLERTSEN F, SPRENGER A, KRAUS J, ARNET H. Extrusion, channel, and profile bending: A review [J]. Journal of Materials Processing Technology, 1999, 87: 1-27.
[2] COSTELLO F, de WITT D J. Tooling function sin rotary-draw bending: Reviewing the basic equipment [J]. The Fabricator, 1994, 24: 28-31.
[3] STANGE R R. Tooling and methods for tube and pipe bending: The importance of proper equipment and proven techniques [J]. Tube Pipe Journal, 1997, 8(8): 28-35.
[4] MILLER J E, KYRIAKIDES S, BASTARD A H. On bend-stretch forming of aluminum extruded tubes―I: Experiments [J]. International Journal of Mechanical Sciences, 2001, 43: 1283-1317.
[5] MILLER J E, KYRIAKIDES S, CORONA E. On bend-stretch forming of aluminum extruded tubes―Ⅱ: Analysis [J]. International Journal of Mechanical Sciences, 2001, 43: 1319-1338.
[6] MILLER J E, KYRIAKIDES S. Three dimensional effects of the bend stretch forming of aluminum tubes [J]. International Journal of Mechanical Science, 2003, 45: 115-140.
[7] CORONA E. A simple analysis for bend stretch forming of aluminum extrusions [J]. International Journal of Mechanical Sciences, 2004, 46: 433-448.
[8] KYRIAKIDES S, CORONA E, MILLER J E. Effect of yield surface evolution on bending induced cross sectional deformation of thin-walled sections [J]. International Journal of Plasticity, 2004, 20: 607-618.
[9] UTSUMI N, SAKAKI S. Countermeasures against undesirable phenomena in the draw-bending process for extruded square tube [J]. Journal of Materials Processing Technology, 2002, 123: 264-269.
[10] GU Rui-jie, YANG He, ZHAN Mei, LI Heng, WANG Guang-xiang. Effect of mandrel on cross section quality of thin-walled tube numerical controlled bending [J]. Trans Nonferrous Met Soc China, 2005, 15(6): 1264-1274.
[11] YANG He, GU Rui-jie, ZHAN Mei, LI Heng. Effect of frictions on cross section quality of thin-walled tube NC bending [J]. Trans Nonferrous Met Soc China, 2006, 16(4): 878-886.
[12] LI Heng, YANG He, ZHAN Mei, GU Rui-jie. Forming characteristics of thin-walled tube bending process with small bending radius [J]. Trans Nonferrous Met Soc China, 2006, 16: s613-s623.
[13] LIU Yu-li, YANG He, CUI Shan-shan, ZHAO Gang-yao. 3-D FEM analysis of section distortion in bending process of the thin-walled rectangular tube [J]. Journal of Plasticity Engineering, 2007, 14(3): 72-75. (in Chinese).
[14] LIU Yu-li, LU Cai-hong, ZHAO Gang-yao, YANG He. Effect of clearance on cross section distortion of thin-walled rectangular tube in rotary-draw bending process [J]. China Mechanical Engineering, 2008, 19(16): 1972-1975. (in Chinese).
[15] ZHAO Gang-yao, LIU Yu-li, LU Cai-hong, YANG He. Influence of friction on cross-sectional distortion in rotary-draw bending process of thin-walled rectangular tube [C]//Advanced Technology of Plasticity 2008. Gyeongju, Korea: KSTP (Korean Society for Technology of Plasticity), 2008: 1034-1040.
[16] ZHAO Gang-yao. Numerical simulation of wrinkling for rotary draw bending process of thin-walled rectangular tube[D]. Xi’an: Northwestern Polytechnical University, 2007. (in Chinese).
Foundation item: Projects(50575184, 50975235) supported by the National Natural Science Foundation of China; Project(YF07057) supported by Science and Technology Development Program of Xi’an City, Shaanxi Province, China; Project(NPU-FFR-200809) supported by Foundation for Fundamental Research of Northwestern Polytechnical University, China; Project(08-3) supported by State Key Laboratory of Materials Processing and Die & Mould Technology, Huazhong University of Science and Technology, China
Corresponding author: LIU Yu-li; Tel: +86-29-88460212-803; Fax: +86-29-88495632; E-mail: lyl@nwpu.edu.cn
DOI: 10.1016/S1003-6326(09)60166-7
(Edited by YANG Bing)

