Fixed-bed column study for deep removal of copper (II) from simulated cobalt electrolyte using polystyrene-supported 2-aminomethylpyridine chelating resin
来源期刊:中南大学学报(英文版)2019年第5期
论文作者:胡慧萍 王玉华 邱雪景
文章页码:1374 - 1384
Key words:deep removal of copper (II); chelating resin; simulated cobalt electrolyte; fixed-bed column; model fitting
Abstract: This study presents the deep removal of copper (II) from the simulated cobalt electrolyte using fabricated polystyrene-supported 2-aminomethylpyridine chelating resin (PS-AMP) in a fixed-bed. The effects of bed height (7.0–14.0 cm), feed flow rate (4.5–9.0 mL/min), initial copper (II) concentration of the feed (250–1000 mg/L), feed temperature (25–40 °C) and the value of pH (2.0–4.0) on the adsorption process of the PS-AMP resin were investigated. The experimental data showed that the PS-AMP resin can deeply eliminate copper (II) from the simulated cobalt electrolyte. The bed height, feed flow rate, initial copper (II) concentration of the feed, feed temperature and feed pH value which corresponded to the highest removal of copper (II) were 7.0 cm with 35 mm of the column diameter,4.5 mL/min, 40 °C, 1000 mg/L and 4.0, respectively. The breakthrough capacity, the saturated capacity of the column and the mass ratio of Cu/Co (g/g) in the saturated resin were correspondingly 16.51 mg/g dry resin, 61.72 mg/g dry resin and 37.67 under the optimal experimental conditions. The copper (II) breakthrough curves were fitted by the empirical models of Thomas, Yoon-Nelson and Adam-Bohart, respectively. The Thomas model was found to be the most suitable one for predicting how the concentration of copper (II) in the effluent changes with the adsorption time.
Cite this article as: WANG Yu-hua, HU Hui-ping, QIU Xue-jing. Fixed-bed column study for deep removal of copper (II) from simulated cobalt electrolyte using polystyrene-supported 2-aminomethylpyridine chelating resin [J]. Journal of Central South University, 2019, 26(5): 1374–1384. DOI: https://doi.org/10.1007/s11771-019-4093-8.

J. Cent. South Univ. (2019) 26: 1374-1384
DOI: https://doi.org/10.1007/s11771-019-4093-8

WANG Yu-hua(王玉华)1, 2, HU Hui-ping(胡慧萍)1, QIU Xue-jing(邱雪景)1, 2
1. College of Chemistry and Chemical Engineering, Central South University, Changsha 410083, China;
2. Hunan Provincial Key Laboratory of Chemical Power Sources, Central South University,Changsha 410083, China
 Central South University Press and Springer-Verlag GmbH Germany, part of Springer Nature 2019
Abstract: This study presents the deep removal of copper (II) from the simulated cobalt electrolyte using fabricated polystyrene-supported 2-aminomethylpyridine chelating resin (PS-AMP) in a fixed-bed. The effects of bed height (7.0–14.0 cm), feed flow rate (4.5–9.0 mL/min), initial copper (II) concentration of the feed (250–1000 mg/L), feed temperature (25–40 °C) and the value of pH (2.0–4.0) on the adsorption process of the PS-AMP resin were investigated. The experimental data showed that the PS-AMP resin can deeply eliminate copper (II) from the simulated cobalt electrolyte. The bed height, feed flow rate, initial copper (II) concentration of the feed, feed temperature and feed pH value which corresponded to the highest removal of copper (II) were 7.0 cm with 35 mm of the column diameter,4.5 mL/min, 40°C, 1000 mg/L and 4.0, respectively. The breakthrough capacity, the saturated capacity of the column and the mass ratio of Cu/Co (g/g) in the saturated resin were correspondingly 16.51 mg/g dry resin, 61.72 mg/g dry resin and 37.67 under the optimal experimental conditions. The copper (II) breakthrough curves were fitted by the empirical models of Thomas, Yoon-Nelson and Adam-Bohart, respectively. The Thomas model was found to be the most suitable one for predicting how the concentration of copper (II) in the effluent changes with the adsorption time.
Key words: deep removal of copper (II); chelating resin; simulated cobalt electrolyte; fixed-bed column; model fitting
Cite this article as: WANG Yu-hua, HU Hui-ping, QIU Xue-jing. Fixed-bed column study for deep removal of copper (II) from simulated cobalt electrolyte using polystyrene-supported 2-aminomethylpyridine chelating resin [J]. Journal of Central South University, 2019, 26(5): 1374–1384. DOI: https://doi.org/10.1007/s11771-019-4093-8.
1 Introduction
There are several impurity ions in the cobalt electrolyte, among which copper is one of the main impurities. Since the standard potential of copper (0.337 V) is higher than that of cobalt (–0.28 V), copper can easily deposit on the cathode during the electrolytic refining of cobalt. As a result, the quality of the cobalt product can be greatly affected [1, 2]. So it is an important procedure to remove copper from highly concentrated cobalt solutions to ensure high purity cobalt product.
Several traditional techniques for the removal of copper (II) involve chemical precipitation [3, 4], solvent extraction [5] and ion exchange technique [6, 7]. Among these methods, a major drawback with chemical precipitation is sediment production [8]. As an effective method for the separation of similar elements, solvent extraction is popular and widely used. However, solvent extraction could show one or more disadvantages, such as emulsification, interfacial flocculation and the generation of secondary pollution, which have an unavoidable effect on the extraction [9]. Although ion exchange was usually employed for the copper removal, it is not economical as the poor selectivity [10]. In view of many disadvantages of the traditional methods, it is imperative that studies carried out to look for a convenient method with high selectivity for removing copper (II) from the cobalt electrolyte. In recent years, chelating resin adsorption has attracted a lot of attention of researchers. Compared with the above traditional methods, the chelating resin has the advantages of high selectivity, no waste residue and the like [11–13].
Chelating resins with 2-aminomethylpyridine functional groups have a high selectivity towards copper (II) over cobalt (II). Some related literatures reported the removal of copper (II) from the cobalt electrolyte using these chelating resins [14, 15]. For example, because the limited active sites on the silica gel surface, WEN et al [14] and BAI et al [15] correspondingly synthesized silica-supported 2-aminomethylpyridine chelating resin with much lower maximum adsorption capacity of copper (II) in batch experiments (35.56 and 49.53 mg/g dry resin, respectively). Generally, the adsorption capacity of the chelating resin is related to the density of functional groups on the surface of the adsorbent. The greater number of functional groups loaded could result in higher adsorption capacity of copper (II) on the resin. To this end, the polystyrene-supported 2-aminomethylpyridine chelating resin (PS-AMP) with higher maximum adsorption capacity of copper (II) in batch experiments (97.16 mg/g dry resin) was synthesized using one-step method by our research group [16]. However, the effective use of the PS-AMP resin requires the measurement of the optimal experimental operation under conditions that can simulate an ion exchange process by using laboratory-scale columns.
In this paper, based on the characteristics of the PS-AMP resin, the optimal feed flow rate, bed height, initial copper (II) concentration of the feed, feed temperature and pH required to effectively remove copper (II) from the simulated cobalt electrolyte were investigated using the fabricated PS-AMP chelating resin in fixed-bed columns. Some of the well-established empirical models such as the Thomas, the Yoon-Nelson and Adam-Bohart were fitted into the experimental data from the copper (II) removal tests so as to predict the dynamic adsorption process of the copper (II) removal by the PS-AMP resin.
2 Experimental
2.1 Reagents
The simulated cobalt electrolyte containing 1.0×10⁵ mg/L cobalt (II) and 250–1000 mg/L copper (II) was prepared by dissolving CuCl2·2H2O (Sinopharm Group Chemical Reagent Co., Ltd., China) and CoCl2·6H2O(Sinopharm Group Chemical Reagent Co., Ltd., China) in deionized water. Due to the large amount of Cl– present in the cobalt electrolyte, the concentrations of Cl– in the feed were kept at about 7.5×10⁴ mg/L and adjusted with NaCl (Sinopharm Group Chemical Reagent Co., Ltd., China). Dilute sodium hydroxide or hydrochloric acid solution was used to adjust the feed pH to the desired values. All chemicals used in this study were of analytical grade and were used without further purification.
2.2 Column study
The dynamic adsorption processes were carried out in a 35 mm diameter and 300 mm height jacketed glass column to assess the effects of the bed height, feed flow rate, initial copper(II) concentration of the feed, feed temperature and feed pH. Before the dynamic adsorption experiment, the fabricated PS-AMP resins were fully immersed in deionized water for 24 h. The treated resins were wet packed into the glass column. A piece of cotton at the top of the column was applied to fix the filling resin. A metering pump (BT4a0708, ProMinet Fluid Control GmbH, Germany) was used in the same continuous manner to inject the feed into the column at a certain feed flow rate through the inlet at the top of the column and then the effluent discharged from the outfall at the bottom of the column. The column effluent was periodically collected and determined for copper (II) concentration using an atomic absorption spectrophotometer (TAS-990F, Beijing Purkinje General Instrument Co., China).
The symbols used in this paper were as follows: C0 (mg/L) is the initial concentration of copper (II); Ct (mg/L) is the copper (II) concentration of the effluent at the adsorption time (t, min);  Cu/Co (g/g) is the mass ratio of Cu/Co in the saturated resin; F (mL/min) is the feed flow rate; T (°C) is feed temperature and Z (cm) is the fixed-bed height.
2.3 Column data analysis
Adsorption capacity was considered as one of the important performance index in fixed-bed column experiments. Generally, the column processes were evaluated through the breakthrough curves of the fixed-bed columns [17]. Breakthrough curve was expressed in term of Ct/C0 as a function of adsorption time for a given condition. The adsorption capacity of adsorbent under some experimental conditions could be counted from the breakthrough curve. The total mass of copper (II) adsorbed on the PS-AMP resin, qt (mg), could be calculated by the following Eq. (1) [18, 19]:
 (1)
(1)
where A is the area above the breakthrough curve, t (min) is the adsorption time.
In this adsorption column experiment, the saturated capacity and the breakthrough capacity of the column are calculated by Eq. (2) [19] when the saturation point and the breakthrough point are correspondingly set at Ct/C0=0.90 and Ct/C0=0.10.
 (2)
(2)
where Q (mg/g dry resin) is the saturated capacity, m (g) is the dry mass of the resin.
The upper saturated resin in the fixed-bed column was collected after Ct/C0 equals 0.90. After washing with abundant ultrapure water, the saturated resin was desorbed with 2 mol/L sulfuric acid and the contents of Cu and Co in the desorption solutions were also analyzed by AAS. By calculation, the mass ratio of Cu/Co (g/g) in the saturated resin was obtained.
3 Results and discussion
3.1 Effect of bed height
The retention of metals in a column depends, in addition to the feed flow rate, on the bed height [19]. The dynamic adsorption processes were performed at three different bed heights of 7.0, 10.5 and 14.0 cm, at a constant flow rate of 4.5 mL/min, with 1000 mg/L of initial concentration of copper (II) in the feed, feed pH value of 4.0 and feed temperature of 25°C. In order to produce different bed heights, 25, 37.5 and 50 g of the dry PS-AMP resins were added to produce 7.0, 10.5 and 14 cm, respectively. The breakthrough curves of copper (II) at different bed heights are shown in Figure 1.
Table 1 Physical and chemical properties of PS-AMP resin
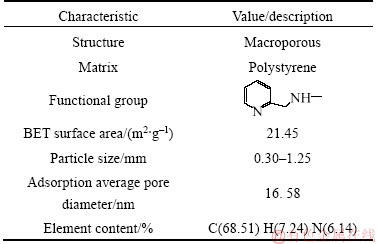
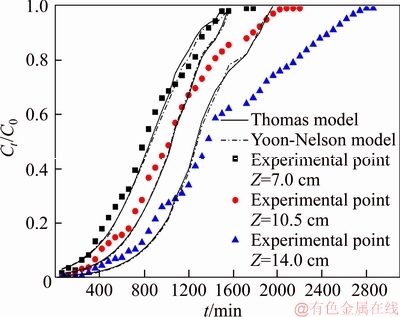
Figure 1 Experimental and predicted breakthrough curves of copper (II) adsorption onto PS-AMP chelating resin at different bed heights
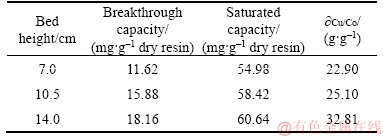
It could be observed from Figure 1 that the breakthrough curves became sharper with decreasing the bed height. The molar ratio of copper (II) in the effluent to the feed was 0.96 when the bed height was 7.0 cm after treating about 6500 mL of the feed as compared to 0.80, and 0.60 of the molar ratio of copper (II) in the effluent to the feed reached in the bed height of 10.5 cm, and 14.0 cm, respectively. Table 2 shows the breakthrough characteristics and the mass ratio of Cu/Co in the saturated resin with respect to the increase in bed height. It may be due to that the more binding sites were available and the copper (II) had more time to contact with the PS-AMP resin as the bed height increased. What’s more, axial dispersion mechanism dominates in the mass transfer when the bed height is reduced, as a result, the adsorption in dynamic study would be inevitable affected [20]. However, considering the resin dosage and feed consumption for a single test, the optimal bed height for copper (II) adsorbed onto the PS-AMP resin was chosen as 7.0 cm in the next column experiments.
Table 2 Column parameters at different bed heights
3.2 Effect of feed flow rate
The feed flow rate is one of the important parameters that could affect the adsorption capacity of the chelating resin in fixed-bed experiments, especially for continuous process at an industrial scale [21]. In order to probe the influence of the flow rate on the copper (II) removal efficiency for the simulated cobalt electrolyte through the bed height, the initial concentration of the feed, the feed temperature and the feed pH value were kept constant (Z was 7.0 cm, the initial concentration of cobalt (II) and copper (II) in the feed were correspondingly 1.0×10⁵ mg/L and 1000 mg/L, T was 25 °C, pH value was 4.0), and the flow rate changed from 4.5 to 9.0 mL/min. The breakthrough curves are shown in Figure 2, the detailed experimental parameters are listed in Table 3.
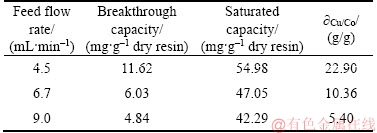
Figure 2 shows that the breakthrough curves were steeper at faster flow rate, the breakthrough point and the adsorption process reached saturation faster with the increased of the feed flow rate. The molar ratio of copper (II) in the effluent to copper (II) in the feed was 0.96 when the feed flow rate was 9.0 mL/min after treating about 6000 mL of the feed as compared to 0.85 and 0.80 reached in the respective 6.7 mL/min and 4.5 mL/min. It can be clearly seen that better column properties were obtained at lower flow rates, which means that the smaller feed flow rate led to the higher utilization rate of the PS-AMP resin. As can be seen from Table 3, the breakthrough capacities and the saturated capacities of copper (II) of the column, and the mass ratios of Cu/Co in the saturated resin decreased when the feed flow rate was increased from 4.5 mL/min to 9.0 mL/min. The decrease in the copper (II) removal at higher feed flow rates may be due to the reduced contact time between the feed solution and the PS-AMP resin [22]. Overall, the highest removal of copper (II) occurred at the flow rate of 4.5 mL/min in this work. The optimal feed flow rate for copper (II) adsorbed onto the PS-AMP resin was chosen as 4.5 mL/min in the next column experiments.
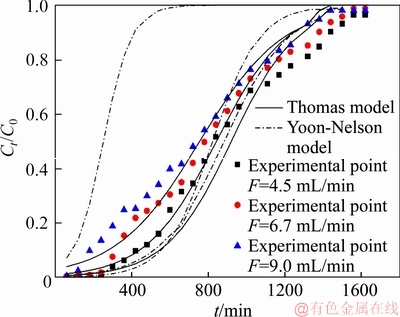
Figure 2 Experimental and predicted breakthrough curves of copper (II) adsorption onto PS-AMP chelating resin at different flow rates
Table 3 Column parameters at different flow rates
3.3 Effect of initial concentration
The copper (II) concentration in the cobalt electrolyte is generally 200–1000 mg/L [14]. Therefore, the copper (II) concentrations of the feed used in this experiment were 250, 500 and 1000 mg/L. The feed flow rate, the bed height, the feed pH and the feed temperature value were kept at 4.5 mL/min, 7.0 cm, 4.0 and 25 °C, respectively. The effect of the PS-AMP resin on the copper removal performance was investigated under different initial concentrations of the feed (the results are shown in Figure 3 and listed in Table 4).
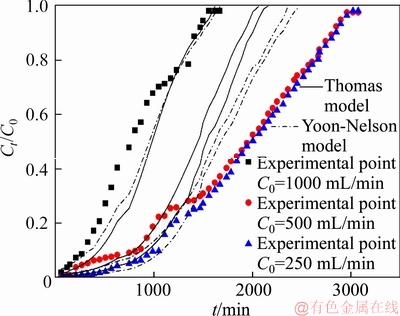
Figure 3 Experimental and predicted breakthrough curves of copper (II) adsorption onto PS-AMP chelating resin at different initial concentrations
Table 4 Column parameters at different initial concentrations
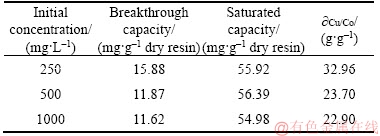
As shown in Figure 3, the breakthrough curves at higher initial concentrations were steeper than that at lower initial concentration. After treating about 6500 mL of the feed, the values of Ct/C0 reached 0.92, 0.29 and 0.24 for 1000, 500 and 250 mg/L of the initial concentrations of the feed, respectively. It was clearly observed from Table 4 that the there are almost no change of the breakthrough capacity and the saturated capacity of the column when the initial concentrations of the feed ranged from 250 to 1000 mg/L.
3.4 Effect of feed temperature
The effect of feed temperature on the performance of the breakthrough curves at constant bed height of 7.0 cm, flow rate of 4.5 mL/min, feed pH value of 4.0 and initial copper(II) concentration of the feed of 1000 mg/L were studied. Figure 4 shows the breakthrough curves at different feed temperatures.
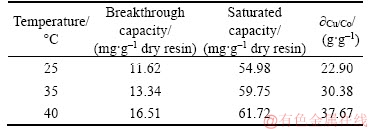
It can be seen from Table 5 that the breakthrough capacity and saturated capacity increased as feed temperature increased from 25 to 40 °C. What’s more, the feed volume treated was the least when the resin reached saturation adsorption at 25 °C. On the other word, the adsorption properties of the PS-AMP resin increase as the temperature increases. It could be easily seen from Figure 4 that the breakthrough curves became sharper and the breakthrough points became shorter with the decrease of the feed temperature. It may be due to the adsorption of copper (II) on the resin is an endothermic process [16]. What’s more, the viscosity of the feed liquid will be reduced and the diffusion of copper (II) will be accelerated when the temperature increases [11]. Therefore, in this study, the adsorption of copper (II) was favored at higher feed temperature. However, if the feed temperature is too high, it is not only conducive to the service life of the resin, but also puts forward higher requirements for the ion-exchange equipment.
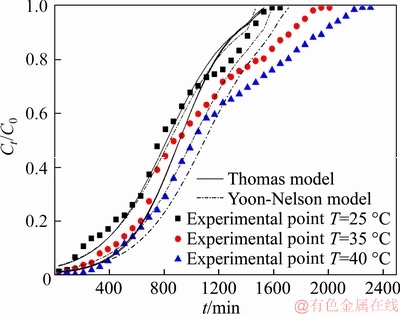
Figure 4 Experimental and predicted breakthrough curves of copper (II) adsorption onto PS-AMP chelating resin at different feed temperatures
Table 5 Column parameters at different feed temperatures
3.5 Effect of feed pH
Since feed pH will decide the surface charge of the PS-AMP resin, the ionization degree and speciation of the copper (II), the feed pH is considered as one of the important single factors that affect the adsorption performance [21].Figure 5 shows the breakthrough curves obtained for copper (II) adsorption on the PS-AMP resin for varies feed pH of 2.0, 3.0 and 4.0, at a constant bed height of 7.0 cm, feed flow rate of 4.5 mL/min, feed temperature of 25 °C and the copper (II) initial concentration of 1000 mg/L.
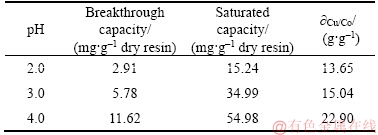
As can be seen in Figure 5, the effect of feed pH on copper (II) adsorption is significant. The larger the feed pH value is, the steeper the slope of breakthrough curve is. It also can be observed from Table 6 that the breakthrough capacity of the column was 2.19, 5.78 and 11.62 mg/g dry resin, and the resin capacity when saturated of the column was 13.65, 15.04 and 22.90 mg/g dry resin at the feed pH values of 2.0, 3.0 and 4.0, respectively. The capacity of the resin varies greatly at different feed pH.When the feed was under the strong acidic condition, H+ of the feed may strongly compete with copper (II) for the adsorption sites on the surface of the PS-AMP resin, which may result in a decrease of the adsorption capacity for the PS-AMP resin.
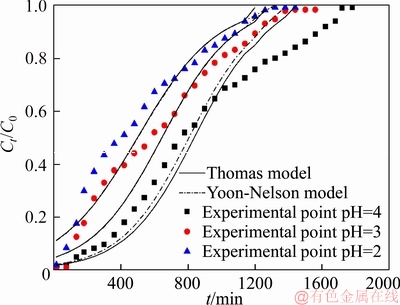
Figure 5 Experimental and predicted breakthrough curves of copper (II) adsorption onto PS-AMP chelating resin at different feed pH values
Table 6 Column parameters at different feed pH values
According to the experimental results, the optimal feed pH for copper (II) adsorption on the PS-AMP resin can be chosen as 4.0 in the next column experiments.
4 Model fitting and error analysis
The successful design of the column experiment must satisfy the requirements for predicting the effluent breakthrough curve or the profile of the concentration against time [20, 22, 23]. However, the concentration distribution of the feed and adsorbed phases varies both in time and in space in the column processes, thus it is difficult to carry out the design and optimization of the fixed-bed column without quantitative modeling [20]. The suitable model is essential for the technological transformation of the lab scale and the industrial scale. The model can be used not only to explain and analyze the experimental data, but also to predict the column behavior [24].The commonly used models for fixed-bed columns are the Adam-Bohart, Thomas and the Yoon-Nelson models, thus, these models were fitted into the experimental data in this study so as to determine the dynamic behavior of the effluent concentration from the column.
An error function analysis is required in order to evaluate the goodness of the fit of the model to the experimental results [25–27].
4.1 Error analysis
The calculated expressions of some functions are as following:
1) The sum of the squares of the errors (SSE) [30]
 (3)
(3)
2) Chi-square test [31]
 (4)
(4)
where n is the number of experimental data points, qe and q0arecorrespondingly the experimental data and the predicted (calculated) data with the models.
4.2 Thomas model
The Thomas model assumes that the adsorption behavior abides by Langmuir kinetics with no axial dispersion and mass transfer kinetics, and the rate driving force obeys the 2nd order reversible reaction kinetics [28]. The expression of the Thomas model is as Eq.(5) [25]:
 (5)
(5)
where KTH (mL/(min·mg) is the rate constant, q0 (mg/g) is the calculated equilibrium uptake of copper (II), V (mL) is the volume of the effluent.
The linearized Thomas model is expressed as follows:
 (6)
(6)
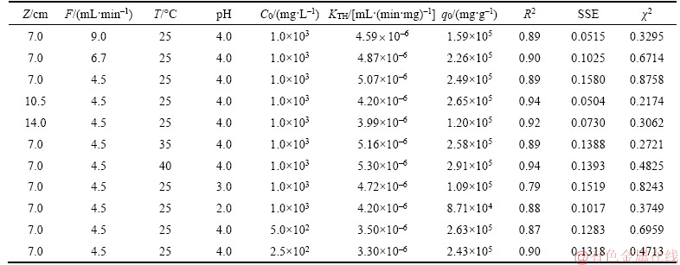
The values of C0, Ct and t were obtained experimentally. The values of the rate constant (KTH) were evaluated from the slope and intercept of the linear plots of ln[(C0/Ct)–1] versus t, respectively. The model parameters are listed in Table 6. The predicted curves at various experiment conditions according to the Thomas model are shown in Figures 1–5, respectively.
As shown in the Table 7, the correlation coefficient (R2) changes from 0.79 to 0.95, the R2 values closer to 1 show that there is strong linear relationship between the data plotted. The values of SSE and χ2 are relatively small at all experimental conditions, indicating that the error between the predicted data and the experimental data is small.
The Thomas rate constant (KTH) and q0 increased with a decrease in flow rate from 4.5 to 9.0 mL/min, possibly due to reduced retention time, and premature saturation of the active site. The result is consistent with similar studies conducted by YAHAYA [19] et al. Conversely, the studies conducted by other studies [20, 22, 23] shows that the value of KTH increased with an increase in flow rate. Amongst the bed height studied, as the bed height increased from 7.0 to 14.0 cm, the value of KTH decreased while the value of q0 showed an opposite tendency, that is, increased with increase in bed height. The results, which were found by other scholars, have almost the same trend [21, 29].
Table 7 shows that the value of KTH and q0 increased with an increase in feed temperature. The reason may be that the process of adsorption of copper (II) by the PS-AMP resin was an endothermic process [14]. Therefore, the increase of temperature is favorable for the adsorption of copper (II). An increase in KTH and q0 with an increase in feed pH value. The effect of feed pH may due to the resin functional group (secondary amine) will combine with the H+ in the solution, which affects the resin adsorption of copper (II) when the feed pH is low [16]. As shown in Table 7 that as the initial concentration increased, the value of q0 and KTH increased. The higher difference between the concentration of copper (II) on the resin and the concentration of copper (II) in the solution will form the higher driving force for the adsorption process, then higher concentrations result in higher q0 [18]. However, the predicted maximum adsorption capacities (q0) were unrealistic as they were more than 1600 times the theoretical adsorption capacity. The Thomas model was inappropriate in this study. It may be because the rate limiting step of adsorption in this study is either external and/or internal diffusion [32].
4.3 Yoon-Nelson model
The Yoon-Nelson model is simpler than the other models, and does not require data that takes into account system characteristics [25].
The linear equation is expressed as Eq.(7):
 (7)
(7)
where KYN (1 / min) is the rate constant, t (min) is time, τ (min) is the breakthrough time at 50%.
Table 7 Parameters and error values of copper (II) adsorption of Thomas model under various experimental conditions
The Yoon-Nelson constants (KYN) and τ were derived from the slope of ln[Ct/(C0–Ct)] versus time t and the intercept on the y-axis, respectively. The correlation coefficients (R2) were at least 0.87 or more except for initial concentration of 500 mg/L and pH of 3 which were 0.78 and 0.79, respectively. Figures 1–5, respectively, show the comparison of the experimental and predicted curves at various experimental conditions.
Table 8 listed the model parameters of Thomas model and values of R2, SSE and χ2. Obviously, KYN and τ correspondingly increased and decreased with the increase in flow rate, because the higher flow rate may reduce the retention time of the feed liquid in the column, which is in agreement with the results from other researchers [20, 25]. The value of KYN decreased with an increase in bed height as listed in the Table 8. This result is in agreement with those by other researchers [20, 25, 28]. With the feed temperature increased, the τ increased but the value of KYN decreased. The value of KYN and τ increased and decreased, respectively, as the initial concentration increased. This is in agreement with the trend found in others [25, 28].KYN was found to decrease with decrease in feed pH whereas, the values of τ increased with decreasing the feed pH. As shown in the Table 8, when the feed flow rate was 9.0 mL/min, the values of SSE and χ2 are larger than those of under other experimental conditions, which is consistent with the prediction curves of the model in Figures 1–5.
Observing the error values of SSE and χ2 listed in Tables 7 and 8, it can be seen that the error values of the Thomas model were greater than the Yoon-Nelson model only at the feed speeds of 9.0 mL/min and 4.5 mL/min. That is, the Thomas model is more suitable than the Yoon-Nelson model for predicting the adsorption behavior of copper (II) in fixed-bed column. However, by comparing the experimental breakthrough curves and the predicted breakthrough curves shows that the Yoon-Nelson model is suitable for this process too. This result is also supported by R2 values close to 1. In other word, Yoon-Nelson model also can be used to predict the behavior of the adsorption of copper (II) in a fixed-bed column.
4.4 Adam-Bohart model
The Adam-Bohart model is based on surface reaction theory assumes that the balance is not instantaneous, and the adsorption rate is proportional to the concentration of removed material and the residual capacity of the adsorbent [20, 25], which can be used to depict the primary part of the breakthrough curve. The mathematical expression for this model can be expressed as follows [28]:
 (8)
(8)
where KAB (L/(mg·min)) is the kinetic constant N0 (mg/L) is the saturation concentration.
KAB and N0 are listed in Table 9. The correlation coefficients (R2) between the plots of ln(Ct/C0) against t ranged between 0.676 and 0.874 as listed in Table 9.
Table 8 Parameters and error values of copper (II) adsorption of Yoon-Nelson model under various experimental conditions
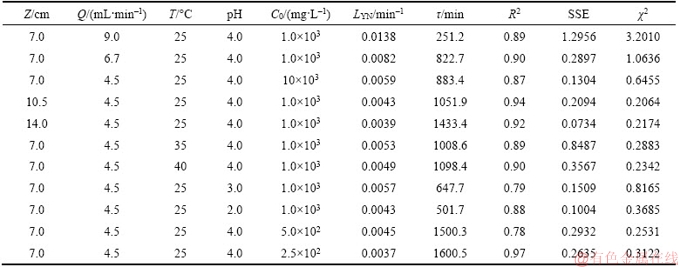
Table 9 Parameters and error values of copper (II) adsorption of Adam-Bohart model under various experimental conditions
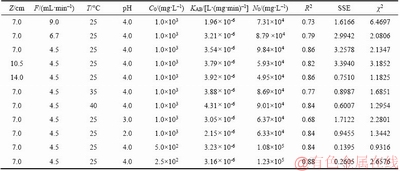
As shown in Table 9, KAB increased with increasing bed height, while N0 showed a reverse trend. Increasing the bed height when keep a constant flow rate can increase the mass transfer zone so that the residence time of the feed solution increases which enhances copper (II) uptake from feed [33]. However, other scholars found that the value of KAB decreased with an increase in bed height [20, 25, 28]. It can be seen from Table 9 that KAB increased as the initial concentration increased but decreased with increased in flow rate. While the values of N0 increased as the flow rate increased but decreased with the concentration increased. KAB and N0 decreased and increased, respectively, as the feed temperature increased. With the increased of feed pH, the value of N0 increased while KAB decreased.
The saturation concentration (N0) was more than 100 times that of feed. More worse, compared with the Thomas model and the Yoon-Nelson model, the correlation coefficients (R2) of Adams-Bohart model is lower. In addition, the error values of the SSE and Chi-square test of each model listed in Tables 7–9 show that the error values of the Adams-Bohart model are larger than those of the other two models as mentioned above. These results indicate that the Adams-Bohart model provides poor character of fixed-bed column. All in all, the Adams-Bohart model offers a simpler and more comprehensive method to assess the column adsorption process, but the range of conditions used will limit its validity [19].
5 Conclusions
Breakthrough experiments were performed using glass ion exchange column packed with the PS-AMP resin at a laboratory scale. On the basis of the experimental results, the following conclusions can be drawn:
1) The optimal adsorption condition for the deep removal of copper (II) from the simulated cobalt electrolyte are obtained as follows: the flow rate, bed height, initial copper (II) concentration, feed temperature and pH which corresponded to the highest metal uptake were 4.5 mL/min, 7.0 cm,40 °C, 1000 mg/L and 4.0, respectively. Under the optimal adsorption condition, the breakthrough capacity, the saturated capacity of the column and the mass ratio of copper to cobalt in the saturated resin were 16.51 mg/g dry resin, 61.72 mg/g dry resin and 37.67, respectively.
2) The breakthrough curves were analyzed by using the Thomas, Yoon-Nelson and Adams-Bohart models. Comparing the values of the correlation coefficients (R2), SSE and χ2 under various experimental conditions, it was found that both the Thomas model and the Yoon-Nelson model can be used to predict the copper removal process. But the Thomas model was found to be the most suitable model for predicting how effluent concentration during copper (II) removal varies with time.
References
[1] MENG Xian-xuan. Jinchuan cobalt smelting production technology progress [J]. Nonferrous Metals, 1997(4): 1–6. (in Chinese)
[2] HE Huan-hua, CAI Qiao-fang.China nickel and cobalt metallurgy [M]. Beijing: Metallurgical Industry Press, 2000. (in Chinese)
[3] LI Xin-ying, Francis Ruzagiliza Innocent, CHEN Quan-yuan, XUE Gang. Treatment of copper-containning wastewater by precipitation and characterization of precipitate [J]. Science of Environmental Protection, 2014, 40(2): 35–38. DOI: 10.1016/B978-0-444-53599-3.10005-8. (in Chinese)
[4] SADEGHALVAD B, AZADMEHR A R, MOTEVALIAN H. Statistical design and kinetic and thermodynamic studies of Ni (II) adsorption on bentonite [J]. Journal of Central South University, 2017, 24(7): 1529–1536. DOI: 10.1007/s11771- 017-3557-y.
[5] ZHUO Wen, YE Xian-ying. Solvent extraction process for separating copper in nickel, cobalt and copper system, CN102234722A [P]. 2011-11-09. (in Chinese)
[6] JURRIUS Y, SOLE K C, HARDWICK E. Removal of copper and zinc from a cobalt electrolyte by ion exchange at Kamoto Copper Company’s Luilu plant [J]. Hydrometallurgy, 2014(2): 281–293. http://www.soleconsulting.co.za/ publications/cobaltnickel/Co3.pdf.
[7] SHEN C, CHANG Y, FANG L, MIN M, XIONG C H. Selective removal of copper with polystyrene–1, 3-diaminourea chelating resin: Synthesis and adsorption studies [J]. New Journal of Chemistry, 2016, 40: 3588–3596. DOI: 10.1039/C5NJ02703A.
[8] LI Jiang-tao, CHEN Ai-liang. Deep removal of copper from nickel electrolyte using manganese sulfide[J]. Transactions of Nonferrous Metals Society of China, 2015, 25(11): 3802–3807. DOI: 10.1016/S1003-6326(15)64024-9.
[9] SUDHA P N, CELINE S. Removal of heavy metal cadmium fromindustrial wastewater using chitosan coated coconut charcoal [J]. Nature Environment and Pollution Technology, 2008, 7(4): 601–604.
[10] WANG Cheng-yan. Extraction and separation of copper, nickel and cobalt in ammonia solution [J]. Nonferrous Metals Engineering, 2002, 54(1): 23–26. DOI: 10.3969/j.issn. 2095-1744.2002.01.007. (in Chinese)
[11] SINGH A, GEHLOT C L, SINGH D K. Synthesis, characterization, and applications of a new chelating resin containing 4-2-(Thiazolylazo) resorcinol (TAR) [J]. Separation Science & Technology, 2012, 47(16): 2399–2407. DOI: 10.1080/01496395.2012.672513.
[12] LI Yu-biao, WANG Xin-yu, XIAO Qing, ZHANG Xu. Study on selective removal of impurity iron from leached copper-bearing solution using a chelating resin [J]. Minerals, 2016, 6(4): 106–117. DOI: 10.3390/min6040106.
[13] SHEN C, CHANG Y, FANG L, MIN M, XIONG C H. Selective removal of copper with polystyrene–1, 3-diaminourea chelating resin: Synthesis and adsorption studies [J]. New Journal of Chemistry, 2016, 40: 3588–3596. DOI: 10.1039/C5NJ02703A.
[14] WEN Jun-jie. The fundamental research on removing copper from cobalt electrolyte and nickel electrolyte by ion-exchange with novel silica-polyamine organic-inorganic composite resin [D]. Changsha: Central South University, 2010. (in Chinese)
[15] LAN Bai. Amine/acid catalyzed synthesis of a new silica-aminomethyl pyridine material as a selective adsorbent of copper [J]. Journal of Materials Chemistry, 2012, 22: 17293–17301. DOI: 10.1039/C2JM33831A.
[16] QIU Xue-jing, HU Hui-ping, YANG Jin-peng, WANG Cai-xia, CHENG Ze-ying, JI Guang-fu. Selective removal of copper from simulated nickel electrolyte by polystyrene- supported2-aminomethylpyridine chelating resin [J]. Chemical Papers, 2018: 1–15. DOI: 10.1007/s11696- 018-0436-4.
[17] DAVILA-GUZMAN N E, CERINOC RDOVA F J, SOTO- REGALADO E, LOREDO-CANCINO M, LOREDO- MEDRANO J A, GARC
 A-REYES R B. A mass transfer model for the fixed-bed adsorption of ferulic acid onto a polymeric resin: Axial dispersion and intraparticle diffusion [J]. Environmental Technology, 2016, 37(15): 1914–1922. DOI: 10.1080/09593330.2015.1135993.
[18] MOHAN S, SINGH D K, KUMAR V, HASAN S H. Modelling of fixed bed column containing graphene oxide decorated by MgO nanocubes as adsorbent for Lead (II) removal from water [J]. Journal of Water Process Engineering, 2017, 17: 216–228. DOI: 10.1016/ j.jwpe.2017.03.009.
[19] YAHAYA N K E M, ABUSTAN I, LATIFT M F P M. Fixed-bed column study for Cu (II) removal from aqueous solutions using rice husk based activated carbon [J]. International Journal of Engineering & Technology, 2013, 11(1): 186–190.
[20] MALKOC E, NUHOGLU Y. Fixed bed studies for the sorption of chromium (VI) onto tea factory waste [J]. Chemical Engineering Science, 2006, 61(13): 4363–4372. DOI: 10.1016/j.ces.2006.02.005.
[21] JEROLD M, JOSEPH D, PATRA N, SIVASUBRAMANIAN V. Fixed-bed column studies for the removal of hazardous malachite green dye from aqueous solution using novel nano zerovalent iron algal biocomposite [J]. Nanotechnology for Environmental Engineering, 2016, 1(1): 8. DOI: 10.1007/s41204-016-0007-2.
[22] JI Fei, LI Chao-lin. Dynamic adsorption of Cu (II) from aqueous solution by zeolite/cellulose acetate blend fiber in fixed-bed [J]. Colloids and Surfaces A: Physicochemical and Engineering Aspects, 2013, 434: 88–94. DOI: 10.1016/ j.colsurfa.2013.05.045.
[23] XIONG Chun-hua, LI Yan-li, WANG Guo-tao, FANG Lei, ZHOU Su-guo, YAO Cai-ping, CHEN Qing, ZHENG Xu-ming, QI Dong-ming, FU Ya-qin, ZHU Yao-feng. Selective removal of Hg (II) with polyacrylonitrile-2- amino-1,3,4-thiadiazole chelating resin: Batch and column study [J]. Chemical Engineering Journal, 2015, 259: 257–265. DOI: 10.1016/j.cej.2014.07.114.
[24] TALAT M, MOHAN S, DIXIT V, SINGH D K, HASAN S H, SRIVASTAVA O N. Effective removal of fluoride from water by coconut husk activated carbon in fixed bed column: Experimental and breakthrough curves analysis [J]. Groundwater for Sustainable Development, 2018, 7: 48–55. DOI: 10.1016/j.gsd.2018.03.001.
[25] TAMILSELV S, ASAITHAMBI M. Column mode adsorption studies of acid dye using a novel adsorbent [J]. Rasayan Journal of Chemistry, 2015, 8(1): 84–91.
[26] PAULINO A T, BELFIORE L A, KUBOTA L T, MUNIZ E C, ALMEIDA V C, TAMBOURGI E B. Effect of magnetite on the adsorption behavior of Pb(II), Cd(II), and Cu(II) in chitosan-based hydrogels [J]. Desalination, 2011, 275: 187–196. DOI: 10.1016/j.desal. 2011.02.056.
[27] BAEK K, SONG S, KANG S, RHEE Y, LEE C, LEE B, HUDSON S, HWANG T. Adsorption kinetics of boron by anion exchange resin in packed column bed [J]. Journal of Industrial &Engineering Chemistry, 2007, 13(3): 452–456.
[28] HAN Run-ping, WANG Yi, ZOU Wei-hua, WANG Yuan-feng, SHI Jie. Comparison of linear and nonlinear analysis in estimating the Thomas model parameters for methylene blue adsorption onto natural zeolite in fixed-bed column [J]. Journal of Hazardous Materials, 2007, 145: 331–335. DOI: 10.1016/j.jhazmat.2006.12.027.
[29] DALAL Z, HUSEIN, AL-RADADI T, DANISH E Y. Adsorption of phosphate using alginate-/zirconium-grafted newspaper pellets: Fixed-bed column study and application [J]. Arabian Journal for Science & Engineering, 2017, 42(4): 1399–1412. DOI: 10.1007/s13369-016-2250-z.
[30] RECEPO LU Y K, KABAY N, IPEK I Y, ARDA M, YUKSEL M. Packed bed column dynamic study for boron removal from geothermal brine by a chelating fiber and breakthrough curve analysis by using mathematical models [J]. 2018, 437(1): 1–6. DOI: 10.1016/j.desal. 2018.02.022.
[31] MAO Juan, KIM S, WU Xiao-hui, KWAK I S, ZHOU Tao, YUN Y S. A sustainable cationic chitosan/E. coli fiber biosorbent for Pt(IV) removal and recovery in batch and column systems [J]. Separation and Purification Technology, 2015, 143(25): 32–39. DOI: 10.1016/j.seppur. 2015.01.023.
[32] IDAN I J, ABDULLAH L C, JAMIL S N A B M. OBAID M K, CHOONG T S Y. Fixed-bed system for adsorption of anionic acid dyes from binary solution onto quaternized kenaf core fiber [J]. Bioresources, 2017, 12(4): 8870–8885. DOI: 10.15376/biores.12.4.8870-8885.
[33] NTIMBANI R N, SIMATE G S, NDLOVU S. Removal of copper ions from dilute synthetic solution using staple ion exchange fibres: Dynamic studies [J]. Journal of Environmental Chemical Engineering, 2016, 4: 3143–3150. DOI: 10.1016/j.jece.2016.06.023.
(Edited by HE Yun-bin)
中文导读
模拟氯化钴电解液深度除铜用聚氯乙烯基2-氨甲基吡啶螯合树脂的动态吸附研究
摘要:介绍了在固定床中使用自制聚苯乙烯基2-氨基甲基吡啶螯合树脂(PS-AMP)从模拟钴电解液中深度去除铜(II)的研究。研究了床高(7.0~14.0 cm),进料流速(4.5~9.0 mL/min),初始铜(II)浓度(250~1000 mg/L),料液温度(25~40 °C)和pH值(2.0~4.0)对PS-AMP树脂吸附过程的影响。实验数据表明,PS-AMP树脂可以从模拟钴电解液中深度除铜(II)。选用玻璃柱直径为35 mm时,去除铜的最佳床高,进料流速,料液初始铜(II)浓度,料液温度和pH值分别为7.0 cm,4.5 mL/min,1000 mg/L,40 °C和4.0。在最佳实验条件下,穿透容量,饱和容量和饱和树脂中Cu/Co (g/g)的质量比相应地为16.51 mg/g干树脂,61.72 mg/g干树脂和37.67。铜(II)穿透曲线分别由Thomas模型,Yoon-Nelson模型和Adam-Bohart模型拟合。Thomas模型是最适合预测流出物中铜(II)浓度如何随吸附时间变化的模型。
关键词:深度除铜(II);螯合树脂;模拟钴电解液;固定床柱;模型拟合
Foundation item: Project(2014CB643401) supported by the National Basic Research Program of China; Projects(51134007, 51474256) supported by the National Natural Science Foundation of China; Project(2017TP1001) supported by the Hunan Provincial Science and Technology Plan Project, China.
Received date: 2018-04-10; Accepted date: 2018-12-25
Corresponding author: HU Hui-ping, Professor; Tel: +86-731-88879616; E-mail: phuhuiping@126.com; ORCID: 0000-0002-6106-5372

