Trans. Nonferrous Met. Soc. China 23(2013) 2250-2259
Application of response surface methodology to maximize tensile strength and minimize interface hardness of friction welded dissimilar joints of austenitic stainless steel and copper alloy
G. VAIRAMANI1, T. SENTHIL KUMAR2, S. MALARVIZHI3, V. BALASUBRAMANIAN3
1. Department of Mechanical Engineering, Seshasayee Institute of Technology, Tiruchirappalli 620012, India;
2. Department of Mechanical Engineering, Anna University of Chennai, Tiruchirappalli Campus, Tiruchirappalli 620024, India;
3. Centre for Materials Joining & Research (CEMAJOR), Department of Manufacturing Engineering, Annamalai University, Annamalainagar 608002, India
Received 13 September 2012; accepted 2 March 2013
Abstract: An attempt was made to optimize friction welding parameters to attain a minimum hardness at the interface and a maximum tensile strength of the dissimilar joints of AISI 304 austenitic stainless steel (ASS) and copper (Cu) alloy using response surface methodology (RSM). Three-factor, five-level central composite design matrix was used to specify experimental conditions. Twenty joints were fabricated using ASS and Cu alloy. Tensile strength and interface hardness were measured experimentally. Analysis of variance (ANOVA) method was used to find out significant main and interaction parameters and empirical relationships were developed using regression analysis. The friction welding parameters were optimized by constructing response graphs and contour plots using design expert software. The developed empirical relationships can be effectively used to predict tensile strength and interface hardness of friction welded ASS-Cu joints at 95% confidence level. The developed contour plots can be used to attain required level of optimum conditions to join ASS-Cu alloy by friction welding process.
Key words: friction welding; austenitic stainless steel; copper alloy; tensile strength; interface hardness; response surface methodology
1 Introduction
Joints of dissimilar metal combinations are employed in different applications requiring certain special combination of properties as well as to save cost incurred towards costly and scarce materials [1]. Conventional fusion welding of many such dissimilar metal combinations is not feasible owing to the formation of brittle and low melting intermetallics due to metallurgical incompatibility, wide difference in melting point, thermal mismatch, etc. Solid-state welding processes that limit extent of intermixing are generally employed in such situations. Friction welding is such one solid-state welding process widely employed in such situations [2].
DOBROVIDOV [3] investigated the selection of optimum conditions for the friction welding of high speed steel to carbon steel. ISHIBASHI et al [4] chose stainless steel and high speed steel as representative materials with an appreciably difficult weldability, and their adequate welding conditions were established. The distributions of the alloying elements at and near the weld interface with sufficient strength were analyzed using X-ray micro-analyzer. SAHIN [5] analyzed the variations in hardness and microstructure at the interfaces of friction welded steel joints. While using austenitic stainless steel, negative metallurgical changes like delta ferrite formation and chromium carbide precipitation between grain boundaries took place during fusion welding. These changes are eliminated by friction welding. The effect of friction time on the fully plastically deformed region in the vicinity of the weld was investigated by SATHIYA et al [6].
ANANTHAPADMANABAN [7] reported the effect of friction welding parameters on the tensile properties of steel. SATYANARAYANA et al [8] joined austenitic�C ferritic stainless steel (AISI 304 and AISI 430) using continuous drive friction welding and investigated the optimum parameters, microstructures, mechanical property and fracture behaviors. YILMAZ [9] investigated variations in hardness and microstructures in the welding zone of friction welded dissimilar materials. The effect of friction pressure on the properties of hot rolled iron based super alloy was investigated by AFES et al [10]. MESHRAM et al [11] investigated the influence of interaction time on microstructure and tensile properties of the friction welding of dissimilar metal combinations. PAVENTHAN et al [12] optimized the friction welding parameters to attain a maximum tensile strength in dissimilar joints of austenitic stainless steel and aluminium alloy.
It is understood that most of the published information on friction welding of dissimilar materials focused on the microstructural characteristics, microhardness variations, phase formation and tensile properties evaluation [3-12]. All the above mentioned investigations were carried out on trial and other basis to attain optimum welding conditions. No systematic study has been so far reported to optimize the tensile strength of friction welded dissimilar joints of austenitic stainless steel and copper alloy. Hence in this investigation, an attempt was made to optimize the friction welding parameters to minimize interface hardness of the joint and thus maximize tensile strength of the dissimilar joints of AISI 304 austenitic stainless steel (ASS) and copper (Cu) alloy using statistical tools such as design of experiments, analysis of variance, regression analysis and response surface methodology.
2 Experimental
2.1 Evaluation of base metals properties
The base metals used in this investigation were extruded rods of austenitic stainless steel and copper alloy. Chemical composition and mechanical properties were analyzed to confirm the base metal properties. The chemical composition of the base metals was obtained using a vacuum spectrometer (Make: ARL USA; Model: 3460). Sparks were ignited at various locations of the base metal sample and their spectra were analyzed for the estimation of alloying elements. The chemical compositions of the base metals are given in Table 1. Tensile specimens were prepared to obtain the base metal tensile properties. ASTM E8M-04 (ASTM, 2004a) guidelines were followed for preparing the test specimens. Tensile test was carried out on 100 kN, electro-mechanical controlled universal testing machine (Make: FIE-BLUE STAR, India; Model: UNITEK- 94100). The specimen was loaded at the rate of 1.5 kN/min as per ASTM specification, so that tensile specimen underwent uniform deformation. The specimen finally failed after the necking and then the load versus displacement was recorded. The 0.2% offset yield strength was derived from the diagram. The elongation and reduction in cross-sectional area were evaluated and the values are presented in Table 2. A Vickers��s microhardness testing machine (Make: Shimadzu, Japan; Model HMV-2T) was employed for measuring the hardness of the base metals with 0.49 N load. Microstructural examination was carried out using a light optical microscope (Make: MEIJI, Japan; Model: ML7100). The optical micrographs of the as-received base metals are shown in Fig. 1.
2.2 Finding working limits of welding parameters
From Refs. [3-12], the predominant factors that greatly influence the tensile strength and interface hardness of friction welded (FW) joints were identified. They are: 1) friction pressure, 2) forging pressure, 3) friction time, 4) forging time and 5) rotational speed. Though there are five factors, in this investigation, these factors are combined in such a way to make three factors. They are: 1) the ratio between friction pressure and friction time (F), 2) the ratio between forging pressure and forging time (D) and 3) the rotational speed per second (N). Trial experiments were conducted to determine the working range of the above factors by varying one of the process parameters and keeping rest of them at a constant value. The working range was fixed in such a way that the friction welded joints should be free from any visible external defects.
1) If the friction pressure per second was lower than 7 MPa/s, the joint was not properly bonded due to less heat generation and insufficient pressure (Fig. 2(a)).
2) If the friction pressure per second was more than 23 MPa/s, then the Cu alloy underwent large deformation due to high heat generation and excessive pressure (Fig. 2(b)).
3) If the forging pressure per second was lower than 7 MPa/s, the deformation of the material was low, then the joints were weakly bonded (Fig. 2(c)).
4) If the forging pressure per second was more than 23 MPa/s, it resulted in extensive deformation in the Cu alloy side (Fig. 2(d)).
Table 1 Chemical composition of ASS and Cu alloy

Table 2 Mechanical properties of ASS and Cu alloy
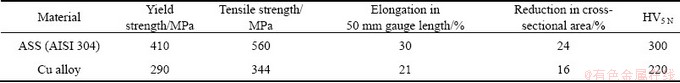
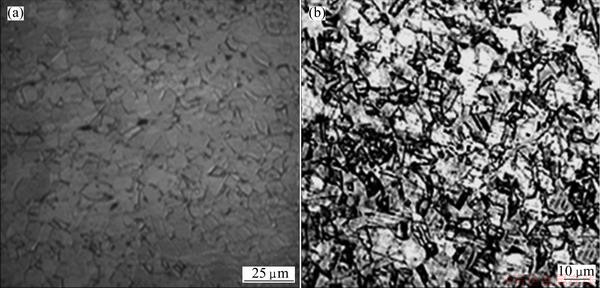
Fig. 1 Optical micrographs of ASS (a) and Cu alloy (b)
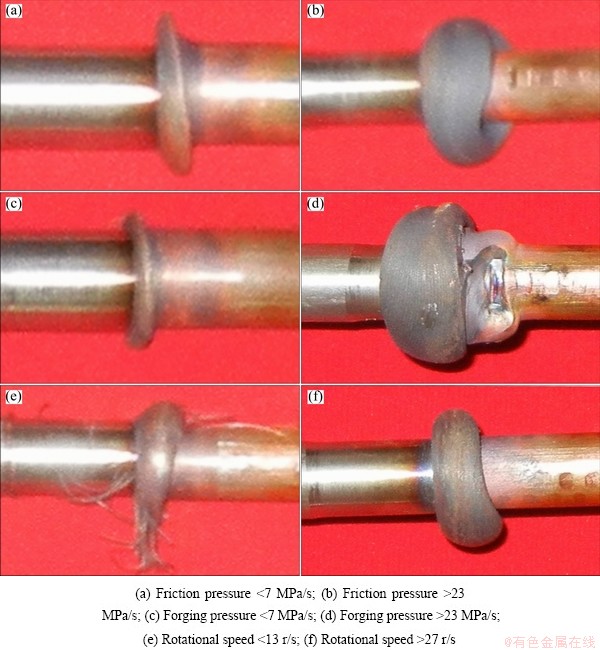
Fig. 2 Photographs of joint fabricated outside feasible working limits
5) If the rotational speed was lower than 13 r/s, the frictional heat generation was too low and hence bonding was improper (Fig. 2(e)).
6) If the rotational speed was greater than 27 r/s, the friction heat generated was too high and hence excessive flash formation occurred in Cu alloy side (Fig. 2(f)).
2.3 Developing experimental matrix and fabrication of joints
As the range of individual factor was wide, a central composite rotatable three-factor, five-level, central composite rotatable design matrix was selected. The chosen welding parameters and the levels are presented in Table 3. The experimental design matrix consisting of 20 sets of coded condition and comprising a full replication three-factor factorial design of 8 points, 6 star points, and 6 center points was used (Table 4). The method of designing such matrix was dealt elsewhere [13]. The upper and lower limits of the parameters were coded as +1.682 and �C1.682, respectively. The coded values for intermediate levels can be calculated from the following relationship [13].
Xi=1.682[2X-(Xmax+Xmin)]/(Xmax-Xmin) (1)
where Xi is the required coded value of a variable X; X is any value of the variable from Xmin to Xmax; Xmin is the lower level of the variable; Xmax is the highest level of the variable.
Cylindrical rods of ASS and Cu alloy having 12 mm diameter were cut to the required length of 75 mm by power hacksaw. The surfaces to be joined were faced using a lathe machine to fabricate friction welded joints. Hydraulic alloy controlled, continuous drive friction welding machine (11025 W; 3000 r/min; 20 kN) was used to fabricate the joints. The friction welded joints were made according to the condition dictated by the design matrix (Table 4) at random order so as to avoid the noise creeping output response. Figure 3 shows the photograph of the welded joints.
Table 3 Feasible working range of friction welding parameters
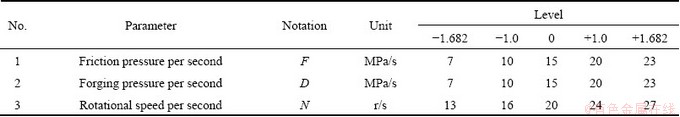
Table 4 Design matrix and experimental results
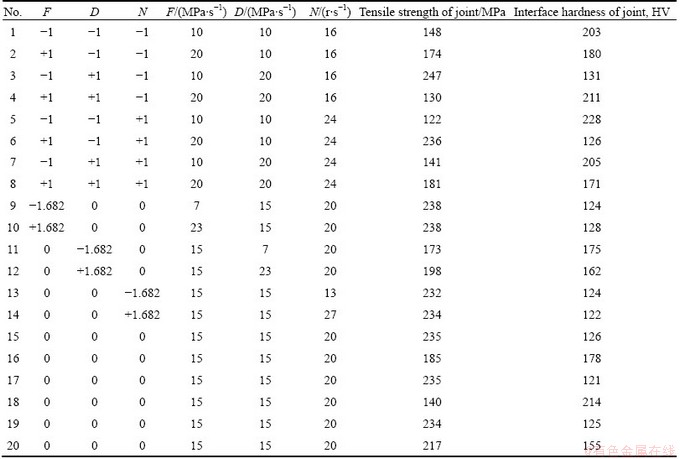
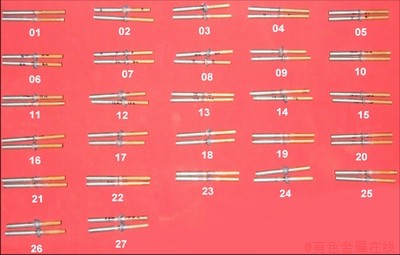
Fig. 3 Photograph of friction welded ASS-Cu joints
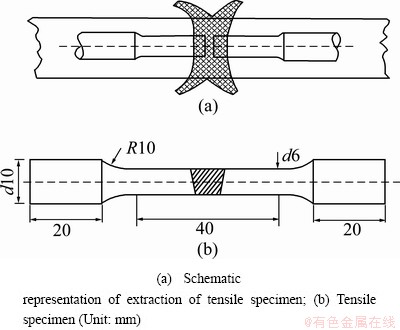
Fig. 4 Dimensions of tensile specimen
2.4 Recording responses (tensile strength and interface hardness)
The schematic representation of extraction of tensile specimen from the welded joints for preparing tensile specimens is shown in Fig. 4(a). The welded joints were machined to the required dimensions (Fig. 4(b)). Three tensile specimens from each welding condition were fabricated according to the American Society for Testing of Materials (ASTM E8M-04) standards to evaluate the tensile strength of the joints. Tensile test was carried out in 100 kN, electro-mechanically controlled universal testing machine. The specimen was loaded at the rate of 1.5 kN/min according to the ASTM specifications. The average of three tensile tested specimen value of each condition is presented in Table 4 for developing empirical relationship.
Vickers��s microhardness testing machine (Make: SHIMADZU, Japan; Model: HMV-T1) was employed for measuring the hardness along the joint interface with 4.9 N load and 15 s dwelling time. Five readings were taken in each joint and the average was recorded in Table 4 for developing empirical relationship.
3 Developing empirical relationships
The responses, tensile strength (TS) and interface hardness (IH), of friction welded joints are functions of the friction welding parameters such as friction pressure per second (F), forging pressure per second (D) and rotational speed per second (N), and they can be expressed as [12]
TS=f{F, D, N} (2)
IH=f {F, D, N} (3)
The second-order polynomial (regression) equation used to represent the response surface Y (TS or IH) is given by [13]
Y=b0+��bixi+��biixi2+��bijxixj (4)
and for three factors, the selected polynomial could be expressed as
TS or IH={b0+b1F+b2D+b3N+b12FD+b13FN+b23DN+b11F2+b22D2+b33N 2} (5)
where b0 is the average of the responses and b1, b2, b3,��, b44 are regression coefficients [13] that depend on respective linear, interaction, and squared terms of factors. The coefficient was calculated using design expert software. The significance of each coefficient was determined by Student��s t test and p values, which are listed in Tables 5 and 6. The values of ��Prob>F�� less than 0.0500 (95% confidence level) indicate that the model terms are significant. The values greater than 0.10 indicate that the model terms are not significant.
The final empirical relationship was constructed using only these coefficient and the developed final empirical relationships are given below.
Tensile strength of the joint,
TS={235.33+22.29F+7.54D+32.18N+1.87FD+7.13FN-3.63DN-20.05F2-17.58D2-18.64N2} (6)
Interface hardness of the joint,
IH={124.82-18.03F-3.72D-26.21N+0.38FD-5.87FN+7.88DN+21.16F2+5.51D2+15.51N2} (7)
4 Adequacy of developed relationships
The adequacy of the developed relationships was tested using the analysis of variance (ANOVA) technique and the results of second order response surface model fitting in the form of analysis of variance (ANOVA) are given in Tables 5 and 6. The determination coefficient (R2) indicates the goodness of fit for the model. In this case, the values of the determination coefficient (R2) indicate that the model does not explain only less than 5% of the total variations [14]. The values of adjusted determination coefficient (adjusted R2) should be high, which indicates a high significance of the model. Predicted R2 denotes the agreement with the adjusted R2.
Table 5 ANOVA test results for tensile strength model
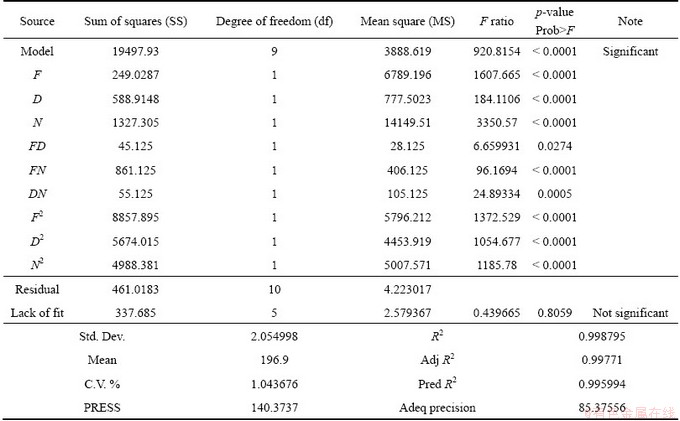
Table 6 ANOVA test results for interface hardness model
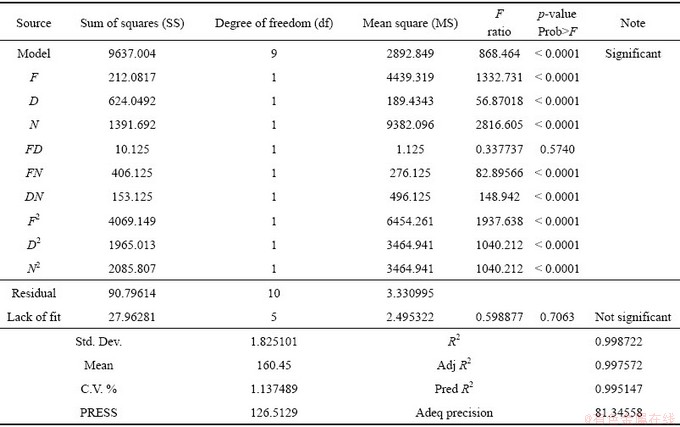
Adequate precision compares the range of the predicted values at the design points to the average prediction error. The value of R2 for the above-developed relationships is found to be above 0.95, which indicates high correlation between the experimental values and the predicated values. Figure 5 shows the high correlation existing between the experimental values and the predicted values.
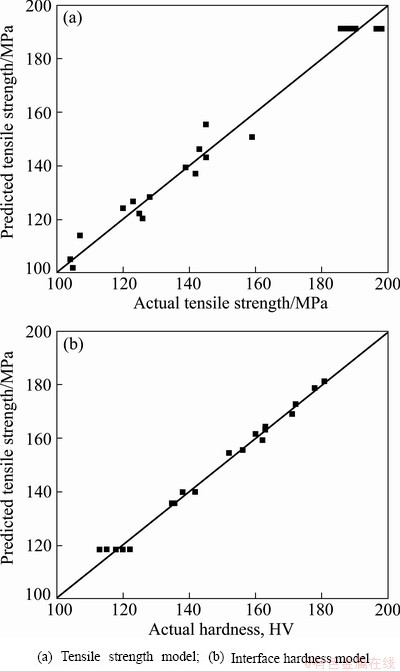
Fig. 5 Correlation graphs
5 Optimization
5.1 Response surface methodology (RSM)
Response surface methodology (RSM) is a collection of mathematical and statistical technique useful for analyzing problems in which several independent variables influence a dependent variable or response and the goal is to optimize the response. In many experimental conditions, it is possible to represent independent factors in quantitative form given in Eq. (8). Then these factors can be thought of as having a functional relationship or response as follows:
 (8)
(8)
Between the response Y and x1, x2, ��, xk of k quantitative factors, the function �� is called response surface or response function. The residual er measures the experimental errors. For a given set of independent variables, a characteristic surface is responded. When the mathematical form of �� is not known, it can be approximated satisfactorily within the experimental region by a polynomial. The higher the degree of the polynomial, the better the correlation; but at the same time the costs of experimentation become higher. In the present investigation, RSM was applied to developing empirical relationships in the form of multiple regression equations for the quality characteristic of the friction welded dissimilar joints of ASS and Cu alloy. In applying the response surface methodology, the independent variable was viewed as a surface to which a mathematical model is fitted.
5.2 Contour plots and response graphs
Contour plots show a distinctive circular mound shape indicative of possible independence of factors with response. A contour plot is produced to visually display the region of optimal factor settings. For the second order response surfaces, such a plot can be more complex than the simple series of parallel lines that can occur with the first order models. Once the stationary point is found, it is usually necessary to characterize the response surface in the immediate vicinity of the point. Characterization means to identify whether the stationary point found is a maximum response or minimum response or a saddle point. To classify this, the most straightforward way is to examine through a contour plot. Contour plots play a very important role in the study of the response surface. By generating contour plots using software for response surface analysis, the optimum is located with reasonable accuracy by characterizing the shape of the surface. If a contour patterning of circular shape occurs, it tends to suggest independence of factor effects while elliptical contours may indicate factor interactions [14].
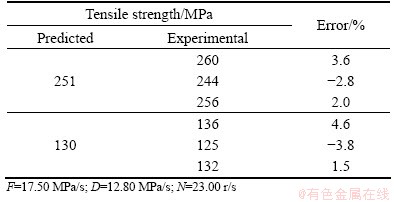
Response surfaces have been developed for the models, considering two parameters in the middle level and plotting these in ��X�� and ��Y�� axes and response in ��Z�� axis. The response surfaces clearly indicate the optimal response point. Figures 6 and 7 show the contour plots and response graphs for the model developed for tensile strength of the joint and interface hardness of the joint (Eqs. (6) and (7)). By analyzing the response surfaces and contour plots (Fig. 6), the maximum achievable tensile strength of the friction welded dissimilar joints of ASS and Cu is found to be 251 MPa. By analyzing the response surface and contour plots (Fig. 7), the minimum achievable interface hardness of the friction welded dissimilar joints of ASS and Cu is found to be HV 130. The corresponding parameters that yielded the maximum tensile strength and minimum interface hardness are: friction pressure of 17.5 MPa/s, forging pressure of 12.8 MPa/s and rotational speed of 23 r/s.
To validate and confirm the predictions of tensile strength and interface hardness by the RSM, three experiments were conducted by setting the optimized process parameter values. The experimental results, the predicted values and the error between the predicted and the experimental values are presented in Table 7. It is found that the maximum error is ��5%, which indicates the prediction capability of the developed optimization procedures.
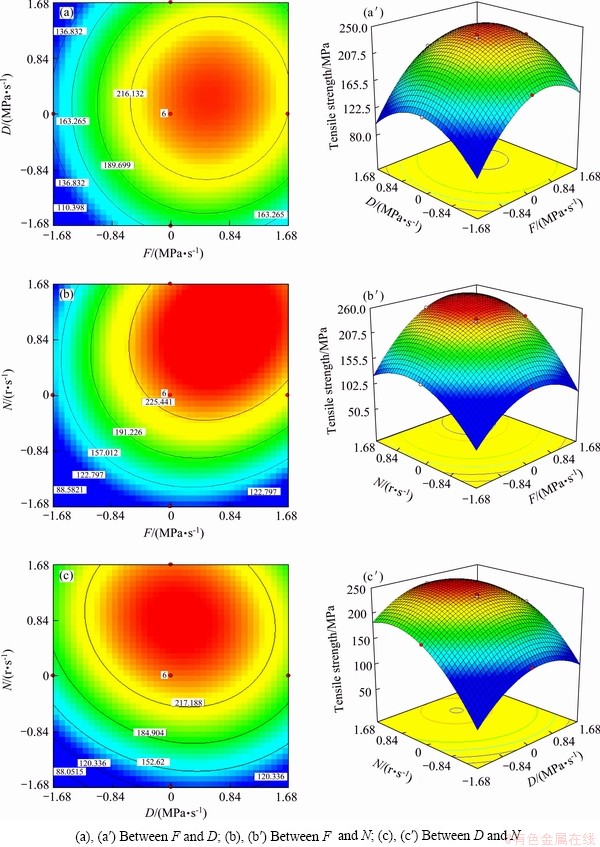
Fig. 6 Contour plots (a, b, c) and response graphs (a��, b��, c��) for tensile strength model
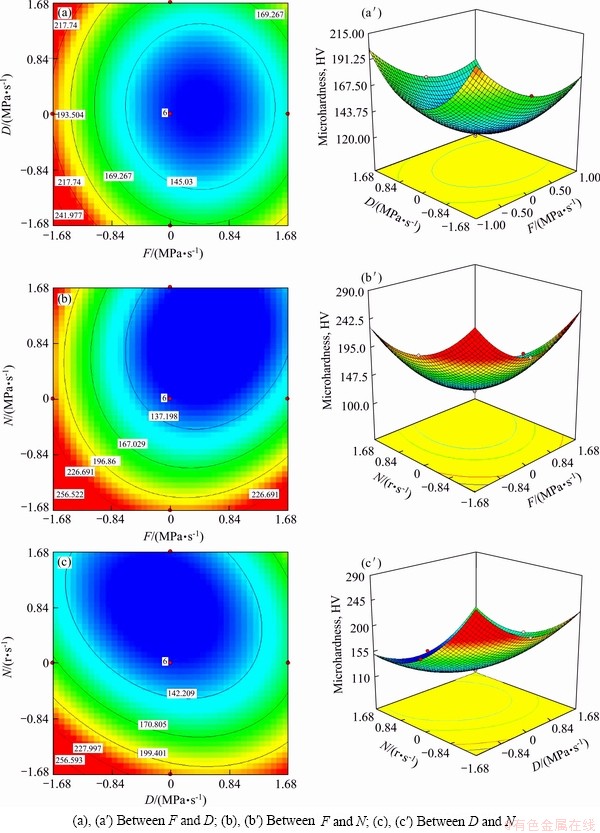
Fig. 7 Contour plots (a, b, c) and response graphs (a��, b��, c��) for interface hardness model
Table 7 Validation of optimization procedures
6 Conclusions
1) Empirical relationships were developed to predict (at 95% confidence level) the tensile strength and interface hardness of friction welded dissimilar joints of AISI 304 austenitic stainless steel and copper alloy incorporating friction welding parameters.
2) From the ��F�� ratio calculation, it is understood that the factor N, rotational speed, has predominant effect on the tensile strength and interface hardness of the friction welded dissimilar joints of ASS-Cu alloy. Similarly, the factor D, forging pressure, is observed to be less significant in controlling the tensile strength and interface hardness of the friction welded joints.
3) It is found that the maximum tensile strength that could be attained in the friction welded dissimilar joints of ASS-Cu alloy is 247 MPa under the welding conditions of F=10 MPa/s, D=20 MPa/s and N=16 r/s.
Acknowledgements
The authors are grateful to Dr. R. PAVENTHAN, associate professor, Department of Mechanical Engineering, JJ College of Engineering, Tiruchirappalli, India for rendering help during fabrication of joints. The authors also wish to record their sincere thanks to Dr. A. K. LAKSHMINARAYANAN, associate professor, Department of Mechanical Engineering, SSN College of Engineering, Chennai, India, for his help in statistical analysis.
References
[1] OZDEMIR N. Investigation of mechanical properties of friction- Welded joints between AISI 304 L and AISI 4340 steel as a function of rotational speed [J]. Materials Letters, 2005, 59: 2504-2509.
[2] YOON H K, KONG Y S, KIM S J, KOHYAMA A. Mechanical properties of friction welds of RAFs (JLF-1) to SUS 304 steels as measured by the acoustic emission technique [J]. Fusion Engineering and Design, 2006, 81: 945-950.
[3] DOBROVIDOV A N. Selection of optimum conditions for the friction welding of high speed steel 45 [J]. Welding Production, 1975, 22(3): 22-26.
[4] ISHIBASHI A, EZDE S, TANAKA S. Studies on friction welding of carbon and alloy�Csteels [J]. Bulletin of JSME, 1983, 26: 1080-1087.
[5] SAHIN M. Evaluation of the joint interface properties of austenitic stainless steel joined by friction welding [J]. Materials & Design, 2007, 28: 2244-2250.
[6] SATHIYA P, ARAVINDAN S, NOORUL HAQ A. Mechanical and metallurgical properties of friction welded AISI 304 austenitic stainless steel [J]. Internaional Journal of Advanced Manufacturing and Technology, 2005, 26: 505-511.
[7] ANANTHAPADMANABAN D. A study of mechanical properties of friction welded mild steel to stainless steel joints [J]. Materials & Design, 2009, 30: 2642-2646.
[8] SATHYANARAYANA V V, MADHUSUDHAN REDDY G, MOHANDAS T. Dissimilar metal friction welding of austenitic�Cferritic stainless steels [J]. Journal of Materials Processing and Technology, 2005, 60(2): 128-137.
[9] YILMAZ M. Investigation of the welding zone in friction welding of different tool steels [D]. Turkey: Technical University of Yildiz, 1993.
[10] AFES H, TURKER M, KURT A. Effect of friction pressure on the properties of friction welded MA956 iron based super alloy [J]. Materials & Design, 2007, 28: 948-953.
[11] MESHRAM S D, MOHANDAS T, MADHUSUDHAN REDDY G. Friction welding of dissimilar pure metals [J]. Journal of Materials Processing and Technology, 2007, 184: 330-337.
[12] PAVENTHAN R, LAKSHMINARAYANAN P R, BALASUBRAMANIAN V. Prediction and optimization of friction welding parameters for joining aluminium alloy and stainless steel [J]. Transactions of Nonferrous Metals Society of China, 2011, 21: 1480-1485.
[13] MONTGOMERY D C. Design and analysis of experiments [M]. 4th ed. New York: John Wiley & Sons, 2001.
[14] MILLER J E. FREUND, JOHNSON R. Probability and Statistics for Engineers [M]. Vol.5. New Delhi: Prentice Hall, 1996.
��Ӧ�淽���ڰ����岻�����ͭ�Ͻ����ֲ���Ħ������ͷ�Ŀ���ǿ����ͽ���Ӳ����С���е�Ӧ��
G. VAIRAMANI1, T. SENTHIL KUMAR2, S. MALARVIZHI3, V. BALASUBRAMANIAN3
1. Department of Mechanical Engineering, Seshasayee Institute of Technology, Tiruchirappalli 620012, India;
2. Department of Mechanical Engineering, Anna University of Chennai, Tiruchirappalli campus, Tiruchirappalli 620024, India;
3. Centre for Materials Joining & Research (CEMAJOR), Department of Manufacturing Engineering, Annamalai University, Annamalainagar 608002, India
ժ Ҫ���ڰ����岻�����ͭ�Ͻ����ֲ���Ħ�����ӹ����У�������Ӧ�淽���Ż�Ħ�����ӹ��ղ������Ի�ÿ���ǿ�����ͽ���Ӳ����С�ĺ��ӽ�ͷ�����������ء���ˮƽ���ĸ�������������ȷ��ʵ���������õ�20�����ӽ�ͷ���ⶨ�˺��ӽ�ͷ�Ŀ���ǿ�Ⱥͽ���Ӳ�ȡ����÷������(ANOVA)������ȷ�����������õġ���Ҫ�ļ�����õIJ�����ʹ�ûع�����õ������ϵģ�͡������ר������������Ӧͼ�͵ȸ���ͼ���Ż�Ħ�����ӹ��ղ������õõ��ľ����ϵģ�Ϳ�����Ч��Ԥ�⺸�ӽ�ͷ�Ŀ���ǿ�Ⱥͽ���Ӳ�ȣ�������ˮƽ��95%�����γɵĵȸ���ͼ���Եõ������Ħ�����ӵ����������
�ؼ��ʣ�Ħ�����ӣ������岻��֣�ͭ�Ͻ𣻿���ǿ�ȣ�����Ӳ�ȣ���Ӧ�淽��
(Edited by Hua YANG)
Corresponding author: V. BALASUBRAMANIAN; Tel: +91-4144-239734; Fax: +91-4144-239734/238275; E-mail: visvabalu@yahoo.com
DOI: 10.1016/S1003-6326(13)62725-9

