Trans. Nonferrous Met. Soc. China 22(2012) 2679-2684
In-situ quantitative monitoring of fatigue crack using fastest time of flight diffraction method
DU Chao-liang1, 2, WANG Yi-shou2, 3, GAO Dong-yue3, LIU Ke-hai3, QING Xin-lin2
1. Department of Mechanics and Aerospace Engineering, Peking University, Beijing 100871, China;
2. Beijing Aeronautical Science and Technology Research Institute, Commercial Aircraft Corporation of China, Ltd., Beijing 102211, China;
3. School of Aeronautics and Astronautics, Dalian University of Technology, Dalian 116024, China
Received 9 July 2012; accepted 10 August 2012
Abstract: Due to the cyclic loading and longtime exposure under extreme environment conditions, fatigue cracks often generate in the aircraft metal structures, i.e. wing skin, fuselage skin, strigners, pylons. These cracks could cause severe damages to the aircraft structures. Thus the position and size monitoring of fatigue cracks in the metal structures is very important to manufacturers as well as maintenance personnel for significantly improving the safety and reliability of aircraft. Much progress has been made for crack position monitoring in the past few years. However, the crack size monitoring is still very challenging. Fastest time of flight diffraction (FTOFD) method was developed to monitor both the position and size of a crack. FTOFD method uses an integrated sensor network to activate and receive ultrasonic waves in a structure. Diffraction waves will be generated when the ultrasonic waves pass a crack. These diffraction waves are received and analyzed to get the position and size of the crack. The experiment results show that the monitored size of the simulated crack is very close to the real size of the crack, and for frequencies of 350 and 400 kHz, the monitoring errors are both smaller than 5%.
Key words: structure health monitoring; fatigue crack; diffraction waves; crack size quantification
1 Introduction
Fatigue cracks could cause severe degradation to the functionality of aircraft metal structures, thus much attention has been paid on them [1,2]. Monitoring of cracks of aircraft structures could significantly reduce the maintenance cost [3], and increase service time and flight safety of the aircraft [4-6]. Boeing [7,8] and Airbus [9,10] are making many efforts to crack monitoring for commercial airplanes. US Air Force has conducted many researches on fatigue crack monitoring for key structure components of military aircrafts [11]. Researchers in China have also investigated crack detection a lot by elastic waves [12-14].
Many structural health monitoring (SHM) methods have been proposed in the past few years. One type of them is based on elastic waves. Elastic-wave-based SHM method uses sensors to activate and receive the wave signals. The damage information of structures will be gotten by analyzing the received wave signals. Many researchers demonstrated that this method were very effective for monitoring cracks in metals, delamination and debonding in composites [15]. For widely existing plate or shell structures in aircraft, ship, automobile and so on, Lamb waves are commonly used due to their great advantages of long distance propagation, broad covering, and easy activation, etc. Many results have been made for crack monitoring in the past few years with Lamb waves. IHN and CHANG [3] used a pair of piezoelectric actuator and sensor to generate a damage index of Lamb waves which can be used to characterize the damage at a known location.
Tests on Airbus fuselage panels were conducted to verify the damage index method. They [16,17] also monitored the fatigue crack growth in riveted fuselage joints and a cracked metallic plate repaired with a bonded composite patch with the damage index method. Experiments showed that the damage index method successfully detected both crack growth and debonding damage for the considered structures. QING et al [18] developed an active diagnostic system using built-in piezoelectric actuator/sensor networks for monitoring crack growth in a rocket engine pipe, and their experimental data showed that the system can detect a surface crack as small as 4 mm and a through-crack as small as 2 mm in the high pressure engine pipe made of Inconel 718. IHN of Boeing and LEONARD of Air Force Research Laboratory developed a hot spot monitoring system for a complex metallic lug component. Phased array was also widely investigated by some researchers to quantify damage size [19]. Nonlinear ultrasonic wave was studied a lot to evaluate the micro-cracks in alloys [20-22{Bin, 2011 #2210}]. However, calibration is still needed by most methods to build a relationship between monitored signals and crack size. The size or severity of cracks is still very challenging to evaluate.
In this study, we developed FTOFD method to evaluate position and size of cracks in structures. FTOFD method uses an integrated sensor network to activate and receive ultrasonic waves in a structure. Diffraction waves will be generated when the ultrasonic waves pass a crack. These diffraction waves are then received and analyzed to get the position and size of the crack. An aluminum plate with 20 mm long simulated crack was monitored by FTOFD method in this study. Experiment results showed that the monitoring results matched the real position and size of the simulated crack very well.
2 Theoretical model of FTOFD method
The physical basis of FTOFD method is that when the proper ultrasonic waves pass a crack, diffraction waves propagating to all directions will be generated at tips of the crack. So if we can collect and analyze these diffraction waves, the crack tips can be located. Once the crack tips are located, the position and size of the crack can be detected.
An isotropic aluminum plate (Fig. 1) is used as an example to demonstrate how to quantitatively monitor a crack by FTOFD method. The coordinate of sensor 1 is denoted by (x1, y1), and the coordinates of other sensors are denoted similarly. The coordinate of crack tip A is denoted by (x, y). The time of flight (TOF) of the ultrasonic waves from sensor 1 to sensor 2 is denoted by t12, and the TOF from sensor 1 to crack tip A, then to sensor 2 is denoted by tc12. The TOFs for other paths are denoted similarly. The distance between sensor 1 and sensor 2 is denoted by L12, and the distances between other sensors are denoted similarly. In this demonstration, a combination of paths 1-2, 2-3, and 4-5 are used to locate crack tip A, however, other combinations of paths, e.g. 1-2, 1-3 and 4-5, can be used as well.
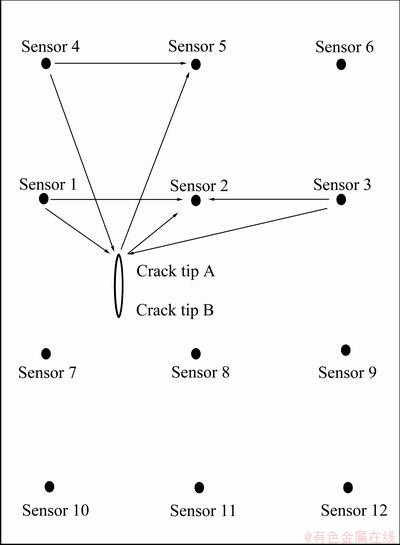
Fig. 1 Sensor network for monitoring crack
Because the aluminum plate is isotropic, the TOF of ultrasonic waves should be proportional to the distance of the waves traveling. So, after the TOFs of ultrasonic waves containing damage information for different paths are collected, crack tip A (x, y) can be located by
 (1)
(1)
Equation (1) actually defines 3 ellipses. The crossing point/region of these ellipses is the monitored crack tip A. Crack tip B can be located in the same way. After all related TOFs are collected by the sensor network, the crack can be located as in Fig. 2.
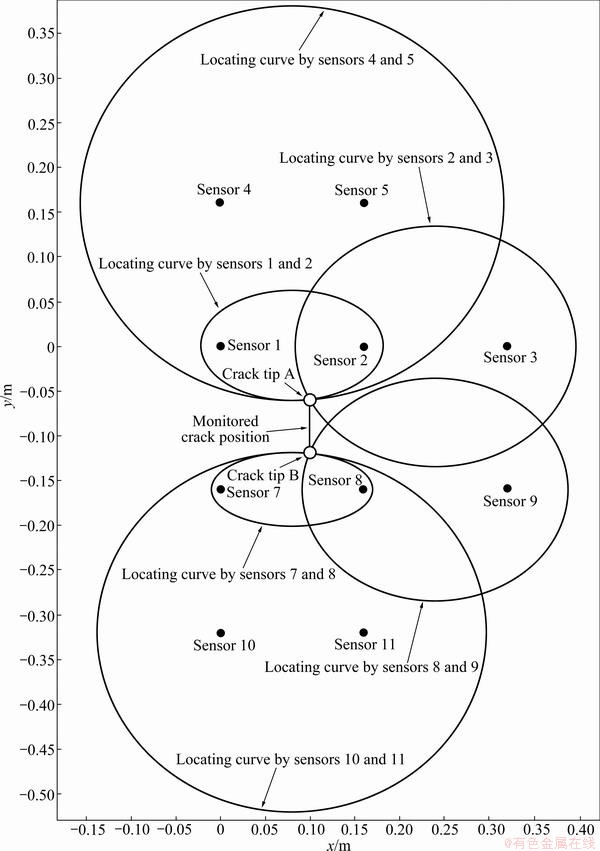
Fig. 2 Crack locating by FTOFD method
3 Experimental results and analyses
Experiments were performed to verify FTOFD method. The sample is an aluminum plate. The plate is 520 mm × 490 mm × 1.9 mm in size. The simulated crack was made by a wire-electrode cutting machine. The crack was 20 mm in length and 0.25 mm in width.
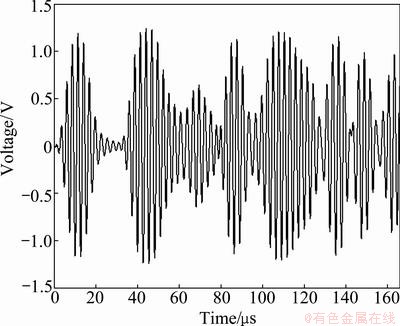
Fig. 3 Baseline signal of plate
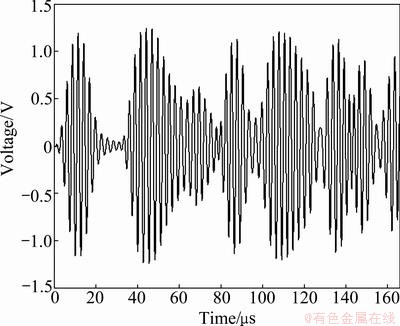
Fig. 4 Current signal of plate with crack
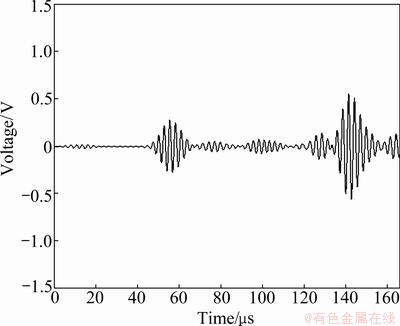
Fig. 5 Damage signal induced by crack
Acellent’s ScanGenie was used to generate and collect the signals. Before the simulated crack was made, the baseline signal (Fig. 3) was collected; after the simulated crack was made, the current signal (Fig. 4) was collected. Subtracting the baseline signal from the current signal gave the signal difference induced by the crack (Fig. 5). This signal difference will be referred as damage signal in the following. In the experiment, only paths 1-2 and 1-3 were used to test the effectiveness of FTOFD method. The collected data and its analysis can be found in Tables 1 and 2. Peak value method was used to compute the TOF. In Table 1, t1 is the peak value time of waves generated by sensor 1; t2 is the peak value time of waves received by sensor 2; tc2 is the peak value time of waves, which are the diffraction waves induced by the crack and then received by sensor 2; t12 is the TOF from sensor 1 to sensor 2, which is gotten by subtracting t1 from t2; tc12 is the TOF from sensor 1, to crack tip A, then to sensor 2, which is gotten by subtracting t1 from tc2; Lc12 is the distance from sensor 1, to crack tip A, then to sensor 2; e is the error of the monitored TOF. The monitored distances Lc12 from sensor 1, to crack, then to sensor 2 can be computed out by the monitored TOF,
 (2)
(2)
Comparing the monitored distance  with the real distance Lc12 gives the error of the monitoring results,
 (3)
(3)
From Tables 1 and 2, it can be seen that the monitoring errors for frequency of 350, 400 and 450 kHz are all below 5%. Using monitoring results in Tables 1 and 2, the position of crack tip A can be located by Eq. (1). The locating results are listed in Table 3.
In Table 3, the monitoring error (ex) of x coordinate of crack tip A is computed by
 (4)
(4)
where xm is the monitored value, xr is the real value.
The monitoring error (ey) of y coordinate of crack tip A is computed similarly by
 (5)
(5)
where ym is the monitored value, yr is the real value, and L17 is the distance from sensor 1 to sensor 7.
It can be seen that the errors of the monitoring results for the frequencies of 350 kHz and 400 kHz are all below 5%, but that of the x coordinate for frequency of 450 kHz is very large. The monitored position can also be showed graphically. The monitored position of the crack for frequencies of 350 kHz and 400 kHz can be seen in Figs. 6 and 7, respectively (In Figs. 6 and 7, the line with diamond ends is the real crack position and the line without diamond ends is the monitored crack position). It is clear that the monitoring results for frequency of 350 kHz is much better than those for frequency of 400 kHz.
Table 1 Monitoring data of sensor 1 and sensor 2 and its analysis
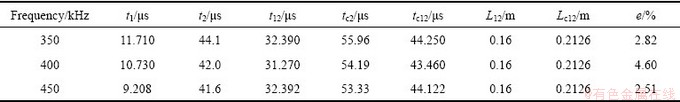
Table 2 Monitoring data of sensor 1 and sensor 3 and analysis
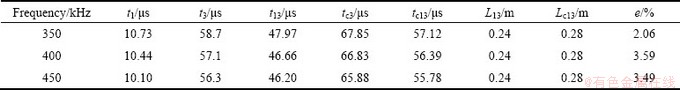
Table 3 Monitored position of crack tip A
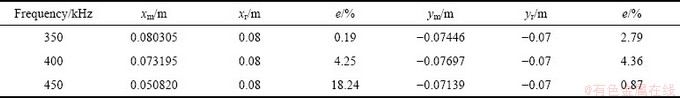
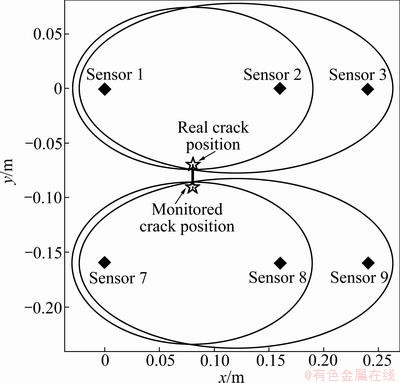
Fig. 6 Monitored position of crack for frequency of 350 kHz

Fig. 7 Monitored position of crack for frequency of 400 kHz
4 Conclusions
1) By locating crack tips with integrated sensors activating and receiving Lamb waves, FTOFD method can give not only the position, but also the size of a crack in the monitored structure.
2) For frequency of 350 kHz, the monitored position and size of the crack are very close to the real position and size of the crack, and the monitoring error is about 3%.
3) For frequency of 400 kHz, the monitoring error is about 4%, and for frequency of 450 kHz, the monitoring error is about 18%. Therefore, different frequencies have different monitoring accuracy. So, to get the best result, the optimal frequency should be used.
References
[1] CHEN Jun-zhou, ZHEN Liang, YANG Shou-jie, DAI Sheng-long. Effects of recipitates on fatigue crack growth rate of AA 7055 aluminum alloy [J]. Transactions of Nonferrous Metals Society of China, 2010, 20: 2209-2214.
[2] RITCHIE R O. Aspects of fatigue crack growth in intermetallic alloys [J]. Transactions of Nonferrous Metals Society of China, 1999, 9: 214-227.
[3] IHN J B, CHANG F K. Pitch-catch active sensing methods in structural health monitoring for aircraft structures [J]. Structural Health Monitoring, 2008, 7(1): 5-19.
[4] IHN J B, PADO M S, LEONARD M P, DESIMIO S, OLSON E. Development and performance quantification of an ultrasonic structural health monitoring system for monitoring fatigue cracks on a complex aircraft structure [C]//CHANG F K. 8th International Workshop on Structural Health Monitoring. Stanford, USA: Stanford University Press, 2011.
[5] SCHMIDT H J, SCHMIDT-BRANDECKER B. Design benefits in aeronautics resulting from SHM [C]// BOLLER C, CHANG F K, FUJINO Y. Encyclopedia of Structural Health Monitoring. Wiley Online Library, 2009.
[6] GIURGIUTIU V. Damage assessment of structures―An air force office of scientific research structural mechanics perspective [J]. Key Engineering Materials, 2007, 347: 69-74.
[7] IKEGAMI R, BOLLER C. History of SHM for commercial transport aircraft [C]//BOLLER C, CHANG Fou-kuo, FUJINO Y. Encyclopedia of Structural Health Monitoring. Wiley Online Library, 2009.
[8] CHANG F K. Design of integrated SHM system for commercial aircraft applications [C]//CHANG F K. 5th International Workshop on Structural Health Monitoring. Stanford: Stanford University Press, 2005.
[9] PAGET C, SPECKMANN H, KRICHEL T, EICHELBAUM F. Validation of SHM sensors in airbus A380 full-scale fatigue test [C]// BOLLER C, CHANG Fou-kuo, FUJINO Y. Encyclopedia of Structural Health Monitoring. Wiley Online Library, 2009.
[10] SCHMIDT H J, SCHMIDT-BRANDECKER B. Advanced technologies and materials applied by airbus and future prospects [J]. Canadian Aeronautics and Space Journal, 2004, 50(4): 213-220.
[11] DERRISO M M, OLSON S E. The future role of structural health monitoring for air vehicle applications [C]//CHANG F K. 5th International Workshop on Structural Health Monitoring. Stanford: Stanford University Press, 2005.
[12] WU Bin, YAN Bing-sheng, HE Cun-fu. Nonlinear ultrasonic characterizing online fatigue damage and in-situ microscopic observation [J]. Transactions of Nonferrous Metals Society of China, 2011, 21: 2597-2604.
[13] CAO Jun, YUAN Shen-fang, CAI Jian, QIU Lei, YU Zhen-hua. Real-time structural health monitoring for fatigue crack growth [J]. Piezoelectrics and Acoustooptics, 2008, 30(6): 776-778. (in Chinese)
[14] WANG Quan, WANG Da-jun, SU Xian-yue. Crack detection of structure for plane problem with spatial wavelets [J]. Acta Mechanica Sinica, 1999, 15(1): 39-51.
[15] OU Jin-ping, LI Hui. Structural health monitoring in mainland China: Review and future trends [J]. Structural Health Monitoring, 2010, 9(3): 219-231.
[16] IHN J B, CHANG F K. Detection and monitoring of hidden fatigue crack growth using a built-in piezoelectric sensor/actuator network (I): Diagnostics [J]. Smart Materials and Structures, 2004, 13: 609-620.
[17] IHN J B, CHANG F K. Detection and monitoring of hidden fatigue crack growth using a built-in piezoelectric sensor/actuator network (II): Validation using riveted joints and repair patches [J]. Smart Materials and Structures, 2004, 13: 621-630.
[18] QING X P, CHAN H L, BEARD S J, KUMAR A. An active diagnostic system for structural health monitoring of rocket engines [J]. Journal of Intelligent Material Systems and Structures, 2006, 17(7): 619-628.
[19] YU L Y, GIURGIUTIU V. In-situ optimized PWAS phased arrays for Lamb wave structural health monitoring [J]. Journal of Mechanics of Materials and Structures, 2007, 2(3): 459-487.
[20] GAO Gui-li, LI Da-yong, SHI De-quan, DONG Jing-wei. Identification of fatigue cracks in aluminum alloy plates based on nonlinear ultrasonic modulation spectrum [J]. The Chinese Journal of Nonferrous Metals, 2011, 21(4): 727-732. (in Chinese)
[21] KIM J Y, QU J, JACOBS L J, LITTLES J W, SAVAGE M F. Acoustic nonlinearity parameter due to microplasticity [J]. Journal of Nondestructive Evaluation, 2006, 25(1): 29-37
[22] DENG Ming-xi, PEI Jun-feng. Assessment of accumulated fatigue damage in solid plates using nonlinear Lamb wave approach [J]. Applied Physics Letters, 2007, 90(12): 3-5.
[23] WU Bin, YAN Bing-sheng, HE Cun-fu. Nonlinear ultrasonic characterizing online fatigue damage and in situ microscopic observation [J]. Transactions of Nonferrous Metals Society of China, 2011, 21: 2597-2604.
基于最快衍射波时差法的实时定量化疲劳裂纹监测
杜朝亮1, 2,王奕首2, 3,高东岳3,刘科海3,卿新林2
1. 北京大学 力学与空天技术系,北京 100871;
2. 中国商用飞机有限责任公司 北京民用飞机技术研究中心,北京 102211;
3. 大连理工大学 航空航天学院,大连 116024
摘 要:由于受循环载荷及长期极端环境的作用,飞机的金属结构常会产生疲劳裂纹,进而对飞机结构造成严重破坏。疲劳裂纹的位置和尺寸定量化监测对于飞机制造商以及飞机维护人员具有十分重要的意义,因为它可以大幅度地提高飞机结构的安全性和可靠性,并降低飞机的维护成本。近年来,在疲劳裂纹的大致位置监测方面国内外的研究人员已经取得了较大的进展。但是疲劳裂纹的尺寸监测仍是一个具有挑战性的问题。发展了最快衍射波时差法来定量化监测疲劳裂纹的尺寸。最快衍射波时差法用一个粘接在结构表面的传感器网络激励和接收超声波信号,当超声波经过裂纹尖端时会产生衍射波,然后通过所提出的先进算法分析接收到的衍射波信号就可以获得裂纹的位置和尺寸等信息。结果表明,用最快衍射波时差法获得的裂纹尺寸与裂纹的真实尺寸非常接近。
关键词:结构健康监测;疲劳裂纹;衍射波;裂纹尺寸定量化
(Edited by LONG Huai-zhong)
Foundation item: Project (2012AA040209) supported by the High-Tech Research and Development Program of China; Project (11172053) supported by the National Natural Science Foundation of China; Project (12R21421900) supported by Shanghai Postdoctoral Scientific Program, China
Corresponding author: QING Xin-lin; Tel: +86-10-57808828; E-mail: qingxinlin@comac.cc
DOI: 10.1016/S1003-6326(11)61517-3

