Trans. Nonferrous Met. Soc. China 29(2019) 579-587
Assessment of gas tungsten arc welding thermal cycles on Inconel 718 alloy
M. HERNANDEZ1, R. R. AMBRIZ1, R. CORTES1, 2, C. M. GOMORA1, G. PLASCENCIA1, D. JARAMILLO1
1. Instituto PolitEcnico Nacional CIITEC-IPN, Cerrada de Cecati S/N Col. Sta. Catarina, Azcapotzalco, Ciudad de MExico, C. P. 02250, MExico;
2. Instituto de InvestigaciOn en Metalurgia y Materiales, Universidad Michoacana de San NicolAs de Hidalgo, A. P. 888, C. P. 58000, Morelia MichoacAn, MExico
Received 13 April 2018; accepted 30 October 2018
Abstract: Heat moving source models along with transient heat analysis by finite element method were used to determine weld thermal cycles and isothermal sections obtained from the application of a gas tungsten arc welding beads on Inconel 718 plates. Analytical (Rosenthal��s thick plate model) and finite element results show an acceptable approximation with the experimental weld thermal cycles. The isothermal sections determined by numerical simulation show a better approximation with the experimental welding profile for double-ellipse model heat distribution than Gauss model. To analyze the microstructural transformation produced by different cooling rates in the fusion and heat affected zones, Vickers microhardness measurements (profile and mapping representation) were conducted. A hardness decrement for the heat affected zone (~200 HV0.2) and fusion zone (~240 HV0.2) in comparison with base material (~350 HV0.2) was observed. This behavior has been attributed to the heterogeneous solubilization process of the �á� phase (nickel matrix), which, according to the continuous-cooling-transformation curve, produced the Laves phase, �� and MC transition phases, generating a loss in hardness close to the fusion zone.
Key words: Inconel 718; gas tungsten arc welding (GTAW); weld thermal cycle; finite element method; heat moving source
1 Introduction
Inconel 718 is a precipitation-hardened nickel-base superalloy. This material is used in a wide variety of applications due to its excellent mechanical properties at cryogenic and high temperatures, as well as corrosion resistance in aggressive environments.
The high resistance of Inconel 718 (ultimate tensile strength of 1.1 GPa [1]) is obtained by the presence of fine hard and dispersed precipitates (�á� and �á�) [1]. However, due to the weld thermal cycles generated by the welding process, some welding problems related to loss of hardness in the heat affected zone (HAZ), hot cracking in the fusion zone (FZ), and liquation cracking [2,3] in the HAZ can be presented.
The high temperature developed by the heat source induces significant metallurgical changes, including segregation of Nb, Ti and Mo that leads to the formation of thermodynamically and structurally stable phases like NbC, TiNi and Laves phases [4,5]. On this context, it is essential to analyze the welding thermal cycles determined experimentally as well as by numerical and analytical models to correlate them with the continuous- cooling-transformation diagram (CCT).
The basic theory of heat flow developed by Fourier and applied to heat moving sources by ROSENTHAL [6] is still the most popular analytical method for calculating the temperature distribution in welds, as has been shown in Refs. [7-11].
ROSENTHAL��s model does not provide an adequate approximation for the temperature distribution within the fusion zone. In addition, this model considers that the welded material properties remain constant as it solidifies; this increases the departure of analytical predictions from the temperature field measured, especially in the vicinity of the fusion zone [12]. To overcome these limitations, some authors have used the finite element method (FEM) to analyze the heat transfer in welds [8,13-18]. In some studies, the heat flux in the welding direction is ignored [19-22]. In such cases, the surface Gaussian heat source model is generally used for thin plates, where the heat flux distribution along the thickness is not important. In this sense, FREITAS et al [23] and GERY et al [24] have revealed the shortcomings of that model on the shape of FZ and HAZ. Heat distribution is influenced by the behavior of the heat flux as a function of the thickness increment. The welding bead width tends to decrease as function of its penetration on the plate, because of the increase in the rate of heat dissipation. This aspect also contributes to reaching the peak temperature in FZ, which consequently affects the transient temperature distribution in the welded plate. To solve this issue, GOLDAK et al [12] considered the weld heat source as a double ellipse geometry that moves along the welding direction. Some researchers have shown that by applying this model, their results are closer to the experimental measurements [17,24,25]. For instance, LUNDBACK et al [25] found that the size of the FZ simulated is in very good agreement with the experimental measurements, due to the calibration of the dimensional parameters of GOLDAK��s model.
This work is focused on determining the welding thermal cycles and isothermal sections produced by a welding bead deposit on plates of Inconel 718 alloy, as well as its correlation with the microstructural transformation according to its corresponding CCT diagram.
2 Methodology
2.1 Materials and welding
IN718 plates of 152 mm��150 mm��7.29 mm were used. The chemical composition (mass fraction, %) of the material determined by optical emission spectroscopy (OES) is as follows: 0.05 C, 18.3 Cr, 19.34 Fe, 0.08 Mn, 52.7 Ni, 2.9 Mo, 1.03 Ti, 0.58 Al, 5.02 Nb and balanced Ni.
Before welding, the plates were precipitation- hardened, which is the typical condition to use the IN718 alloy. The plates were heat-treated by solubilization at 1065 ��C for 1 h, aged at 720 ��C for 8 h, and finally furnace cooling [1].
A semiautomatic gas tungsten arc welding (GTAW) process was used to deposit the welding beads on the IN718 plates. A mixture of 2% H2, 0.12% CO2, 30% He and 67.88% Ar (volume fraction) was used as shielding gas at a flow rate of 0.0165 m3/s. Alternating current (tungsten-thorium electrode) was used in conjunction with the following welding parameters: voltage V=29 V, current I=356 A, and travel speed v=4 mm/s. According to the voltage, welding current, and thermal efficiency �� (60%) of the GTAW process [26], the heat input provided during welding was Q=1549 J/mm.
Vickers microhardness measurements were taken to observe the heat input effect generated by the welding process on the microstructural transformation. The indentations were performed on the transverse welding profile by using a load of 0.2 kg and dwell time of 15 s. The results were present in a microhardness profile, as well as in a mapping representation.
The weld thermal cycles were obtained by using K type thermocouples, which were placed in direct contact to the surface of the plate at a distance of x=75.0 mm and y=7.7 mm (1), x=78.0 mm and y=10.0 mm (2), x=81.0 mm and y=10.5 mm (3), and x=84.0 mm and y= 13.0 mm (4), from the coordinate system shown in Fig. 1. The temperature signal was acquired with a data acquisition board (NI 9213) coupled directly to each thermocouple. The signal was acquired by using a LabVIEW program connected to a personal computer, at a frequency of 70 Hz.
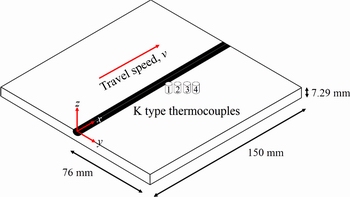
Fig. 1 Thermocouples location for temperature measurements
2.2 Analytical weld thermal cycles
The temperature field distribution generated by a welding process is approximated by a heat conduction problem in a homogeneous solid. The governing equation for a three-dimensional heat conduction is
 (1)
(1)
where T is the temperature; t is the time; x, y and z and the heat flow directions. The thermal diffusivity �� is a function of thermal conductivity k, density ��, and heat capacity C, given by the following equation:
 (2)
(2)
A simplified ROSENTHAL [6] thin plate model considers a heat source with a constant travel speed v. This model considers that the heat distribution consists of a semi-infinite isotropic body with an initial temperature T0, where the heat source melts the thickness of the material and heat is dissipated in two directions. Also, the thermophysical properties are considered as constants (no dependency of the temperature). The heat lost by radiation and convection is not considered. The simplified ROSENTHAL model to determine the weld thermal cycles in two dimensions is given by the following equation [27]:
 (3)
(3)
where Q/v is the heat flux (J/m), d the thickness of the plate (m), and r the radial distance (m).
The size and morphology of the analytical isotherms were determined by dimensionless equations [28], i.e., operation parameter n5, temperature parameter �� and thickness parameter ��. Additionally, dimensionless coordinates, ��(x) and ��(y), as well as dimensionless vector radio, ��5(r), were used [28]:
 (4)
(4)
 (5)
(5)
 (6)
(6)
 (7)
(7)
 (8)
(8)
 (9)
(9)
These dimensionless parameters in pseudo-steady state condition can be represented graphically, as shown in Fig. 2.

Fig. 2 Schematic representation of weld isotherm sections adapted from Ref. [28]
On the other hand, the simplified ROSENTHAL [6] thick plate model consists of an isotropic semi-infinite body at initial temperature limited in one direction by a plane that is impermeable to heat. At time t=0, a point source of constant power Q is released on the surface at a constant speed v. As for the thin plate, the thick plate solution considers that thermophysical properties remain constant and the heat lost by radiation and convection is not considered. The simplified ROSENTHAL model to determine the weld thermal cycles in three dimensions is given by the following equation [27]:
 (10)
(10)
The size and morphology of the analytical isotherms for a thick plate are determined in dimensionless form, i.e., operation parameter n3 and temperature parameter ��. Additionally, dimensionless coordinates ��(x), ��(y) and ��(z), as well as dimensionless vector radio, ��3(R), were used [28]:
 (11)
(11)
 (12)
(12)
 (13)
(13)
These dimensionless parameters in pseudo-steady state condition can be represented in Fig. 3.

Fig. 3 Schematic representation of weld isotherms sections, adapted from [28]
2.3 Finite element weld thermal cycles
Considering the heat generated during the welding, a finite element analysis was carried out by using ANSYS APDL 17.0 to determine the weld thermal cycles and the isothermal contours produced by the heat moving source. A three-dimensional thermal transient analysis was used. Considering that the heat input during the welding process produces a homogenous heat distribution (symmetry conditions), only one half of the model was considered (Fig. 4).
The geometrical model was meshed by using hexahedral solid elements (SOLID 278) with only one degree of freedom by node (temperature). To obtain a better accuracy of the temperature distribution in FZ and HAZ, a mesh refinement (81000 elements and 624000 nodes) was used (Fig. 4). A fine mesh with an average edge dimension of 0.5 mm (30000 elements and 240000 nodes), a medium mesh with an average edge dimension of 1.5 mm (30000 elements and 228000 nodes) and a coarse mesh with an average edge dimension of 8 mm (21000 elements and 156000 nodes) were used. The thermophysical properties used in the numerical simulation are given in Table 1 [29].
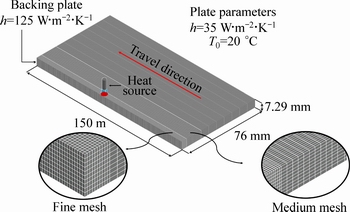
Fig. 4 Three-dimensional mesh used for transient thermal analysis
Table 1 Thermophysical properties for Inconel 718 alloy [29]

The heat input supplied by the welding process (6194 W) was applied considering the Gaussian distribution, as well as double ellipse models. In the case of the Gaussian model, the heat distribution was computed by the following equation:
 (14)
(14)
where q is the heat flux, Q the heat input, a the effective radius of the heat source and r the radial distance to the point where it is required to determine the heat flux [26].
On the other hand, the power distribution produced by the two-dimensional double ellipse model proposed by GOLDAK et al [12] was used. A schematic representation of this model is shown in Fig. 5.

Fig. 5 Double ellipse heat source configuration
Considering the geometry of the welding pool (Fig. 5), the heat distribution of the front and rear ellipse was determined by the following expressions:
 (for front ellipse) (15)
 (for rear ellipse) (16)
Generally, the front temperature gradient (ff) is shorter than the rear half (fr). Hence, the heat power density in the rear and front ellipses is represented by the fractions ff and fr of heat deposited, given by
 (17)
(17)
From experimental measurements [12,25], the following values for ar=2.8 mm, af=1.2 mm, b=4 mm, ff=0.4 and fr=1.6 were found.
Figure 6 shows the surface heat distribution for Gauss and double ellipse models used to determine the concentration of heat in each area of the surface of the simulation model.
For the simulation, the initial room temperature of the plates to be welded was considered to be 20 ��C. Considering a laminar flow, a convective coefficient of 35 W/(m2��K) was used, and this value is consistent with previous values reported [30].
3 Results and discussion
3.1 Macro- and micro-structural characteristics
A macrograph of the welding profile is shown in Fig. 7(a). In this figure, the FZ, HAZ, base material (BM) are clearly identified. It is observed that the Gaussian representation (Fig. 7(b)) is not as well-suited as the double ellipse approach (Fig. 7(c)) to accurately predict the experimentally obtained (Fig. 7(a)) pool geometry.

Fig. 6 Heat distribution
To improve the predictions of the double ellipse model, it is necessary to have a good estimation of the heat transfer coefficient involved in the convective cooling between the welded plate and the backing one. Also, the model does not involve the heat release during the solidification transformation. On this context, many authors are working on a numerical model to consider the fusion-solidification phenomenon to obtain a better approximation of the FZ geometry. However, an acceptable approximation was observed between the experimental and numerical simulation for the HAZ temperature. The HAZ limit was observed at approximately 650 ��C (Fig. 7), which is in the temperature range to obtain the �á� phase coarsening.
Figure 8 shows the microstructural characteristics of the welding bead deposit (rectangle marked in Fig. 7(a)). From Fig. 8, it is possible to observe the partially melted grains, which produce the traditional epitaxial grain growth, as well as competitive columnar dendritic structure in the fusion zone. Additionally, the liquation phenomenon in the grains of the HAZ is observed, which can be sites for nucleation and propagation of cracks. In this sense, NAFFAKH et al [2] showed that the liquation phenomenon takes place in the intergranular boundaries in the HAZ of the Inconel 718. �á�-Ni3Nb, ��-Ni3Nb precipitations and Nb-rich intermetallics (MC) form liquated regions by the constitutional liquation mechanism.

Fig. 7 Welding profile geometry of Inconel 718 plate (a), transverse isothermal sections (Gauss model heat distribution) (b) and transverse isothermal sections (double-ellipse model heat distribution) (c)

Fig. 8 Microstructure characteristics of welding bead deposit on plates of Inconel 718 alloy
3.2 Microhardness
The heat input effect produced by the welding process was observed by microhardness measurements (Fig. 9). Figure 9(a) corresponds to the hardness profile, whereas the mapping representation is shown in Fig. 9(b).
From Fig. 9(a), it is possible to identify the different zones (FZ, HAZ and BM) of the transverse section produced by the welding process for Inconel 718 plate. The width of the FZ is approximately 15 mm, whereas that of the HAZ is close to 2.5 mm from the fusion interface.
It can be clearly observed in Figs. 9(a) and (b) that, an important hardness decrement in the FZ (~240 HV0.2), as well as in the HAZ (~200 HV0.2) was obtained in comparison with that in the BM (~350 HV0.2). In the case of the FZ, the tendency to increase the hardness with respect to the HAZ, is mainly produced by the solid solution hardening promoted by Ni and Nb contents, which have a similar molar ratio with respect to the nickel matrix [31]. In contrast, the hardness decrement in the HAZ is produced by the heterogeneous solubilization process of the �á� phase in the nickel matrix, as well as by the presence of �� phase precipitates [4].

Fig. 9 Hardness distribution obtained for welding profile shown in Fig. 7(a)
To analyze the microstructural transformation in the HAZ, the hardness results, the temperature distribution as well as the weld thermal cycles were taken into account. As can be observed, the welding bead geometry obtained numerically (Figs. 7(b) and (c)) provides a reasonable approximation with the experimental welding macrograph (Fig. 7(a)), i.e., the fusion limit was localized approximately at 7.5 mm from the center of the welding bead, which is in good agreement with the width determined by microhardness measurements (Fig. 9(a)). This distance was taken as the effective radius a of the heat source, which in turn was used to determine the Gauss and double ellipse heat distribution parameters for the finite element analysis.
3.3 Weld thermal cycles
The experimental and numerical welding transverse sections were analyzed at a distance of approximately 90 mm from the origin of heat moving source (in pseudo-steady state condition). Figure 10 shows the weld thermal cycles for different distances from the center of the welding bead determined experimentally (Fig. 10(a)), analytically (Figs. 10(b) and (c)), and numerically (Figs. 10(d) and (e)).
From Fig. 10, it is possible to observe that the weld thermal cycles determined by the thin plate model (Fig. 10(b)) do not have a good accuracy with respect of the experimental results (Fig. 10(a)). An evident discrepancy with the peak temperatures (Table 2) and cooling rates with respect to experimental results is observed.
This can be explained taking into account that the heat source for the ROSENTHAL��s thin plate model considers the total fusion of the thickness, and subsequently the heat is transferred by conduction within the base metal (heat conduction in two dimensions). In contrast, ROSENTHAL��s thick plate model assumes that the heat source partially melts the thickness of the material (Fig. 7(a)), producing heat conduction in three dimensions. Thus, as can be seen, the peak temperatures (Table 2), as well as the weld thermal cycles (Figs. 10(a) and (c)) exhibit a very good approximation with the experimental results. Contrarily, the thin plate model does not offer a good approximation, i.e., the peak temperature is higher than that obtained for thick plate model.
The results reported in Table 2 allow determining the maximum weld temperature up to 13.0 mm from the weld center. The data in Table 2 indicate that within 10.5 mm from the center of the weld, the plate in every case reaches temperature values higher than 675 ��C, which indicates imminent microstructural transformation in the HAZ and consequently an important decrement in hardness. For instance, the peak temperature for the thermocouple localized at 7.7 mm reached ~1452 ��C, which is higher than the solubilization temperature reported for this alloy (~1010 ��C) [4,31,32]. Then, considering the non-equilibrium cooling rate during the welding, a local microstructural transformation could be expected for the HAZ. This can be deduced considering that the microstructural changes in the HAZ are due to the transformation of �á� to �á� precipitates, as well as the �� phase formation (Ni3Nb orthorhombic) at temperatures higher than 675 ��C, producing an important strength reduction [4].
3.4 Microstructural transformation
The microstructural transformations for Inconel 718 alloy can be observed in the continuous-cooling- transformation curve (C-curve) shown in Fig. 11 [32]. To analyze the microstructural change of the �á� precipitates generated by the welding process, the experimental cooling rates determined from weld thermal cycles were correlated whit the C-curve [31]. According to Fig. 11, it is possible to observe that the cooling rate at 7.7 mm traverses the C-curve, forming the Laves, �� and MC transition phases. Additionally, it can be observed that approximately at 11 mm the cooling rates are close to the nose of the C-curve, which indicates the final transition of �á� phase. Such features correspond to the results found in a recent publication by the authors [1].
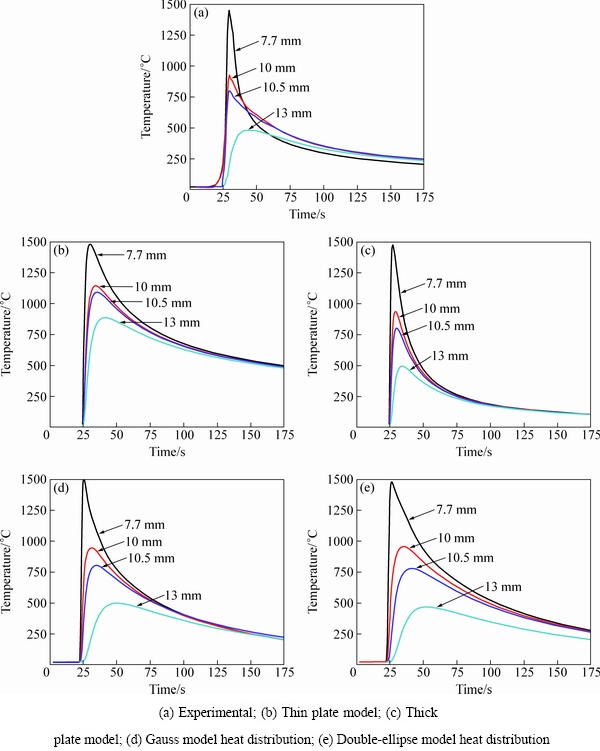
Fig. 10 Weld thermal cycles for different distances from center of welding bead
Table 2 Peak temperatures obtained from weld thermal cycles

Finally, a comparison between analytical and double ellipse model isotherms was performed. As seen in Fig. 12, the width of the analytical and simulated isotherms presented a good approximation; however, a discrepancy with respect to length has been found. This shortcoming can be attributed to the fact that traditional analytical models do not consider the heat transfer conduction generated during the heat source displacement, i.e., pseudo-state condition. In contrast, the finite element model considers the transient heat conduction during the welding (conduction effect by previous position of the heat source), as well as the convective effect, producing an important difference in the length of the welding isotherms.

Fig. 11 Correlation between continuous-cooling- transformation diagram for Inconel 718 alloy [32] and different cooling rates obtained from experimental weld thermal cycles

Fig. 12 Correlation between analytical and double ellipse model isotherms
4 Conclusions
(1) The weld thermal cycles determined analytically (ROSENTHAL��s thick plate model) and by finite element method present an acceptable approximation with the experimental results. The temperatures obtained by using the double ellipse model heat distribution offer a better representation than those computed with Gauss model.
(2) According to the macrostructural characteristics of the welding profile, it was possible to determine a close approximation of the fusion and heat affected zones by means of microhardness measurements (profile and mapping representation). From the center of the welding bead, it was observed that the fusion zone limit is located approximately at 7.5 mm, whereas the width of the heat affected zone is roughly 10.3 mm.
(3) Microhardness behavior as well as the cooling rate conditions allows observing a microstructural transformation of �á� and �á� phases in the HAZ.
(4) The existence of Laves, �� and MC phases in the heat affected zone was confirmed by the continuous- cooling-transformation diagram by using experimental cooling rates.
Acknowledgments
M. HERNANDEZ thanks CONACyT-MExico for the scholarship provided. CONACyT (Project 736) and SIP-IPN are also acknowledged for funds given to conduct this research.
References
[1] CORTES R, BARRAGAN E R, LOPEZ V H, AMBRIZ R R, JARAMILLO D. Mechanical properties of Inconel 718 performed by gas tungsten arc welding [J]. International Journal of Advanced Manufacturing Technology, 2017, 94: 3949-3961.
[2] NAFFAKH H, ABOUTALEBI M R, SEYEDEIN S H, MAPELLI C. Microstructural, mechanical and weldability assessments of the dissimilar welds between �á�- and �á�-strengthened nickel-base superalloys [J]. Materials Characterization, 2013, 8: 41-49.
[3] TAHERI N, NAFFAKH H, MALEY M. A new procedure for refurbishment of power plant Superalloy 617 by pulsed Nd:YAG laser process [J]. Optics & Laser Technology, 2017, 91: 71-79.
[4] DUPONT N J, LIPPOLD C J, KISER D S. Welding metallurgy and weldability of nickel based alloys [M]. New Jersey: John Wiley & Sons, Inc., 2009.
[5] RADAVICH J F. The physical metallurgy of cast and wrought alloy 718 [C]//Superalloys 718 Metallurgy and Applications (1989). Pennsylvania, USA, 2004: 229-240.
[6] ROSENTHAL D. The theory of moving sources of heat and its application to metal treatments [J]. Transactions of the American Society of Mechanical Engineers, 1946, 68: 849-866.
[7] MYERS P S, UYEHARA O A, BORMAN G L. Fundamentals of heat flow in welding [J]. Welding Research Council Bulletin, 1967, 123: 1-46.
[8] FRIEDMAN E. Thermomechanical analysis of the welding process using the finite element method [J]. Journal of Pressure Vessel Technology, 1975, 97: 206-213.
[9] SHARIR Y, GRILL A, PELLEG J. Computation of temperatures in thin tantalum sheet welding [J]. Metallurgical Transactions B, 1980, 11: 257-265.
[10] KOU S. Simulation of heat flow during the welding of thin plates [J]. Metallurgical Transactions A, 1981, 12: 2025-2030.
[11] KOU S, KANEVSKY T, FYFITCH S. Welding thin plates of aluminum alloys-A quantitative heat-flow analysis [J]. Welding Journal, 1982, 61: 175-181.
[12] GOLDAK J, CHAKRAVARTI A, BIBBY M. A new finite element model for welding heat sources [J]. Metallurgical Transactions B, 1984, 15: 299-305.
[13] PAPAZOGLOU V J, MASUBUCHI K. Numerical analysis of thermal stresses during welding including phase transformation effects [J]. Journal of Pressure Vessel Technology, 1982, 104: 198-203.
[14] FREE J A, PORTER-GOFF R. Predicting residual stresses in multi-pass weldments with the finite element method [J]. Computers and Structures, 1989, 32: 365-378.
[15] JOSEFSON B L. Prediction of residual stresses and distortions in welded structures [J]. Journal of Offshore Mechanics and Arctic Engineering, 1993, 115: 52�C57.
[16] BRICKSTAD B, JOSEFSON B L. A parametric study of residual stresses in multi-pass butt-welded stainless steel pipes [J]. International Journal of Pressure Vessels and Piping, 1998, 75: 11-25.
[17] ANCA A, CARDONA A, RISSO J, FACHINOTTI V D. Finite element modeling of welding processes [J]. Applied Mathematical Modelling, 2011, 35: 688-707.
[18] GOMORA C M, AMBRIZ R R, CURIEL F F, JARAMILLO D. Heat distribution in welds of a 6061-T6 aluminum alloy obtained by modified indirect electric arc [J]. Journal of Materials Processing Technology, 2017, 243: 433-441.
[19] EAGAR T W, TSAI N S. Temperature fields produced by traveling distributed heat sources [J]. Welding Journal, 1983, 62: 346-355.
[20] CHO S, KIM J. Analysis of residual stress in carbon steel weldment incorporating phase transformations [J]. Welding Journal, 2002, 7: 212-216.
[21] DENG D, MURAKAWA H, LIANG W. Numerical simulation of welding distortion in large structures [J]. Computer Methods in Applied Mechanics and Engineering, 2007, 196: 4613-4627.
[22] RAYAMYAKI P, KARKHIN V A, KHOMICH P N. Determination of the main characteristics of the temperature field for the evaluation of the type of solidification of weld metal in fusion welding [J]. Welding International, 2007, 21: 600-604.
[23] de FREITAS P R, de ARAUJO D B, da CUNHA A B. Study of the Gaussian distribution heat source model applied to numerical thermal simulations of tig welding processes [J]. Ciencia y Engenharia/ Science and Engineering Journal, 2014, 23: 115-122.
[24] GERY D, LONG H, MAROPOULOS P. Effects of welding speed, energy input and heat source distribution on temperature variations in butt joint welding [J]. Journal of Materials Processing Technology, 2005, 167: 393-401.
[25] LUNDBACK A, ALBERG H, HENRIKSON P. Simulation and validation of TIG-welding and post weld heat treatment of an Inconel 718 plate [J]. Mathematical Modelling of Weld Phenomena, 2005, 5: 683-696.
[26] KOU S. Welding metallurgy [M]. 2nd ed. New Jersey: John Wiley & Sons, Inc., 2003.
[27] EASTERLING K. Introduction to the Physical Metallurgy of Welding [M]. 2nd ed. Great Britain: Elsevier Science, 2013.
[28] GRONG O. Metallurgical modelling of welding [M]. 2nd ed. Cambridge: Institute of Materials, 1997.
[29] MILLS K C. Recommended values of thermophysical properties for selected commercial alloys [M]. Cambridge: Woodhead, 2002.
[30] DYE D, HUNZIKER O, ROBERTS S, REED R. Modeling of the mechanical effects induced by the tungsten inert-gas welding of the IN718 superalloy [J]. Metallurgical and Materials Transactions A, 2001, 32: 1713-1725.
[31] DAVIS J R. Nickel, cobalt, and their alloys [M]. The United States of America: ASM International, 2000.
[32] GEORGE F, VANDER VOORT G F. Atlas of time-temperature diagrams for nonferrous alloys [M]. The United States of America: ASM International, 1991.
Inconel 718�Ͻ��ټ��������屣��������ѭ��
M. HERNANDEZ1, R. R. AMBRIZ1, R. CORTES1, 2, C. M. GOMORA1, G. PLASCENCIA1, D. JARAMILLO1
1. Instituto PolitEcnico Nacional CIITEC-IPN, Cerrada de Cecati S/N Col. Sta. Catarina, Azcapotzalco, Ciudad de MExico, C. P. 02250, MExico;
2. Instituto de InvestigaciOn en Metalurgia y Materiales, Universidad Michoacana de San NicolAs de Hidalgo, A. P. 888, C. P. 58000, Morelia MichoacAn, MExico
ժ Ҫ�������ȶ�Դģ�ͺ�˲̬�ȷ������ϣ�������������Ԫ������ȷ����Inconel 718�Ͻ����Ӧ���ټ��������屣������õĺ�����ѭ���͵��½��档Rosenthal���ģ�ͺ�����Ԫ���������ʾ��������ѭ����ʵ��ֵ���������ʵ��������ȣ���˫��Բģ���ȷֲ���ֵģ��ȷ���ĵ��½��������Ч�����ڸ�˹ģ�͡�Ϊ�˷�����ͬ��ȴ����������������Ӱ��������֯��ת�䣬����ά����Ӳ�Ȳ���(�ɺ����Ӳ�ȷֲ����ߺ��ݽ���Ӳ�ȷֲ�ӳ��ͼ��ʾ)���������ϵ���Ӳ��(~350 HV0.2)��ȣ���Ӱ����(~200 HV0.2)��������(~240 HV0.2)����Ӳ�Ƚ��ͣ��������ڸ���������ȴת�����ߣ��á���(������)�IJ������ܽ��������Laves�ࡢ����ͽ����仯��������࣬ʹ��������Ӳ��ֵ���͡�
�ؼ��ʣ�Inconel 718�Ͻ��ټ��������屣����(GTAW)��������ѭ��������Ԫ�������ȶ�Դ
(Edited by Xiang-qun LI)
Corresponding author: R. R. AMBRIZ; E-mail: rrambriz@ipn.mx
DOI: 10.1016/S1003-6326(19)64966-6

