J. Cent. South Univ. Technol. (2008) 15: 639-644
DOI: 10.1007/s11771-008-0119-3

Cavity 3D modeling and correlative techniques based on cavity monitoring
LUO Zhou-quan(罗周全), LIU Xiao-ming(刘晓明),
ZHANG Bao(张 保), LU Hao(鹿 浩), LI Chang(李 畅)
(School of Resources and Safety Engineering, Central South University, Changsha 410083, China)
Abstract: According to the mining method for Dongguashan Copper Mine and Tongkeng Mine in China, and with the help of the cavity monitoring system(CMS) and mining software Surpac, the 3D cavity models were established exactly. A series of correlative techniques for calculating stope over-excavation and under-excavation, stope dilution and ore loss rates, and the blasting design of the pillar with complicated irregular boundaries were developed. These techniques were applied in Dongguashan Copper Mine and Tongkeng Mine successfully. Using these techniques, the dilution rates of stopes 52-2#, 52-6#, 52-8# and 52-10# of Dongguashan Copper Mine are calculated to be 2.12%, 8.46%, 12.67% and 10.68%, respectively, and the ore loss rates of stopes 52-6# and 52-8# are 4.41% and 3.70%, severally. Furthermore, according to the design accomplished by the technique for a pillar of Tongkeng Mine with irregular boundary, the volume, total length of boreholes and the dynamite quantity of the pillar are computed to be 1.2×10⁴ m3, 2.98 km and 10.97 t, correspondingly.
Key words: cavity 3D modeling; cavity monitoring system; stope; dilution; loss rate; pillar blasting
1 Introduction
A great number of cavities due to underground mining cause deterioration in mining condition. These mined-out cavities induce pillar deformation and breakage, and increase difficulties in supporting adjacent stope and laneways. Sometimes, they may cause large-scale roof falling, rock moving and even collapse to ground surface. In some cases, they result in heavy casualties and severe equipment damage[1]. Cavities have become one of the main hazard sources that endanger the safety of mines directly.
However, in the past, there was no effective monitoring method to determine the actual shape, volume and boundaries of cavities in domestic mines, especially when the cavities were not accessible. Some domestic scholars studied the exploration of cavity by the methods of transient electromagnetism and ground penetrating radar, but unfortunately, these ways cannot obtain exact cavity information because of the low distinguishability[2-3]. Due to the lack of accurate cavity information, mining dilution and loss control, safety assessment, disaster prediction and so forth cannot be accomplished. Cavity monitoring system(CMS) is based on laser and can be used to monitor the cavity in underground mines with satisfactory accuracy. It has become one of the main means for monitoring cavities or
underground stopes in the North America[4-5]. LIU et al[6], LI et al[7], HUBER and VANDAPEL[8] used the method of laser 3D in underground mines to detect cavities and analyze the stability of cavities. In this work, cavity 3D modeling and correlative techniques using CMS and software Surpac were presented and correlative applications were demonstrated.
2 Cavity monitoring
2.1 CMS operating principle and method
The CMS consists of scanning laser head, control box, handhold controller, mechanical supports and data processing software. The operating principle of CMS is shown in Fig.1. The monitoring method of CMS is as follows: 1) install CMS and initialize; 2) level the scanning head; 3) set scan parameter including the name of project, the scope and accuracy of scanning and so forth; 4) scan and transmit data into a control box in wire way, and then send the data of control box to the handhold controller automatically in wireless way at the same time; 5) the scanning head rotates again at its new elevation after completing a circle scan; 6) download the data from the handhold controller to computer and perform on data processing, calculation and sketch, document output and so on[4].
2.2 Primitive data pretreatment
The primitive monitoring data gained by CMS is a
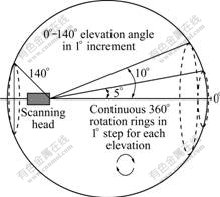
Fig.1 CMS operating principle
“.txt” format file, which records the angle and distance. This file should be transformed into “.dxf” format file using the pretreating software CMSPos- Process of CMS before it can be used to create cavity 3D entity model by the third-party software Surpac.
3 Cavity 3D modeling
Cavity 3D mesh model can be created by CAD or CMS processing software Qvol using the monitoring data file. But this kind of mesh model has low visualization and weak edition ability. The model with much higher extent visualization and much better editable capability can be established using Surpac software[9-14].
The steps of the method of cavity 3D modeling using Surpac software are as follows: 1) use Surpac data input interface to change the primary “.dxf” format file into the entity model file with “.DTM” format; 2) verify the DTM model; 3) if the DTM model has mistake, go to step 4), otherwise go to step 5); 4) transform and handle the primitive monitoring data again, then return to step 1); 5) edit the DTM model with Surpac software (usually adopt entity model Boolean operation method to cut the laneway that lies beside the cavity); 6) verify the validity of the DTM model again. If the model has mistake, return to step 5), otherwise the cavity 3D model is established successfully. Fig.2 shows 3D models of four cavities of Dongguashan Copper Mine.

Fig.2 Cavity 3D models of Dongguashan Copper Mine
4 Correlative techniques based on cavity model
4.1 Calculation of cavity volume and creation of section plane
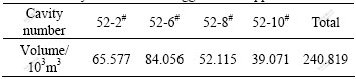
The method of calculating cavity volume with Surpac is as follows: 1) open a cavity DTM model in Surpac; 2) verify the model and modify the model if it has mistake; 3) if no error exists, calculate the volume of cavity. The calculation results of the above four cavities in Dongguashan Copper Mine are listed in Table 1.
Table 1 Cavity volumes of Dongguashan Copper Mine
The cavity model can be cut along any direction and create a series of cavity section planes. These section planes can be edited and output in “.dxf” format files with Surpac software, and mining engineers can use them to aid design work. Cutting the model along axis needs to determine the coordinates of the start point and the end point first. The distance between two sections has to be defined before creating a series of parallel section planes. However, if cutting the model through any two points that are not on the same axis, only one section plane can be obtained.
4.2 Stope boundaries contrast and calculation of over- excavation or under-excavation
4.2.1 Stope boundary contrast
In order to understand the difference between the design boundary and the monitoring boundary of a stope, a stope primary design model was built and compared with the monitoring cavity model. The result is shown in Fig.3. The discrepancy between the actual boundary and the design boundary of the stope is obvious.
The following conclusions can be gained via boundary contrast between the design stope and the monitoring cavity model of Dongguashan Copper Mine.
1) Each stope has over-excavation, especially stope 52-6#, and the maximum over-excavation thickness is 6 m.
2) Under-excavation is less than over-excavation in each stope, and the under-excavation phenomenon of stope 52-6# is relatively obvious.
3) Each stope has roof collapse, and the height of roof collapse of stope 52-10# is more than 10 m.
4.2.2 Calculation of over-excavation and under- excavation volume
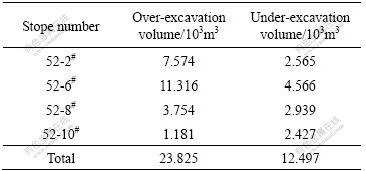
Using the stope primary design model and the monitoring cavity model, the volume of over-excavation and under-excavation for each stope is calculated via Boolean operation in Surpac. The results are listed in Table 2.
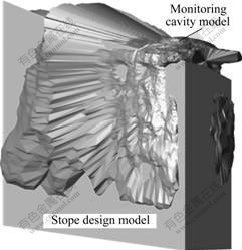
Fig.3 Boundary comparison between design stope and monitoring cavity model
Table 2 Volume calculation results of over-excavation and under-excavation
4.3 Volume calculation of ore remains within stope cavity
By coupling the monitoring cavity model, stope primary design model and stope bottom structure model, a new composite model is formed and shown in Fig.4(a). Cutting the model to get a section plane shown in Fig.4(b), it can be perceived apparently that there are ore remains within the stope. Using the composite model, the volume of the ore remains within stope can be calculated for each stope, and the results are listed in Table 3.
4.4 Accurate calculation of ore dilution rate and loss rate
The traditional calculation cannot get the accurate dilution rate and loss rate of the stope. However, using the cavity 3D model, the stope primary design model and Boolean operation method can calculate the volume of over-excavation waste, under-excavation ore and the ore remains within the stope. On the basis of this, the ore dilution rate and the loss rate of the stope can be acquired exactly[15-17]. The accurate calculation methods of ore dilution rate and loss rate are shown in Figs.5 and 6, respectively.
The calculation results of the dilution rate of stopes 52-2#, 52-6#, 52-8# and 52-10# are shown in Table 4, and the loss rates of stopes 52-6# and 52-8# are shown in Table 5, indicating that the calculated results accord with the actual ones.
4.5 Blasting design of pillar with irregular boundary
Usually, the cavity boundary is not in accordance with the design boundary because of the factors such

Fig.4 Composite model of stope design model, cavity model and bottom structure model (a) and section of composite model (b)
Table 3 Volumes of ore remains within each stope in Dongguashan Copper Mine


Fig.5 Accurate calculation method of ore dilution rate

Fig.6 Accurate calculation method of ore loss rate
Table 4 Calculation results of ore dilution rate

Table 5 Calculation results of ore loss rate

as improper drill holes, inaccurate blasting parameters, and so forth [5]. Mining the pillar according to the initial design boundary of the pillar will result in the increase of dilution rate and even dangerous circumstance. Therefore, creating a pillar 3D model based on the stope monitoring model can obtain the actual boundary of the pillar, which will provide a reliable design basis for pillar mining. Fig.7 shows the blasting design process of the pillar with irregular boundary using Surpac based on the monitoring cavity model.

Fig.7 Blasting design method of pillar with irregular boundary using Surpac software
The blasting design for a pillar with irregular boundary of Tongkeng Mine was finished using Surpac software. One of the blasting design sections with borehole disposal is shown in Fig.8, and other correlative borehole information is shown in Table 6. The borehole information of other sections can be gained in the same way. According to the design, the volume, total length of all boreholes and the dynamite quantity of the pillar could be computed effectively, which are 1.2×10⁴ m3, 2.98 km and 10.97 t, respectively.

Fig.8 Layout of borehole in blasting design section (1-8: Borehole number)
5 Conclusions
1) With the help of the cavity monitoring system (CMS) and the mining software Surpac, the 3D cavity model of underground mines can be established exactly.
2) Based on cavity 3D model, over-excavation and under-excavation of the stope can be calculated accurately, and the dilution rate and loss rate of the stope can also be measured effectively, which can improve the mining management level of mine greatly. The dilution rate and loss rate of stopes 52-2#, 52-6#, 52-8# and 52-10# of Dongguashan Copper Mine are calculated accurately.
3) Creating pillar 3D model based on the stope cavity monitoring can obtain the actual boundary of pillar. The volume, total length of boreholes and the dynamite quantity of the pillar are calculated to be 1.2×10⁴ m3, 2.98 km and 10.97 t, respectively. The calculated results accord with the actual ones.
Table 6 Borehole information of one blasting design section

References
[1] LUO Zhou-quan, YANG Biao, LIU Xiao-ming. Research on CMS-aided blast design for ore pillar extraction [J]. Metal Mine, 2007(3): 15-17. (in Chinese)
[2] LIU Jing-hua, WANG Zhu-wen, ZHU Shi, WENG Ai-hua, XIA An-ying. The geophysical exploration about exhausted area and sinking area in coal mine [J]. Journal of China Coal Society, 2005, 30(6): 715-719. (in Chinese)
[3] LIU Dun-wen, DENG Yu, YANG Fei, XU Guo-yuan. Nonde- structivetestingfor crack of tunnel lining using GRP [J]. Journal ofCentralSouthUniversity of Technology, 2005, 12(S1): 120-124.
[4] Optech System Corporation. Cavity monitoring system wireless user manual [M]. Toronto: Optech System Corporation, 2004.
[5] GERMAIN P, HADJIGEORGIOU J. Influence of stope geometry and blasting patterns on recorded overbreak [J]. International Journal of Rock Mechanics and Mining Sciences, 1997, 34(3): 115-126.
[6] LIU Xiao-ming, LUO Zhou-quan, YANG Cheng-xiang. Analysis of stability of cavity based on cavity monitoring [J]. Rock and Soil Mechanics, 2007, 28(S): 521-526.
[7] LI Xi-bing, LI Di-yuan, ZHAO Guo-yan, ZHOU Zi-long, GONG Feng-qiang. Detecting, disposal and safety evaluation of the underground goal in metal mines [J]. Journal of Mining and Safety Engineering, 2006, 23(1): 24-29. (in Chinese)
[8] HUBER D, VANDAPEL N. Automatic 3D underground mine mapping [J]. International Journal of Robotics Research, 2005, 25(1): 7-17.
[9] LUO Zhou-quan, LIU Xiao-ming, SU Jia-hong, WU Ya-bin, LIU Wang-ping. Deposit 3D modeling and application [J]. Journal of Central South University of Technology, 2007, 14(2): 225-229.
[10] GONG Jian-ya, CHENG Peng-gen, WANG Dong-yang. Three dimensional modeling and application in geological exploration engineering [J]. Computers and Geosciences, 2004, 30(4): 391-404.
[11] HOULDING S W. Practical geostatistics modeling and spatial analysis [M]. New York: Springer-Verlag, 2000.
[12] LEMON A M, JONES N L. Building solid models from boreholes and user-defined cross-sections [J]. Computers and Geosciences, 2003, 29(3): 547-555.
[13] WU L X. Topological relations embodied in a generalized tri-prism (GTP) model for a 3D geosciences modeling system [J]. Computer and Geosciences, 2004, 30(4): 405-418.
[14] CHEN Jian-hong, ZHOU Zhi-yong, CHEN Gang, GU De-sheng. Automatic formation method of prospecting line profile map based on drill hole database [J]. Journal of Central South University of Technology: Science and Technology, 2005, 36(3): 486-491. (in Chinese)
[15] FANG Yuan-min, DENG Jin-can, MI Hong-yan. Construction and visualization of 3D vacant place model [J]. Journal of Central South University of Technology, 2005, 15(S1): 61-64.
[16] JAROSZ A P, SHEPHERD L. Open stope cavity monitoring for the control of dilution and ore loss [J]. Mining Engineering, 1998(8): 63-67.
[17] JOHN G H, HANI S M. Numerical modelling of ore dilution in blasthole stoping [J]. International Journal of Rock Mechanics and Mining Sciences, 2007, 44(5): 692-703.
(Edited by CHEN Wei-ping)
Foundation item: Projects(2007BAK22B04, 2006BAB02B05) supported by the National 11th Five-Year Science and Technology Supporting Plan of China; Project(50490274) supported by the National Natural Science Foundation of China
Received date: 2008-02-25; Accepted date: 2008-04-24
Corresponding author: LUO Zhou-quan, Professor, PhD; Tel: +86-731-2239239; E-mail: lzq505@hotmail.com

