J. Cent. South Univ. (2012) 19: 850-854
DOI: 10.1007/s11771-012-1082-6
Distribution and characterizing sources of polycyclic aromatic hydrocarbons of surface water from Jialing River
XU Xiao-yi(许晓毅)1, JIANG Zhen-yu(蒋真玉)1, WANG Ji-hang(王继行)1, ZHU Hong(朱虹)1,DOU Jun-feng(豆俊峰)2, H. D. Narres3, D. Hofmann3, E. Klumpp3
1. Key Laboratory of The Three Gorges Reservoir Region’s Eco-Environment of Ministry of Education,Chongqing University, Chongqing 400045, China;
2. College of Water Sciences, Beijing Normal University, Beijing 100875, China;
3. Forschungszentrum Jülich GmbH, Juelich 52428, Germany
? Central South University Press and Springer-Verlag Berlin Heidelberg 2012
Abstract: Sixteen priority polycyclic aromatic hydrocarbons (PAHs) in surface water samples were analyzed by gas chromatograph-mass spectrometer (GC-MS) to study their distribution and characterizing sources. The water samples were collected from five sites (J1-J5) in the Jialing River of Chongqing downtown area from September 2009 to August 2010. The results demonstrate that the concentration of total PAHs in three samples upstream are relatively higher than those in other two sites downstream, with average concentration of total PAHs for each site ranging from 811.5 ng/L to 1585.8 ng/L. The 2, 3 and 4-ring PAHs for sampling stations account for 13.0%, 56.6% and 28.6%, respectively, in total PAHs. There are obvious tendencies of seasonal change for PAHs concentration in surface water. The PAHs concentration in April of wet season is 1 301.6 ng/L, which is 1.3 times the lowest amount of total PAHs in August of flood season. Ratios of specific PAH compounds were used to characterize the possible pollution sources. Experimental results indicate that the PAHs in surface water samples are primarily from pyrolytic PAHs because of factories along these sites, while the direct leakage of petroleum products may be significant for two sites, Jiahua Bridge (J4) and Huanghuayuan Bridge (J5), because of the wharf boat nearby.
Key words: polycyclic aromatic hydrocarbons; source and distribution; surface water; Jialing River
1 Introduction
Polycyclic aromatic hydrocarbon (PAH) is a group of typical persistent organic pollutants (POPs) which can migrate from long distance through ambient media and widely retain in the environment for years [1]. PAHs are potentially mutagenic and carcinogenic substances occurring at various concentrations in atmosphere, soils, water and sediments [2-3]. Because of the bioaccumulation of ecologic food chain, PAHs may become a fierce source of contaminants to aquatic biota, and they can cause severe harms to the human health and the ecological security [4]. The main sources of PAHs may derive from human daily activities and the industry process, and the different ways of sources, transport and transformation from different types of PAH compounds provide important basis for the characteristics analysis of PAHs [5]. Nowadays, the pollution scopes and potentials of PAHs worldwide are still in a tough situation [6-8].
Jiangling River, an economically important tributary of Yangtze River, locates in the upstream of the Three Gorges Reservoir and downtown area of Chongqing municipality. It is currently the major source for drinking water supply, agricultural and industrial production for Chongqing city. The studying region in this work was once the receiving water body of chemicals, iron and steel industry etc. several years ago and now it also serves as the drainage basin for more than two millions of urban population. It is necessary to investigate the concentration of PAHs of Jialing River for future planning of urbanization and protection of water quality.
To our knowledge, the characteristics of PAHs distribution and apportionment in upstream of Three Gorges Reservoir have only been scarcely reported up to now [9-11]. The purpose of this work aims at presenting investigation of the 16 priority PAHs provided by Environmental Protection Agency (EPA) in surface water of Jialing River in Chongqing downtown area. Meanwhile, the source identification of PAHs was carried out in order to document background information on city pollution for regional aquatic environment so as to give scientific support to raise rigorous and effective environmental regulations.
2 Experimental
2.1 Sampling
The sampling program was determined based on the geographical feature and pollution characteristics of Jialing River in Chongqing downtown area. Five samples were collected between September 2009 and August 2010 including Jinkou (J1), Jialing factory (J2), Shimen Bridge (J3), Jiahua Bridge (J4) and Huanghuayuan Bridge (J5) from upstream to downstream. The Jialing River is characterized by a dry period from October to April and a flooding season from May to September. The sampling depth is about 0.5 m below the water/air interface.
The water samples were kept in hexane-rinsed brown glass bottles at 4 °C in dark until required. Flow rate of the river was measured at the same time of sample collection.
2.2 Experimental procedure
2.2.1 Sample pretreatment
“Analysis of water quality-measurement of PAHs” (HJ 478―2009) is the main method for sample pretreatment. After water samples were filtrated under negative pressure by the microfiltration membrane of 0.45 μm, the optimized procedures of solid phase extraction (SPE) and purification, which were described for sample pretreatment in previous study of our laboratory, had been carried out [12-13]. The 1 L water samples were extracted and the extracts were concentrated to about 1 mL by rotary evaporator. Then, the aromatic fraction was obtained by clean-up procedure of silica gel column to provide the extract with low matrix background.
2.2.2 Sample analysis of GC-MS
All sample extracts were analyzed on the GC-MS. The main parameters and the determination conditions are as follows: capillary column of 30 m×0.25 mm× 0.25 μm (Rtx-5MS) for GC; carrier gas of the helium with flow rate of 0.8 mL/min; 1 μL volume of inject volume in a splitless mode and injector temperature of 250 °C. The column temperature was initially held at 50 °C for 3 min, ramp at 50 °C/min to a final temperature of 280 °C (hold for 15 min).
Full scanning of the samples was carried out and 70 eV mass spectra were obtained using mass to charge ratio of 50-550. The temperatures of ion source and the connection device were both 280 °C. Quantitative and qualitative determinations of the PAHs were obtained by comparison of relative retention time and peak area of mass spectrogram between reference materials and real water samples. Quantitative analysis was performed by a five-point calibration curve established using external standard method for each individual PAH with the value range of correlation coefficient (R2) of 0.999 4-0.999 9. In this work, recovery efficiencies of each PAH were from 72.7% to 104.8%, and the detection limits of the method for PAHs determination were about 5 ng/L.
2.3 Chemicals and instruments
Boat, water sampler, dissolved oxygen meter and thermometer (Hach Ltd., USA) were all involved in the work of sample collection. All reagents (HPLC gradient grade) used for sample processing and analysis were supplied by Chemical Reagent Factory and Chongqing Chuandong Chemical Factory and Chengdu Kelong Chemical Reagent Factory. Standard solution of 16 PAHs was purchased from Accustandard Company (USA). GC-MS (Schimadu, MS-QP2010 Plus, Japan) was used for the PAHs determination after the pretreatment of the water sample. SPE cartridges (57012-SupelcleanLC-18 with 20 mL barrel, packing with 1 g of hydrophilic- lipophilic balanced polymer) were purchased from Shanghai Cuding Analysis and Devices Corp., China. Rotary evaporator was obtained from Gongyi Yuhua Instrument Ltd. (China).
3 Results and discussion
3.1 PAHs concentrations in surface water
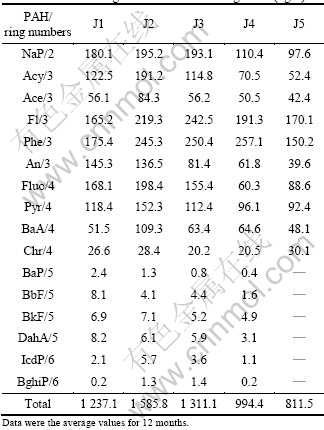
The priory 16 EPA PAHs include naphthalene (NaP), acenaphthylene (Acy), acenaphthene (Ace), fluorine (Fl), phenanthrene (Phe), anthracene (An), fluoranthene (Fluo), pyrene (Pyr), benzo[a]anthracene (BaA), chrysene (Chr), benzo[a]pyrene (BaP), benzo[b]fluoranthene (BbF), Benzo[k]fluoranthene (BkF), dibenzo[a, h]anthracene (DahA), indeno[1, 2, 3-cd]pyrene (IcdP) and benzo[g, h, i] perylene (BghiP). The results of PAHs concentration at different sampling sites using the procedures discussed above are listed in Table 1.
Table 1 shows that the annual average concentration of individual PAH in sample collection sites ranging from ND (not detected) to 257.1 ng/L. PAHs of BaP, BbF, BkF, DahA, BghiP and IcdP were not detected in water samples of J5 site. PAHs in surface water of J1, J2 and J3 are relatively higher than those of J4 and J5. The lowest concentration appeared in J5 (Huanghua bridge) with the total annual average value of 811.5 ng/L, while the highest concentration appeared in J2 (Jialing factory) with the tatal of 1 585.8 ng/L.
In each sampling site, the PAH concentrations of NaP, Acy, Ace, Fl, An, Phe, Fluo and Py were relatively higher than those of other PAH compounds. According to Refs. [14-16], the concentration levels of NaP, Fl, Phe and An in surface water of Huangpu River in Shanghai were 60.79, 50.90, 35.17 and 7.64 ng/L, respectively, and the average concentration of NaP, Fl, Phe and An in surface water of Yangtze River estuary was 80.24 ng/L, and the total concentration of 16 EPA PAHs in Yellow River ranged from 2 920 to 6 680 ng/L [16]. Meanwhile, according to the World Health Organization studied in 1997, the concentration of individual PAH in surface and coastal waters was generally in the neighborhood of 0.05 μg/L and concentration above this point indicates contamination. This shows that PAH concentration of studying area in surface water is at the medium pollution level compared with other rivers in China and abroad. However, BaP concentration in every sampling point was at a relatively low level to the carcinogenic value of risk of 0.7 μg/L by the World Health Organization.
Table 1 Annual average PAHs levels of Jialing River (ng/L)
The distribution ratio for different ring numbers of PAHs is shown in Fig. 1.
The average concentrations of 2, 3, 4, 5 and 6-ring PAHs in five sites accounted for the proportions of 13.0%, 56.6%, 28.6% 1.5% and 0.3%, respectively. It was clear that 3-ring PAHs in the surface water of studied area were the most abundant PAHs, while the concentrations of 5- and 6-ring PAHs were quite low compared with other detected PAHs.
3.2 Temporal and spatial concentrations
The concentration of PAHs shows difference with the change of seasons. The average concentration of total PAHs of five sampling sites from October to April (dry weather) is higher than that from May to September (wet weather). The concentration of total PAHs gradually increased from October to April with the highest average concentration of 1 301.6 ng/L in April. The concentration of average concentration of total PAHs roughly decreased from May to September with the lowest average concentration of 1 001.2 ng/L in August. Temperature which affects the degradation and transformation of PAHs, and flow which affects the transference process and flux of pollutants are the most important reasons for the change of PAHs distribution with seasons. FEMANDES et al [17] also demonstrated that the concentration of PAHs in winter was higher than that in summer in Seine River. The study of PAHs in sea water body of Baltic by WITT [18] demonstrated that PAHs concentration changed obviously in different seasons, and the highest concentration appeared in late autumn and winter.
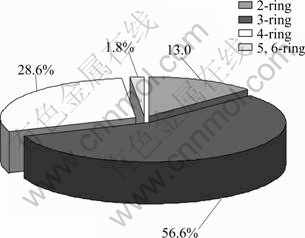
Fig. 1 Distribution of PAHs with different rings
According to the data of temperature and flow detected and cited at the website of Changjiang Maritime Safety Administration, the correlation between temperature, flow and PAHs concentration is illustrated in Fig. 2.
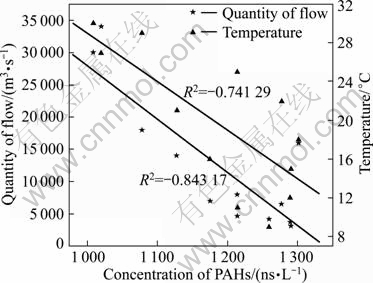
Fig. 2 Relation between temperature, flow and PAHs concentration
The results demonstrate that the flow and temperature are both significant factors to the PAHs concentration in surface water. The flow was obviously negatively-related to the concentration of total PAHs with the correlation coefficient (R2) of -0.843 17. Meanwhile, the temperature and the concentration of total PAHs also had inverse correlation to some extent with the correlation coefficient (R2) of -0.741 29. In comprehensive analysis, when the temperature is relatively low, the metabolism of microorganisms in water body is relatively weak. At the same time, the rate of PAHs transfer in water bodies is relatively low in dry weather.
Figure 3 illustrates the concentrations of PAHs with different rings. PAHs are generally regarded as two types, including low-rings of 2-3 (low relative molecular mass, LMW) and high-rings of 4-6 (high relative molecular mass, HMW). The results showed that the PAH concentrations of LMW were higher than those of HMW in all the samples from five sampling positions. The average concentrations of LMW in five samples ranged between 552.3 ng/L and 1 071.8 ng/L, while the average concentrations of HMW ranged from 259.2 ng/L to 514.0 ng/L.
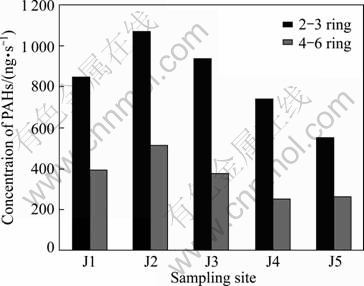
Fig. 3 Concentration of LMW and HMW PAHs concentration in each site
3.3 Sources analysis of PAHs
Special PAH compound ratios, such as Phe/An, Flu/Pyr, LMW/HMW and Fluo/(Fluo+Py), are widely used to identify the source of PAHs. BUDZINSKI [19] studied the sources of PAHs in surface water and sediment. It was suggested that the possible sources of PAHs are petroleum when the ratio of Phe/An>10, while the possible input of PAHs is the incomplete combustion of fuel such as coal and oil when Phe/An<10 [19]. Meanwhile, according to the conclusions of YUNKER et al [20], when the rate of Fluo/(Fluo+Py)<0.5, it was usually considered as an indicator of petroleum; when the rate of Fluo/(Fluo+Py)>0.5, it was usually considered as an indicator of combustion. DOONG and LIN [21] pointed out that the ratio of LMW/HMW could be used to identify the possible PAH origins [21]. In this work, the ratios of Phe/An and Fluo/(Fluo+Py) were used to analyze the possible sources of PAHs in surface water.
According to Fig. 3, ratio of LMW/HMW for sampling stations ranged from 2.1 to 2.9. The results illustrated that these water bodies were mainly contaminated by pyrolytic PAHs. Normally, pyrolytic PAHs were mainly from heavily polluting works near the river existing years ago such as iron and steel plants, food processing plants, plastics plants and chemical plants. And the possible petroleum input of PAHs in surface water from Jialing River was the leakage of oil from the wharves along the riverside near the sampling sites.
Figure 4 shows the source identification of PAHs for different samples along the Jialing River using the ratios of Phe/An and Fluo/ (Fluo+Py). These results were calculated using the concentrations of individual PAH compounds sampled from different months. The results showed that the ratios of Phe/An of J1-J5 sites were almost in the range of 1-6, which indicated that the sources of PAHs were almost from burning products such as coals and oil. The ratio of Fluo/(Fluo+Py) in J1-J3 was between 0.5 and 0.7, which also inferred that the sources of PAHs in these three sites were mainly from burning products. In J4 and J5, in most of the months, the ratio of Fluo/(Fluo+Py) was below 0.5, which indicated that the sources of PAHs were mainly from petrol and it was mainly because of the leakage of oil of wharves nearby.
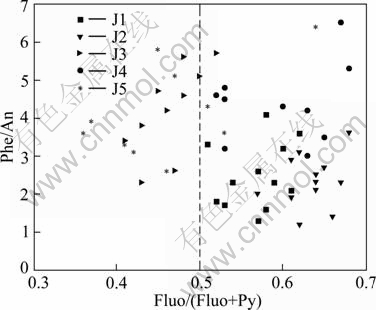
Fig. 4 Phe/An and Fluo/(Fluo+Py) ratios for source identification of PAHs
In sum, the chemical factories along the riverside might contribute LMW PAHs to the water body of Jialing River. While in J4 and J5, the source of PAHs was from both the polluted factories and the leakage of oil. However, there was no conclusive evidence that pyrolytic PAHs and PAHs from petroleum in water body in Jialing River were only from those possible sources. Further investigation on the determination of PAHs is needed to figure out more approaches to explain those sources of PAHs in water body of Jialing River.
4 Conclusions
1) PAH concentrations of each sampling sites range from 811.5 to 1 585.8 ng/L. The concentration of total PAHs in three samples upstream is relatively higher than that in other two sites downstream.
2) The average concentrations of 2, 3 and 4-ring PAHs in five sites account for the majority of proportions of 13.0%, 56.6% and 28.6%, respectively. The highest average PAHs concentration of five sites is in April of dry season and the lowest is in August of wet season.
3) The ratios of Phe/An and Fluo/(Fluo+Py) indicate that the PAHs in surface water of Jialing river in studying area are primarily from burning production of coals, while the PAHs from Jiahua Bridge (J4) and Huang Huayuan Bridge (J5) are also suffered from petroleum source because of the possible influence of wharves nearby.
References
[1] YU Gang, NIU Jun-feng, HUANG Jun. Persistent organic pollutants (POPs)-New global environmental problem [M]. Beijing: Science Press, 2005: 3-5. (in Chinese)
[2] MASTRANGELO G, FADDA E, MARZIA V. Polycyclic aromatic hydrocarbons and cancer in man [J]. Environmental Health Perspectives, 1996, 4(11): 1166-1170.
[3] HENNER P, MICHEL S, MOREL J L, LICHTFOUSE E. Polycyclic aromatic hydrocarbon (PAH) occurrence and remediation methods [J]. Analysis, 1997, 25(9/10): 56-59.
[4] LI Gong-chen, XIA Xing-hui. Distribution and sources of PAHs in water body in middle and lower reaches of Yellow River [J]. Environmental Science, 2006, 27(9): 1738-1743. (in Chinese)
[5] MOHAMAD P Z, HIDESHIGE T, SHINOBU T. Distribution of polycyclic aromatic hydrocarbons (PAHs) in rivers and estuaries in Malaysia: A widespread input of petrogenic PAHs [J]. Environmental Science & Technology, 2002, 36: 1907-1918.
[6] MEYER T, LEI Y D, WANIA F. Transport of polycyclic aromatic hydrocarbons and pesticides during snowmelt within an urban watershed [J]. Water Research, 2011, 45(3): 1147-1156.
[7] SCHWARZENBACH R P, ESCHER B I, FENNER K, HOFSTETTER T B, JOHNSON C A, GUNTEN U, WEHRLI B. The challenge of micropollutants in aquatic systems [J]. Science, 2006, 313, 25(8): 1072-1077.
[8] MALIK A, VERMA P, SINGH A K, SINGH K P. Distribution of polycyclic aromatic hydrocarbons in water and bed sediments of the Gomti River, India [J]. Environmental Monitoring Assessment, 2011, 172: 529-545.
[9] MA J, XIAO R, LI J, YU J, ZHANG Y. Determination of 16 polycyclic aromatic hydrocarbons in environmental water samples by solid-phase extraction using multi-walled carbon nanotubes as adsorbent coupled with gas chromatography-mass spectrometry [J]. Journal of Chromatography A, 2010, 1217(34): 5462-5469.
[10] PANAGIOTOPOULOS I, KAPSIMALIS V, HATZIANESTIS I, KANELLOPOULOS T D, KYRIAKIDOU C. Environmental status of the metropolitan river (Kifissos) of Athens, Greece [J]. Environmental Earth Sciences, 2010, 61(5): 983-993.
[11] XU Chuan, SHU Wei-qun. Risk evaluation of PAHs and PAEs in water environment in Three-gorge area [J]. Research of Environment Science, 2007, 20(5): 57-60. (in Chinese)
[12] JIANG Gui-bing. Pretreatment of environmental samples [M]. Beijing: Chemical Industry Press, 2004: 24-40. (in Chinese)
[13] ZHU Hong. Source apportionment and distribution characteristics of polycyclic aromatic hydrocarbons in the two river of main districts of Chongqing [D]. Chongqing: Chongqing University, 2009. (in Chinese)
[14] TANG Yin-jian. Distribution of LMW in water body of Huangpu River [D]. Shanghai: Tongji University, 2007. (in Chinese)
[15] WU Ling-ling. Distribution of two typical organic pollutants in the Yangtze river estuary and toxicology effects on fish [D]. Shanghai: Tongji University, 2007. (in Chinese)
[16] WANG Ping, XU Jian, GUO Wei-feng. Study of PAHs in water environment in Yellow River of Lanzhou [J]. China Environmental Monitoring, 2007, 23(3): 48-51. (in Chinese)
[17] FEMANDES M B, SICRE M A, BOIREAU A., TRONCZYNSKI J. Polycyclic aromatic hydrocarbon (PAH) distributions in the Seine River and its estuary [J]. Marine Pollution Bulletin, 1997, 34 (11): 857-867.
[18] WITT G. Polycyclic aromatic hydrocarbons in water and sediment of Baltic Sea [J]. Marine Pollution Bulletin, 1995, 31(4-12): 237-248.
[19] BUDZINSKI H, JONES I, BELLOEQ J. Evaluation of sediment contamination by polycyclic aromatic hydrocarbons in the Girondem esturary [J]. Marine Chemistry, 1997, 58: 85-97.
[20] YUNKER M B, MACDONALD R W, VINGARZAN R, MITCHELL R H, GOYETTE D, SYTVESTRE S. PAHs in the Fraser River basin: A critical appraisal of PAH ratios as indicators of PAH source and composition [J]. Organic Geochemistry, 2002, 33: 489-515.
[21] DOONG Ruey-an, LIN Yu-tin. Characterization and distribution of polycyclic aromatic hydrocarbon contaminations in surface sediment and water from Gao-ping River, Taiwan [J]. Water Research, 2004, 38: 1733-1744.
(Edited by YANG Bing)
Foundation item: Project(41101457) supported by the National Natural Science Foundation of China; Project(2009-122) supported by the Fund of Chongqing Municipal Construction Commission, China
Received date: 2011-07-26; Accepted date: 2011-11-14
Corresponding author: XU Xiao-yi, Associate Professor, PhD; Tel: +86-13883402784; E-mail: xuxiaoyi99@126.com

