DOI: 10.11817/j.issn.1672-7207.2017.07.013
辐状节点链接图在IPS日志分析中的研究与应用
张胜1, 2,施荣华1,赵珏2
(1. 中南大学 信息科学与工程学院,湖南 长沙,410083;
2. 湖南商学院 现代教育技术中心,湖南 长沙,410205)
摘要:为了提高IPS(入侵防御系统)日志分析的效率和精准度,提出一种辐状节点链接图可视化分析方法。针对经典节点链接图随着数据量增加,节点变得拥挤、层次难以区分、空间利用率不高等问题,结合节点链接图和辐射图的优势,设计一种新的可视化技术变形即辐状节点链接图。分析VAST 2013 Challenge比赛中IPS日志。研究结果表明:在大数据环境下,该技术能够合理分布节点以区分不同维度的IPS属性,利用可视化筛选降低图像密度,改进布局算法以合理利用显示面积以及产生图形的聚类;该方法能有效地感知网络安全态势,辅助分析人员决策;该辐状节点链接图的数据维度表现能力和业务层次控制能力较强。
关键词:节点链接图;辐射图;网络安全日志;入侵防御系统;可视化分析
中图分类号:TP391 文献标志码:A 文章编号:1672-7207(2017)07-1774-08
Research and application of radial node-link diagram in IPS log analysis
ZHANG Sheng1, 2, SHI Ronghua1, ZHAO Jue2
(1. School of Information Science and Engineering, Central South University, Changsha 410083, China;
2. Modern Educational Technology Center, Hunan University of Commerce, Changsha 410205, China)
Abstract: In order to improve the efficiency and accuracy of the intrusion prevention system (IPS) log analysis, a visualization analysis method was proposed based on node-link diagram. Aiming at solving the problems of node congestion, hierarchy confusion and wasted space in conventional node-link diagrams caused by the growth of data volume, a new visualization technique, i.e. radial node-link diagram was designed. The advantages of node-link diagram and radial diagram were integrated, in the environment of very large data, this technique can rationally arrange nodes to distinguish data dimensions, use visual filter to reduce image occlusion, improve the layout algorithm to make the best of the display area, and generate graph clustering. The VAST Challenge2013 competition data were analyzed. The results show that this new technology is useful to understand network situation and make according decisions. Compared with the award-winning programs, this visualization technology of radical node-link diagram also demonstrates better performance in displaying data dimensions and controlling the levels of operations.
Key words: node-link diagram; radial diagram; network security log; intrusion prevention system (IPS); visual analysis
网络空间在国际政治和经济中的地位日趋重要,而全球网络安全形势却日益复杂。为了保证网络安全,各种安全设备应运而生,如IPS、IDS(入侵检测)、Firewall(防火墙)、AV(病毒查杀)、Netflow(流量监控)等,这些设备不断产生海量的日志数据。然而,传统方法对分析现代网络安全大数据作用有限。目前日志数据量呈级数增加,网络安全分析人员认知负担重;新环境下的攻击类型和模式不断变化,使得传统的分析方法不再有效;态势感知能力欠缺,缺乏对网络全局信息的认识,不能提前防御、预测攻击[1-3]。如何帮助网络安全分析人员更高效地分析网络安全数据成为网络安全领域中亟待解决的一个非常重要的问题。网络安全可视化作为一个新兴的领域,涌现出一批可视化安全工具,在网络安全领域发挥着越来越重要的作用。可视化系统将网络安全数据以图像的方式展现出来,利用人类认知能力和判别模式强的特点对图像进行分析,洞察复杂数据中隐含的模式、趋势、结构和异常,形成高效、准确的人机感知、分析、判断和决策系统[4-5]。流行的网络攻击主要有 Dos(拒绝服务)、Port scan (端口扫描)、Botnet(僵尸网络)、Brut-force-attack(暴力猜解)、病毒、木马等[6-8]。IPS设备虽然能够即时中断、调整或隔离一些不正常或具有伤害性的网络传输行为,但是不能具体区分是何种攻击,安全问题的确认主要依靠管理员的分析能力。为此,本文作者提出用节点链接图来分析日志,确诊安全问题,感知网络态势。首先,对链接图的节点布局模式进行改进,形成辐射环外观,以提高可视图形的层次感,使其可以容纳更多网络节点;然后,改进边的连接方式,采用贝塞尔曲线在接入点进行汇聚,方便问题分析;最后,通过利用可视化筛选技术,降低图像闭塞性(occlusion),突出关注对象,抓住网络攻击变化的瞬间。
1 节点链接技术
网络数据常用的可视化技术有node-link diagrams (节点链接图)、arc diagrams(弧图)、 adjacency matrices (邻接矩阵)、circular layouts(圆形布局图)等,这些技术各有优劣[9]。对于层次结构的网络数据,父子关系的节点链接图是一个重要的表示形式。它将数据组织成一个类似于树节点的连接结构,节点和连线表示数据维度和它们之间的关系,广泛应用于网络取证[10]、无线传感器网络节点配置[11]、主机行为监控[12]等方面。人们对该图的布局技术进行了改进,如缩小交叉边的数量、降低长短边长的比率、提高对称性等,但是,当节点和边大量增加时,通常会遇到闭塞性问题,也就是说,相互交错重叠的节点和连线会使得图像难以分析和交互,造成视觉混淆现象[13]。目前,研究人员从不同角度提高节点链接图的可读性与可用性,如:HUANG等[14]采用forceAR算法提高角分辨率(相邻两边的分离角度标准),以提高图像美观度和方便人类理解;WORDBRIDGE系统对节点和连接都采用标签云表示,用标签云的关键字突出联系的本质特点[15];WARE等[16]采用交互手段访问大图,当鼠标点击时,相应的子图会被点亮,并认为这种交互强调的办法比静态方法更有效;SIDEKNOT系统设计了一种高效算法,使边在节点附近进行捆绑和打结,以避免视觉混乱和突出连接趋势,适合超大型网络结构[17];李志刚等[18]提出了一种面向层次数据的力导向布局算法,将不同层次的边赋予不同初始弹簧长度,以解决层次数据中结构信息展示不清楚的问题;NETSECRADAR系统结合了节点接图和圆形布局图来展现网络安全数据,以便于更好地利用圆中心面积,节点采用力导向布局在圆内排列上千个工作站点而不显拥挤[19]。节点链接图相对于其他点阵表示方法最大的优势在于能理解内在联系和路径查找直接。通过对布局模式进行改进,结合其他技术来展开信息可视化,是未来节点链接图技术发展的新方向。
2 基于节点链接图的辐射状表示法
随着大数据时代来临,可视化分析对象变得越来越复杂。对于节点链接图,当节点数超过20到30个,边数达到节点数1倍时,图像会变得视觉混乱[16]。本研究尝试改进节点链接的布局技术,对整体采用辐射状布局,拟达到以下目的:1) 将不同类型的节点布局在不同半径的圆环上,同时用符号(Glyph)进行标记,从图像上可以直观区分节点类型,同时容纳更多节点;2) 在大数据环境下,通过可视化筛选,去除非关键节点,保留问题的主干;3) 通过边捆绑技术,产生图形聚类,提高非专业人士的态势感知能力。可视化框架见图1(a)。
假设辐状节点链接图表示为G(N,E)(其中,N为结点的集合,E为边的集合),结点分为{N1, N2, …, Ni}共|N|种类型,第Ni种类型由{Ni1, Ni2, …, Nij}共|Ni|个结点组成, 表示指向结点Nij的上层结点{N(i-1),1, N(i-1),2, …, N(i-1),k}共
 个。Nij(r,θ)表示点Nij的极坐标定位(其中,r为半径,θ为角度),则

图1 实验布局图
Fig. 1 Experimental layout diagrams
 (1)
(1)
式(1)解释了Nij(r, θ)的布置方法:若最内层结点(最后1种类型)的数量为1,则它占据圆心位置,否则它的半径按结点类型编号递减(i为层数,从外向内分别为1, 2, 3, …;R为最外层辐射圆环的半径,可根据显示面积决定)。最内层结点的角度由节点数量平分2π弧度,其他层结点的位置由它所指向节点(它的下一层节点)的位置决定,它们均匀地分布在被指向节点的外环两侧,保证了聚类的需要。若1个结点指向多个结点,则它会聚类于指向次数最多的结点。同时,系统也提供了自定义节点位置功能,可以通过鼠标拖放实现。
在可视化框架上,首先考虑不同类型数据的层次区分,它们依次排列在以圆心为中心的辐射圆环上,这样既避免了不同类型数据节点拥挤,又有效地减少了边连接时交叉的产生。不同的节点采用不同色系,方便区分。同时,考虑到色弱者或纸制印刷品的需要,节点还采用了符号标记(Glyph)[20]进行补充,部分符号标记方法见表1。
对于连接节点的边采用边捆绑技术,进入同一节点的边通过贝塞尔曲线进行汇聚,这样可进一步避免边的交叉,图像构成上也更加清晰。同时,有共同目标的节点会自动汇聚在一起,自然形成了聚类,如图1(b)所示。图1(b)显示了内部主机(172.X)根据业务需要,成群组地访问(汇聚于)外部服务器(10.X)的80端口,服务器对这些连接有时建立,有时拆除(build和teardown),整图上像1只发光的眼睛(魔眼图)。
表1 符号标记说明
Table 1 Instruction of Glyphs

3 可视化转换与筛选
使用同一数据源的不同维度可以产生不同的可视化映射结构,合理选择数据维度是可视化转化的关键。不同数据维度展示了实际场景的不同影响因素,设计者需要抽取出这些数据维度中的关键因素来为目的服务。这里,建议选择3~4个维度来设计(若维度太多,则不适合辐状节点链接图表示,图像会变得拥挤蔽塞;若维度太少,则无法充分表示场景细节)。同时,还应该合理改变节点次序,以便更加自然地形成图像聚集。建议将数据可能(数据取值)较少的维度放在圆心处(圆心处可用于显示的面积少),而将数据可能(数据取值)较多的维度置于圆的外辐射圈。表2所示为一些常用的网络安全数据用例,在数据映射模式中从左到右地排列转换为节点链接图中从外到内布局。
表2 网络安全用例的数据映射模式
Table 2 Data mapping scheme of use cases

作为视觉传达的可视图,如何让信息更直观清晰、剔除不确定性理解是研究重点。可视化筛选旨在操作中帮助用户定位,避免不明确操作产生的高成本,通过对复杂图像的进一步挖掘,从中找出实质性内容。当图像变得拥挤时,管理员可以针对性地进行可视化筛选,如去除某些维度,或者关注某些特定对象,以降低图像的密度,突出用例关注的重点。
4 用例分析
本研究选取的实验数据来自可视化国际会议IEEE VIS 2013举办的可视分析挑战赛VAST Challenge。比赛数据提供了某跨国公司内部网络(主机和服务器1100台)约1 648万条IPS日志。
4.1 主机服务与客户访问
表2中的数据映射模式1见图2(a)。从图2(a)可见:该时间窗口内主机服务打开的端口不多,有常规端口80以及高位端口3389和7080等(符号标志为 ),主机建立(Build)和拆除(Teardown)的端口服务主要是80(HTTP服务);而拒绝(Deny)的端口除了80外,还有很多高位端口,如3389端口是Windows远程登陆端口,7080端口是VMware服务端口,这些都是重要服务的端口,若被黑客和恶意程序利用,则将对内部服务器造成无法估量的破坏和损失。IPS拒绝了对这些端口的连接是对内部服务器安全保障的重要体现。
图2(b)所示图形形似2只眼睛,采用模式2,展示了内部客户成组访问外部服务器的用例。外部服务器有规律地建立和拆除连接,网络运行平稳和正常。但存在一个奇怪现象,即辐状节点链接图由外往内第2圈,排列了大量的端口(符号标志为 ),每台内部客户机都使用1个不同的端口对外网服务器进行访问。其原因是该公司内部采用了网络地址及端口转换方式共享Internet连接,这是一种将私有(保留)地址转化为合法IP地址的转换技术,不仅解决了IP地址不足的问题,而且能够有效地避免来自网络外部的攻击,隐藏并保护网络内部计算机。
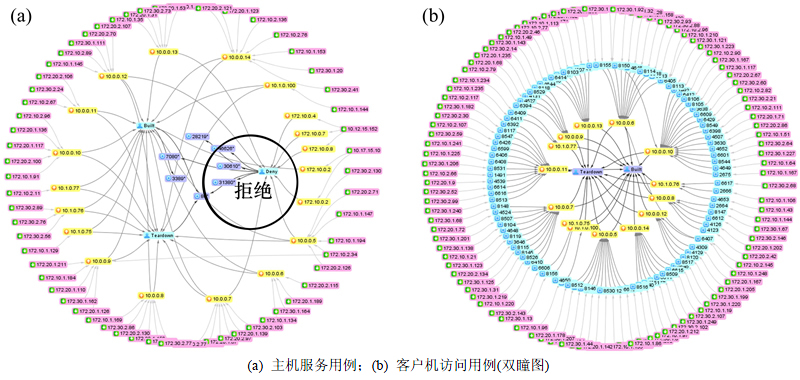
图2 主机服务与客户机访问图
Fig. 2 Host service and client access diagrams
4.2 端口扫描
2016-04-10 T12:25,IPS阻止了大量针对某些内部主机的有序连接,如图3(a)所示(模式3),其中外圈由DestPort构成(符号标志为 ),外网主机对内部机器的大量端口进行了探查,如外部10.13.77.49对内部172.10.0.2-9,外部10.138.235.111对内部172.20.0.3-5等形成了蛙眼一样的形状。由于图3(a)中端口太多,密密麻麻叠在一起,掩盖了其他细节。在数据映射模式中进行可视化筛选,去掉DestPort维度,所得结果见图3(b)。从图3(b)可见:外网10.13.77.49,10.6.6.7和10.138.235.111对内部部分主机进行了端口扫描。
4.3 拒绝服务攻击
2016-04-11 T11:55,IPS报出了3个警报信息即ASA-6-302013,ASA-6-302014和ASA-4-106023,其中有2个6级和1个4级(警报分为7级,级数越小,危险越大),见图4(a)。可视化映射采用表2中的模式4,图4(a)中被拒绝(Deny)连接报出的警报是4级。ASA-4-106023表示ACL拒绝了对真实地址的访问,十分可疑,查询内部地址映射表,这些主机(172.20.0.2-5,172.10.0.2-9和172.30.0.2)对外提供了WEB,Email和DNS等服务,是内部重要服务器,且都服务响应迟缓。对图像进行可视化筛选,只留下ASA-4-106023相关的数据,得到图4(b)。从图4(b)可见10.12.15.152和10.6.6.7对内网部分主机发动了Dos攻击。
4.4 僵尸网络
2016-04-12 T08:24,IPS报出了大量警报信息ASA-6-302013和ASA-6-302014,像2条倾泻的河水,这2个警报分别表示建立和拆除TCP连接,虽然等级为6级,危害较低,但是大量产生。僵尸网络感染图见图5。从图5(a)(模式5)可见绝大部分连接的双方只有一方产生警告(入度或出度为2)。除了1个外网地址10.0.3.77外,本文作者重新规划了该主机的位置,使其独立于圆环外,可发现该主机作为SrcIP和DestIP同时产生了警告(入度和出度都为2)。其原因是外部控制端对内部受控主机发送大量的控制会话小包,造成IPS不断大量地拆除和建立连接。对图像进行筛选,只留下与主机10.0.3.77相关的数据,见图5(b),可看到控制端10.0.3.77控制了内网16台主机。

图3 端口扫描图
Fig. 3 Port scan diagrams

图4 拒绝服务攻击图
Fig. 4 Service attack diagrams of deny
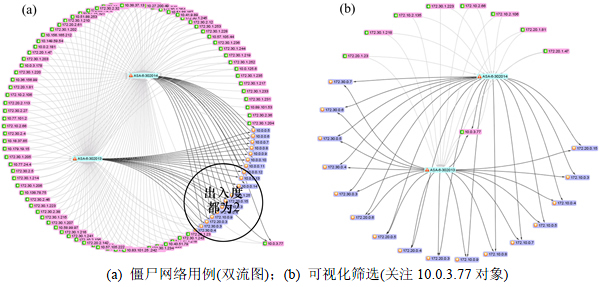
图5 僵尸网络感染图
Fig. 5 Botnet infection diagrams
5 比较与评估
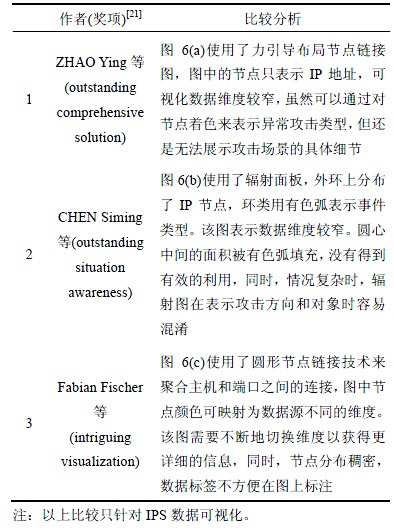
为了对辐状节点链接图的实用性和有效性进行评估,与VAST 2013 Challenge[21]获奖作品进行比较分析,得出该方法在分析网络安全数据上的优势与不足,见图6和表3。
邀请高校网络管理人员(网络安全专业人士) 6人和高年级计算机专业学生(普通用户) 24人对辐状节点链接图进行试用和讨论。大部分网络管理人员认为辐状节点链接图在检测网络安全特别是信息表达的广度和精确度较高;对比传统的日志分析,有助于快速地将安全日志中的异常通过直观图像表现出来,节省大量的时间;使用可视化筛选,可有针对性地分析攻击场景。所有人员认为辐状节点链接图的可视化展示能力比单一的节点链接图和辐射图有明显优势,主要表现在:
1) 比传统节点链接图有更宽的数据维度表现能力和更强的层次控制能力,特别是当数据维度较多时,用户可以很直观地区别数据类型与流向。
表3 获奖作品比较
Table 3 Comparison with prize-winning works
2) 比辐射图有更强的空间利用能力,圆中心的面积得到了较好利用。
3) 当数据量大时,可以方便地对图形进行筛选和压缩,特别是针对Dos攻击这样一些数据量剧增的场景,可以去除干扰因素,降低图像密度,凸显关注的对象。
4) 通过边捆绑技术,能够自然形成图像聚集,便于分析和感知态势。
同时,部分专业人士也提出了一些问题,如: 用图像布局形成聚类有较大局限性,应结合其他的距离算法来显示聚类更加有说服力;虽然相邻2层节点连线控制较好,但对于某些场景,还是存在边交错问题;节点中glyph的颜色是否可用来展示更多的维度信息或攻击的严重等级等。

图6 VAST 2013 Challenge获奖作品
Fig. 6 Award-winning programs of VAST 2013 Challenge
6 结论
1) 本文将节点链接图和辐状图相结合,着力解决传统节点链接图层次不清和辐状图中心空间浪费的问题,通过维度分层设计扩大可视化的数据容纳量;通过改变链接图的节点映射顺序挖掘隐蔽信息和攻击模式,通过可视化筛选降低图像密度。
2) 提出将辐状节点链接图用于IPS网络安全日志的可视化分析,针对IPS中数据大、维度多、变化快、信息隐蔽等特点,该图能够方便地展示宽数据维度,跟踪数据流向,降低图像密度,突出攻击本质,辅助管理员快速取证和决策。
3) 今后,应继续改进节点链接图布局模式和聚合算法,使该可视化技术更具活力。
参考文献:
[1] 韦勇, 连一峰, 冯登国. 基于信息融合的网络安全态势评估模型[J]. 计算机研究与发展, 2009, 46(3): 353-362.
WEI Yong, LIAN Yifeng, FENG Dengguo. A network security situational awareness model based on information fusion[J]. Journal of Computer Research and Development, 2009, 46(3): 353-362.
[2] ZHAO Ying, LIANG Xing, FAN Xiaoping, et al. MVSec: multi-perspective and deductive visual analytics on heterogeneous network security data[J]. Journal of Visualization, 2014, 17(3): 181-196.
[3] 赵颖, 樊晓平, 周芳芳, 等. 网络安全数据可视化综述[J]. 计算机辅助设计与图形学学报, 2014, 26(5): 687-697.
ZHAO Ying, FAN Xiaoping, ZHOU Fangfang, et al. A survey on network security data visualization[J]. Journal of Computer- Aided Design & Computer Graphics, 2014, 26(5): 687-697.
[4] SHIRAVI H, SHIRAVI A, GHORBANI A A. A survey of visualization systems for network security[J]. IEEE Transactions on Visualization and Computer Graphics, 2011, 1(1): 1-19.
[5] HARRISON L, LU Aidong. The future of security visualization: lessons from network visualization[J]. IEEE Network, 2012, 26(6): 6-11.
[6] 王天佐, 王怀民, 刘波, 等. 僵尸网络中的关键问题[J]. 计算机学报, 2012, 35(6): 1192-1208.
WANG Tianzuo, WANG Huaimin, LIU Bo, et al. Some critical problems of botnets[J]. Chinese Journal of Computers, 2012, 35(6): 1192-1208.
[7] 叶云, 徐锡山, 齐治昌, 等. 大规模网络中攻击图自动构建算法研究[J]. 计算机研究与发展, 2013, 50(10): 2133-2139.
YE Yun, XU Xishan, QI Zhichang, et al. Attack graph generation algorithm for large-scale network system[J]. Journal of Computer Research and Development, 2013, 50(10): 2133-2139.
[8] 郑皓, 陈石, 梁友. 关于“数字大炮”网络攻击方式及其防御措施的探讨[J]. 计算机研究与发展, 2012(S2): 69-73.
ZHENG Hao, CHEN Shi, LIANG You. How the cyber weapon “digital ordnance” works and its precautionary measures[J]. Journal of Computer Research and Development, 2012(S2): 69-73.
[9] MCGUFFIN M J. Simple algorithms for network visualization:a tutorial[J]. Tsinghua Science and Technology, 2012, 17(4): 383-398.
[10] TIAN Zhihong, JIANG Wei, LI Yan. A transductive scheme based inference techniques for network forensic analysis[J]. China Communications, 2015, 12(2): 167-176.
[11] HE Qinbin, CHEN Fangyue, CAI Shuiming, et al. An efficient range-free localization algorithm for wireless sensor networks[J]. Science China Technological Sciences, 2011, 54(5): 1053-1060.
[12] MANSMAN F, MEIER L, KEIM D A. Visualization of host behavior for network security[R]. VizSEC2007. Berlin, Heidelberg: Springer, 2008: 187-202.
[13] 杨彦波, 刘滨, 祁明月. 信息可视化研究综述[J]. 河北科技大学学报, 2014, 35(1): 91-102.
YANG Yanbo, LIU Bin, QI Mingyue. Review of information visualization[J]. Journal of Hebei University of Science and Technology, 2014, 35(1): 91-102.
[14] HUANG Weidong, HUANG Maolin, LIN Chuncheng. Aesthetic of angular resolution for node-link diagrams: validation and algorithm[C]// 2011 IEEE Symposium on Visual Languages and Human-Centric Computing (VL/HCC). Pittsburgh, PA, USA, 2011: 213-216.
[15] KIM K T, KO S, ELMQVIST N, et al. WordBridge: using composite tag clouds in node-link diagrams for visualizing content and relations in text corpora[C]// the 44th Hawaii International Conference on System Sciences. Kauai, Hawaii, USA, 2011: 1-8.
[16] WARE C, BOBROW R. Motion to support rapid interactive queries on node-link diagrams[J]. ACM Transactions on Applied Perception, 2004, 1(1): 3-18.
[17] PENG Dichao, LU Neng, CHEN Guangyu, et al. SideKnot: Edge bundling for uncovering relation patterns in graphs[J]. Tsinghua Science and Technology, 2012, 17(4): 399-408.
[18] 李志刚, 陈谊, 张鑫跃, 等. 一种基于力导向布局的层次结构可视化方法[J]. 计算机仿真, 2014, 3(3): 283-288.
LI Zhigang, CHEN Yi, ZHANG Xinyue, et al. Hierarchical structure visualization methods research[J]. Computer Simulation, 2014, 3(3): 283-288.
[19] ZHOU Fangfang, SHI Ronghua, ZHAO Ying. NetSecRadar: a visualization system for network security situational awareness[C]// IEEE Conference on Visual Analytics Science and Technology (VAST 2012). Seattle, WA, USA: Springer International Publishing, 2013: 403-416.
[20] ROPINSKI T, OELTZE S, PREIM B. Survey of glyph-based visualization techniques for spatial multivariate medical data[J]. Computers & Graphics, 2011, 35(2): 392-401.
[21] HCIL.VAST challenge 2013 [EB/OL]. [2013-09-01]. http:// hcil2.cs.umd.edu/newvarepository/VASTChallenge2013/challenges/ MC3-Big Marketing/.
(编辑 陈灿华)
收稿日期:2016-09-10;修回日期:2016-11-20
基金项目(Foundation item):国家自然科学基金资助项目(61402540) (Project(61402540) supported by the National Natural Science Foundation of China)
通信作者:赵珏,副教授,从事网络信息安全、计算机支持的协作学习、网络软件应用等研究;E-mail: 48209088@qq.com

