���ڸĽ���ӹ�ͼ��Ni80A�Ͻ�̬�ٽᾧ����������
��Դ�ڿ����й���ɫ����ѧ��(Ӣ�İ�)2019���7��
�������ߣ�Ȩ���� ���� �Խ� ���� ʩ���
����ҳ�룺1449 - 1464
�ؼ��ʣ��������ºϽ𣻱��μ����ܣ��ӹ�ͼ����̬�ٽᾧ
Key words��nickel-based superalloy; deformation activation energy; processing map; dynamic recrystallization
ժ Ҫ���ܹ��յ�����ϸ���Ķ�̬�ٽᾧ���λ������ڱ��β��������Գ��ι��յ���ƾ�����Ҫ���塣����Ni80A ���ºϽ����¶ȷ�Χ1273~1473 K��Ӧ�����ʷ�Χ0.01~10 s-1�ڽ��е���ѹ�����飬���ݴ˽����ӹ�ͼ����ϼӹ�ͼ������֯��֤�������ڱ��λ���ͼ��ʶ�����̬�ٽᾧ��Ӧ�IJ������⣬��������������ݵļ�����ָ���һ���Ż���һ���������գ�������Ľ���ļӹ�ͼ������ö�Ӧ��̬�ٽᾧ���λ��ƺͽϵͼ����ܵ����Ų��������£�Ӧ��Ϊ0.3ʱ��������Ϊ 1296~1350 K��0.056~0.32 s-1 �� 1350~1375 K��0.035~0.11 s-1��Ӧ��Ϊ0.5ʱ��������Ϊ 1290~1348 K��0.2~0.5 s-1 �� 1305~1370 K��0.035~0.2 s-1��Ӧ��Ϊ0.7ʱ��������Ϊ 1290~1355 K��0.042~0.26 s-1��Ӧ��Ϊ0.9ʱ��������Ϊ1298~1348 K��0.037~0.224 s-1��
Abstract: The determination of intrinsic deformation parameters inducing grain refinement mechanism of dynamic recrystallization (DRX) contributes to the relative forming process design. For Ni80A superalloy, the processing maps were constructed by the derivation of the stress-strain data coming from a series of isothermal compression tests at temperatures of 1273-1473 K and strain rates of 0.01-10 s-1. According to the processing maps and microstructural validation, the deformation parameter windows with DRX mechanism were separated in an innovative deformation mechanism map. In addition, the deformation activation energy representing deformation energy barrier was introduced to further optimize such windows. Finally, the enhanced processing maps were constructed and the parameter domains corresponding to DRX mechanism and lower deformation barrier were determined as follows: at ��=0.3, domains: 1296-1350 K, 0.056-0.32 s-1 and 1350-1375 K, 0.035-0.11 s-1; at ��=0.5, domains: 1290-1348 K, 0.2-0.5 s-1 and 1305-1370 K, 0.035-0.2 s-1; at ��=0.7, domains: 1290-1355 K, 0.042-0.26 s-1; at ��=0.9, domains: 1298-1348 K, 0.037-0.224 s-1.
Trans. Nonferrous Met. Soc. China 29(2019) 1449-1464
Guo-zheng QUAN1,2, Qiao LIU1, Jiang ZHAO1, Wei XIONG3, Rui-ju SHI1
1. State Key Laboratory of Mechanical Transmission, School of Material Science and Engineering, Chongqing University, Chongqing 400044, China;
2. State Key Laboratory of Materials Processing and Die & Mould Technology, Huazhong University of Science and Technology, Wuhan 430074, China;
3. Key Laboratory of Advanced Reactor Engineering and Safety of Ministry of Education, Collaborative Innovation Center of Advanced Nuclear Energy Technology, Institute of Nuclear and New Energy Technology,
Tsinghua University, Beijing 100084, China
Received 22 July 2018; accepted 19 December 2018
Abstract: The determination of intrinsic deformation parameters inducing grain refinement mechanism of dynamic recrystallization (DRX) contributes to the relative forming process design. For Ni80A superalloy, the processing maps were constructed by the derivation of the stress-strain data coming from a series of isothermal compression tests at temperatures of 1273-1473 K and strain rates of 0.01-10 s-1. According to the processing maps and microstructural validation, the deformation parameter windows with DRX mechanism were separated in an innovative deformation mechanism map. In addition, the deformation activation energy representing deformation energy barrier was introduced to further optimize such windows. Finally, the enhanced processing maps were constructed and the parameter domains corresponding to DRX mechanism and lower deformation barrier were determined as follows: at ��=0.3, domains: 1296-1350 K, 0.056-0.32 s-1 and 1350-1375 K, 0.035-0.11 s-1; at ��=0.5, domains: 1290-1348 K, 0.2-0.5 s-1 and 1305-1370 K, 0.035-0.2 s-1; at ��=0.7, domains: 1290-1355 K, 0.042-0.26 s-1; at ��=0.9, domains: 1298-1348 K, 0.037-0.224 s-1.
Key words: nickel-based superalloy; deformation activation energy; processing map; dynamic recrystallization
1 Introduction
As a typical nickel-based alloy, Ni80A superalloy has been widely applied in the hot end components of a prime mover due to its high strength and strong corrosion-resistance at elevated temperature [1-4]. To obtain such excellent properties, the grain refinement microstructure induced by DRX mechanism is often pursued in a hot forming process of Ni80A super alloy [5,6]. However, it is an essential issue to find a critical processing parameter window corresponding with desired microstructures. The theory of processing map proposed by PRASAD et al [7] on the basis of dynamic material model (DMM) solves this issue. Up to now, the processing maps have been applied to investigating the hot deformation behaviors of titanium alloy [8,9], aluminum alloy [10,11], magnesium alloy [12,13], nanocomposite [14], superalloy [15,16], etc. However, the optimal processing parameters should not only ensure steady material flowing and desired microstructures, but also ensure a lower driving force of material flowing. Thus, deformation activation energy is introduced into processing maps. Deformation activation energy represents forming difficulty degree and contributes to evaluating the microstructural softening mechanisms such as DRX and DRV [17].
In recent years, some scholars keep developing the processing maps of typical alloys to identify their optimal processing parameters. MOKDAD et al [18] and ZHANG et al [19] clarified the safe and unsafe processing parameter windows of Al-Cu-Mg nanocomposite and C276 Ni-Cr-Mo-based alloy by processing maps, but they didn��t consider the effect of activation energy on the evaluation of safe processing parameter windows. MOHAMADIZADEH et al [20] and LAI et al [21] constructed the processing maps and calculated the activation energy of duplex low-density steel and AZ40 magnesium alloy, respectively, while they considered activation energy as a constant independent on hot processing parameters. SUN et al [22] pointed that activation energy was a variable influenced by temperature, strain and strain rate. Then, ZHANG et al [23], GHASEMI et al [24], LI et al [25] and MOHAMADIZADEH et al [17] constructed the responding maps between deformation activation energy and hot processing parameters for Ti-43Al-2Si alloy, BT9 titanium alloy and low-density steel, respectively. However, few attentions were paid to introducing the activation energy indicator into processing maps. QUAN et al [26] constructed the comprehensive processing maps of Ti-13Nb-13Zr biomedical alloy by superimposing the activation energy maps on the processing maps. However, their work is limited in directly dividing the processing map into several parameter domains corresponding to different deformation mechanisms. Actually, with the further study of processing map, a critical processing parameter window corresponding with desired deformation mechanism especially for DRX grain refinement mechanism, is always pursued. As mentioned previously, such parameter window is necessary to be further evaluated by lower activation energy.
In this work, the processing maps including three basic indicators, i.e., strain rate sensitive index, power dissipation efficiency and instability parameter were constructed to find a safe domain for materials forming. According to the values of power dissipation efficiency and microstructure observations, DRX and DRV softening mechanisms were identified from the safe domains, meanwhile the innovative deformation mechanism map was constructed. In addition, the deformation activation energy values at different conditions were calculated, based on which the activation energy maps were developed. In the end, the enhanced processing maps were constructed by superimposing activation energy maps over deformation mechanism maps, and the safe parameter windows with DRX mechanism and lower energy barrier were determined.
2 Principles of thermal processing map
The concept of processing map was proposed by PRASAD et al [7] based on dynamic materials model (DMM). In DMM theory, a thermoplastic deforming process is deemed as an energy dissipation system, in which pressure facility is considered as a source of power, tool is considered as a store of power, and workpiece is considered as a dissipater. The total power per unit volume, P, expressed as Eq. (1), is clarified into two parts, i.e. the power dissipated in geometric shape change inducing a temperature rise (G) and the power dissipated in microstructure evolution such as DRV, DRX, phase transformation, etc., (J).
 (1)
(1)
where  is the strain rate, and �� is the flow stress. At a constant temperature and strain, �� is expressed as a function of strain rate, Eq. (2):
 (2)
(2)
where K is the stress coefficient, and m is strain rate sensitive index deciding the power partition between G and J. For a certain strain and certain temperature, m-values are calculated by Eq. (3):
 (3)
(3)
According to Eqs. (1), (2) and (3), Eq. (4) is deducted for calculating J. For an ideal linear dissipater corresponding to m=1, J reaches its maximum value,  .
.
 (4)
(4)
In DMM theory, a dimensionless indicator representing the power dissipation capacity in a microstructure evolution process, power dissipation efficiency, ��, is proposed as Eq. (5), which is always adopted to indicate the microstructural evolution mechanisms. The variation trajectories of �� dataset along with temperature and strain rate constitute a power dissipation map that exhibits different parameter domains correlated with specific microstructural mechanisms. Usually, the parameter windows with positive ��-values corresponded with safe domains involving several desired dynamic restoration mechanisms such as DRX, DRV and superplasticity. On the contrary, the parameter windows with negative ��-values corresponded with unsafe regions involving several undesired microstructure defects such as wedge cracking and void formation [27].
 (5)
(5)
The evaluation relying strain rate sensitive index and power dissipation efficiency is not sufficient [28]. Here, another evaluator, instability criterion as Eq. (6) based on the principle of maximum rate of entropy production in the metallurgical system, is taken into consideration to identify several flow instability mechanisms such as adiabatic shear band and flow localization. The variation trajectories of  dataset along with temperature and strain rate constitute an instability map, in which a region with negative parameters is unsafe representing instable flow.
 (6)
(6)
where is a dimensionless instability parameter.
As a power dissipation map and an instability map have been constructed, a processing map can be achieved by superimposing the instability map on the power dissipation map.
3 Experimental
The detail chemical compositions (wt.%) of Ni80A superalloy in this work are as follows: C 0.069, Mn 0.630, Cr 2, Fe 1.260, Ti 2.070, Al 0.680, Si 0.550, S 0.001, Ni balance. The following experimental procedures are designed as ASTM standard: E209-00. Twenty-six cylindrical specimens were needed, among which 25 specimens were compressed, and the left one served as an as-received specimen. Each specimen with a diameter of 10 mm and a height of 12 mm was separated from one rolled billet with a diameter of 170 mm by wire electrode cutting. This billet was preserved at 1023 K for 8 h in a resistance furnace. The first compression experiment schedule considering temperature and strain rate effects was designed as follows: 20 specimens were compressed till a height reduction of 60% corresponding to a true strain of 0.916 at five different temperatures of 1273, 1323, 1373, 1423, 1473 K under four different strain rates of 0.01, 0.1, 1 and 10 s-1. Height reduction of 60% was adopted to ensure that DRX occurred with a large degree. The second compression experiment schedule considering strain effect was designed as follows: five specimens were respectively compressed till five different height reductions of 10%, 20%, 30%, 40% and 50% corresponding to true strains of 0.105, 0.223, 0.357, 0.511 and 0.693 at a temperature of 1373 K under a strain rate of 0.1 s-1.
Isothermal axial compression was conducted on a computer-controlled and servo-hydraulic Gleeble 3500 machine. It is a fully integrated digital closed loop control thermal and mechanical testing system. Before the compression, a specimen was placed between two anvils. Besides, two tantalum foils with a diameter of 20 mm were put between the cylindrical specimen and anvils to reduce friction. Processing route for isothermal hot compression test is shown in Fig. 1. One specimen was resistance heated at 5 K/s to the proposed temperature by thermo-coupled-feedback-controlled AC current and preserved for 180 s to obtain a uniform temperature field. And then, the heated specimen was compressed to designed schedule. After compression, the deformed specimen was water quenched immediately to retain the high temperature microstructure. During the compression process, a serious of normal stress-strain data were tracked and collected by a computer controlled data acquisition system. Then, true stress-strain can be derived from normal stress-stain according to the following formulas: ��T=��N(1-��N), ��T=ln(1-��N), where ��T is the true stress, ��N is the normal stress, ��T is the true strain, ��N is the normal strain.

Fig. 1 Schematic illustration of hot compression tests
In addition, electron backscattered diffraction (EBSD) technology was employed to observe the grain size and grain boundary characters. Before observation, each deformed specimen was sectioned symmetrically into two semi-cylinders parallel to the compression axis direction, a 5 mm �� 5 mm �� 3 mm sample was separated from the center of each semi-cylinder by wire electrode. Subsequently the section surfaces were grinded and then electro-polished in an electrolyte of HClO4, CH3COOH and H2O with a specific proportion at room temperature for 22 s under a voltage of 20 V. The EBSD analysis was performed by JEOL JSM-7800F field emission scanning electron microscope (SEM) coupled with a HKL technology EBSD attachment, operated at 20 kV. For the electro-polished sample, an area of 1200 ��m �� 1200 ��m was scanned using a step size of 0.2 to 2 ��m depending on the grain size. Channel 5 software was used to analyze the collected EBSD data, and the inverse pole figure (IPF) maps showing the crystallographic directions of orientations with suitable color codes were represented.
4 Results and discussion
4.1 Construction of thermal processing map
4.1.1 Variation of strain-rate sensitivity indicator
A series of true stress-strain curves obtained from isothermal hot compressions are illustrated in Fig. 2. It is obvious that the flow stress of as-rolled Ni80A superalloy is affected significantly by temperature, strain and strain rate. As for a fix strain, flow stress declines with increasing temperature at a constant strain rate and rises with increasing strain rate at a constant temperature. Moreover, with increasing stain, true stress-strain curves increase up to a peak value first and then follow by a flow softening behavior, this typically demonstrates the occurrence of DRX [19].
The thermal plastic flow behaviors indicating different deformation mechanisms at most of alloys are always highly strain rate dependent. A deep understanding of strain rate dependence on the flow behaviors of Ni80A superalloy is significant for stimulating its wide application. To reveal the dynamic response of strain-rate sensitivity index, m, to different deformation parameters including temperature, strain rate and strain, a dataset of m-values given in Table 1 is determined from the slopes of fitted lg �� versus  cubic splines shown in Fig. 3. Meanwhile, the smooth response surfaces between m-values and the forming condition parameters were plotted shown in Fig. 4. It can be seen that m-values increase firstly and then decrease with increasing temperature at a constant strain rate, and with increasing strain rate at a constant temperature. Higher m-values occur within a narrow range of strain rate from 0.1 to 1 s-1, and temperature from 1323 to 1473 K. From Table 1, we can see that there are negative m-values under forming conditions as follows: strain of 0.7, strain rate of 0.01 s-1, and temperature of 1373 K; strain of 0.9, strain rate of 10 s-1, and temperature of 1273 K. According to Prasad, negative m-values are usually generated under instability conditions that lead to the occurrence of dynamic strain aging (DSA), adiabatic shear band (ASB) or the initiation and growth of micro-cracks.

Fig. 2 True stress-strain curves of Ni80A superalloy obtained by Gleeble-3500 under different deformation temperatures with strain rates 0.01 s-1 (a), 0.1 s-1 (b), 1 s-1 (c) and 10 s-1 (d)
Table 1 m-values calculated at different temperatures, strains and strain rates

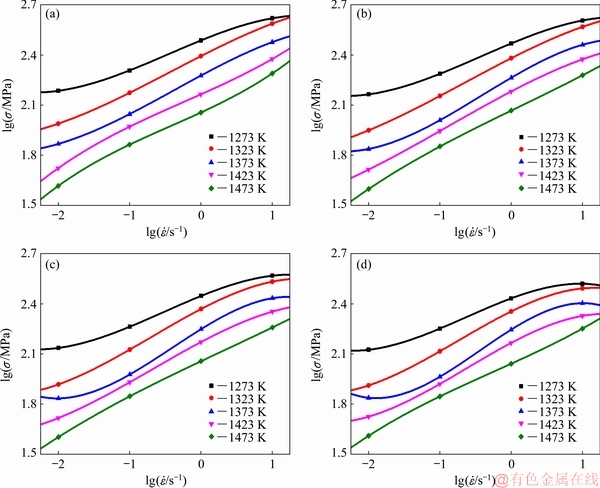
Fig. 3 Relationships between stress and strain rate in lg scale at different deforming temperatures and true strains of 0.3 (a), 0.5 (b), 0.7 (c) and 0.9 (d)

Fig. 4 Strain-rate sensitivity index for Ni80A superalloy at true strains of 0.3 (a), 0.5 (b), 0.7 (c) and 0.9 (d)
The variation of m-value suggests a transition of different deformation mechanisms. During the compression processes at the experimental temperatures of 1273-1473 K, the primary solid solution for Ni80A exists as ��-phase (austenite) with FCC structure. In FCC materials, the full family of slip systems may be written as <110>{111}, which have 12 slip systems (four slip planes each with three directions). Within a given crystal, perfect edge dislocations will move along the most densely packed planes (basal planes), and within these planes perfect edge dislocations will then move along the closest packed directions. Such is basal slip easy to exist at lower temperatures. As a dominant deformation mechanism in FCC materials, basal slip is athermal in the interested temperature range, and makes m-value almost equal to zero. So basal slip is not the reason for m-value change [27]. With increasing temperature, another slip mode, non-basal slip, is thermally activated and contributes greatly to increasing m-value due to the fact that at a higher energy state, perfect edge dislocation slipping within basal planes translates into partial dislocation slipping within dynamically derived slip planes. Such translation behaviors should always be easily achieved, since they decrease the line energy via dividing a perfect dislocation with concentrated line energy into two partial dislocations with a smaller line energy. Thus, no-based slip is the main reason for m-value increase. Meanwhile, other plastic deformation mechanisms involving micro-cracks and deformation twinning result in m-value decrease, and even lead to a negative m-value. In fact, basal slip, non-basal slip, twinning, etc. coexist during the compression process in Ni80A superalloy. So their comprehensive interaction is the real reason for m-value changing.
However, only relying on negative of positive m-value, it is insufficient to accurately evaluate whether the material experiences instable deformation or not. According to DMM theory, power dissipation efficiency and instability parameter have to be introduced to further clarify safe and unsafe domains.
4.1.2 Variation of power dissipation efficiency indicator
According to the principles of power dissipation efficiency described in Eq. (5), the ��-values were calculated, and the typical power dissipation maps were constructed as Fig. 5. In Fig. 5, the contour numbers represent the values of dissipation efficiency, which characterize the rate of microstructure evolution during hot working process. The efficiency of power dissipation is regarded as microstructural ��trajectories��, since it represents the dynamic microstructural state of the deformed material. According to DMM theory, the black regions with negative ��-value mean that the material flow is unstable, and there is a little unstable area in Fig. 5(d). The power dissipation maps indicate that ��-values remain higher level (0.31-0.46) in two cases. One occurs at temperatures 1323-1373 K, strain rates 0.1-1 s-1 and strains 0.3-0.9. Another one occurs at higher temperatures 1423-1473 K, strain rates 0.01-10 s-1 and strains 0.3-0.9. It is worth noting that the higher ��-values represent lower dissipative energy state or higher rate of entropy production.

Fig. 5 Power dissipation maps for Ni80A superalloy at true strain of 0.3 (a), 0.5 (b), 0.7 (c) and 0.9 (d)
In Fig. 5, we can find that the power dissipation maps obtained at strains of 0.3, 0.5, 0.7, 0.9 are essentially similar, which indicates that strain does not have a significant influence on the ��-value distribution. But with increasing strain, the minimum of �� gradually decreases. When the strain and temperature are constants, power dissipation efficiency increases firstly and then decreases with increasing strain rate. When the strain rate and strain are constants, power dissipation efficiency decreases with increasing temperature.
As previously described in Section 2, the variation of power dissipation efficiency with processing parameters reveals the way of microstructure evolution [26]. As for Ni-based alloy, the ��-value associated with DRV is 0.2-0.3, and the ��-value corresponding to DRX is 0.3-0.4. When the ��-value exceeds 0.6, the super- plasticity occurs [19], but there is no such region in the present research. Actually, the area with higher ��-value is not always a safe region as instable mechanisms including wedge cracking can also make a region with higher ��-value. Thus, a flow instability criterion is needed to further evaluate the unstable area.
4.1.3 Variation of instability indicator
The variation of ��-value with strain rate, strain and temperature constructs an instability map, and the continuous 3D instability map of Ni80A superalloy is shown in Fig. 6(a), in which the instability regions are clarified by negative ��-value and the instability degree was represented by graded colors. In addition, internal distributions of 3D instability map were revealed by introducing ��slices�� at chosen values of one of the parameters (i.e., strain in Fig. 6(b), temperature in Fig. 6(c), strain rate in Fig. 6(d)). This feature not only allows a clear 3D representation to see a combined effect of all process parameters, but also allows a ��cut-through�� view to see the effect of one designated process parameter along the different slices. In Fig. 6, we can find that with increasing stain, the instability domains gradually expand. Besides, the instability domains mainly located at higher strain rates and lower temperatures. This is due to the fact that distortion energy of crystal lattice keeps a higher level under these conditions, which will lead to microstructure defects and restraint of DRV and DRX.

Fig. 6 3D flow instability map
In a word, the general response of strain rate sensitivity to strain, temperature and strain rate is fundamentally responsible for the variation of power dissipation efficiency and instability criterion. Generally, the regions with lower m-value which means fewer slip systems mainly correspond with unstable regions, but this does not mean that higher m-value is safer due to the complexity in the dynamic transition and coexisting of different deformation mechanisms. Thus, the safe and unsafe domains must be identified based on the comprehensive comparison of strain rate sensitivity, power dissipation efficiency and instability criterion.
4.1.4 Integration of three indictors for processing map
The processing maps of Ni80A superalloy at the strains of 0.3, 0.5, 0.7 and 0.9 were constructed by superimposing the instability maps over power dissipation maps as shown in Fig. 7. In each processing map, the contour numbers represent the values of power dissipation efficiency (��), the gray areas correspond to instability regions with negative ��-value.
In Fig. 7, the regions of flow instability and the safe domains are distinguished with a thick curve and different region marks including ����INST���� and ����DOM����. The following is taking the case at the strain of 0.9 as an example to illustrate distributions of safe domains. In Fig. 7(d), there are two safe domains with higher ��-value (>0.2): Domain #1-0.9 occurs in the temperature range of 1273-1423 K and strain rate range of 0.032-0.316 s-1; DOM #2-0.9 occurs in the temperature range of 1423-1473 K and strain rate range of 0.01-1 s-1.
4.2 Microstructure observation and deformation mechanism
To validate the safe domains clarified by the processing maps, as well as deeply understand the intrinsic relationships between microstructures and processing parameters, the specific microstructures of the deformed specimens with a true strain of 0.916 were observed. Figure 8 shows the as-received microstructure of Ni80A superalloy. The original microstructure of annealed Ni80A superalloy consists of equiaxed grains, which is a homogeneous �� phase with carbides solute into the matrix. In addition, the lamella-like straight annealing twins are also observed in original microstructure.

Fig. 7 Strain sections of processing map for true strain of 0.3 (a), 0.5 (b), 0.7 (c) and 0.9 (d)

Fig. 8 As-received microstructure of Ni80A superalloy
Figures 9(a-d) show the optical microstructures of Ni80A superalloy corresponding to safe DOM #1-0.9 in processing map. Figure 9(a) represents the microstructure at temperature of 1273 K and strain rate of 0.1 s-1. We can see that some ��necklace�� microstructures inhomogeneously distribute in the elongated �� matrix. This is due to a mechanism that during deformation processes, the original grains elongate and dislocation density increases, then some subgrains are generated by dislocation polygonization and translated into DRX grains distributing at the original grain boundary. This represents typical DRV characteristic. In addition, it can be found from processing map that ��-value is below 0.3 under the relevant deformation conditions. Thus, combining the processing map and microstructure, it is concluded that DRV predominates at temperature of 1273 K and strain rate of 0.1 s-1. Figures 9(b-d) represent the microstructures in temperature range of 1323-1473 K at strain rate of 0.1 s-1. In Fig. 9(b), it is found that more ��necklace�� structures homogeneously distribute along original grain boundary, which means that DRX has occurred. In addition, with increasing deformation temperature, more and more ��necklace�� structures are observed. This phenomenon is explained by the fact that with increasing temperature, meanwhile grain boundary mobility increases, dislocation climb and cross slip become easier. All of these promote the translation of subgrain boundary to higher-angle grain boundary, i.e., dynamic recrystallization grain boundary [29,30]. When the temperature is above 1373 K, nearly full recrystallized grains are observed in Figs. 9(c, d). Besides, we can find that ��-value is higher than 0.3 under the relevant deformation conditions from processing map. Consequently, it is concluded that DRX predominates in temperature range of 1323-1473 K at strain rate of 0.1 s-1.
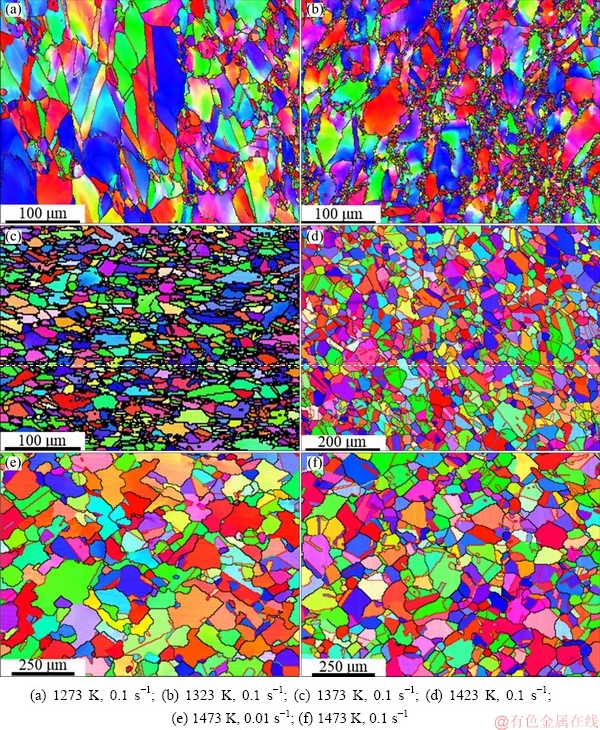
Fig. 9 IPF maps under different conditions
Figures 9(e, f) show the typical microstructures of Ni80A superalloy deformed at temperature of 1473 K and strain rates of 0.01 and 0.1 s-1 corresponding to safe DOM #2-0.9 in processing map. As we can see that some recrystallized grains distribute along the grain boundary in Fig. 9(e), and nearly full recrystallized grains are observed in Fig. 9(f). This is due to the fact that with higher strain rate, dislocation density needed for the nucleation of DRX nuclei becomes higher. In DOM #2-0.9 of processing map, we can find that ��-value is higher than 0.3, so combining the processing map and microstructures, it is concluded that DRX predominates in safe DOM #2-0.9.
Figures 10(a-f) show the microstructures of Ni80A superalloy deformed to different strains from 0.105 to 0.916 at temperature of 1373 K and strain rate of 0.1 s-1. When the specimen was deformed to the strains below 0.223, the original grain boundaries become serrated and bulging, and few recrystallized grains are observed in Figs. 10(a, b) due to smaller deformation. With the strain increasing to 0.357, it is found that a few recrystallized grains distribute irregularly along the original grain boundaries (Fig. 10(c)). The microstructures are composed of work hardened grains and dynamically recrystallized grains. With the strain further increasing to 0.511, more and more recrystallized grains are observed in Fig. 10(d). This is attributed to the fact that crystal defects including dislocation and deformation stored energy increase with increasing strain, leading to the sufficient driven force for DRX. In Figs. 10(e, f), we can see that nearly all the original grains have been replaced by new equiaxed grains after the specimen has been deformed to the true strain of 0.693. In Fig. 7, it can be seen that ��-values in the domain corresponding to temperature of 1373 K, strain rate of 0.1 s-1 and strain range from 0.3 to 0.9 are higher than 0.3. Thus, DRX predominates at temperature of 1373 K and strain rate of 0.1 s-1, and the DRX volume fraction increases with increasing strain.

Fig. 10 IPF maps at fixed strain rate of 0.1 s-1, constant temperature of 1373 K and different true strains
From analysis above, it is concluded that the microstructural results agree well with computational processing maps. So it is reliable to use the processing maps for identifying deformation mechanisms. And the identified deformation mechanism map is shown in Fig. 11, in which DRX softening mechanism plays a dominant role in the green area with corresponding ��-values of 0.3-0.4, DRV softening mechanism plays a dominant role in the yellow area with corresponding ��-values of 0.2-0.3, while the flow instability mechanism plays a dominant role in the red area with negative ��-value.

Fig. 11 Deformation mechanism map of Ni80A superalloy
4.3 Effect of parameters on activation energy and kinetic analysis
4.3.1 Solution of important material parameters
In a hot working process, plastic deformation is always considered as a thermal activation process [31]. The thermally activated stored energy (Q), i.e. deformation activation energy, induces DRV or DRX softening mechanisms in the forming process [26]. To further analyze plastic deformation behavior of Ni80A superalloy, a dataset of corresponding Q values under different deformation parameters is needed. At present, an empirical equation, Arrhenius equation shown as Eq. (7), is always adopted to calculate the deformation activation energy due to its simplicity and wide range of applicability. Arrhenius equation not only demonstrates the interaction of steady-state flow stress, temperature and strain rate, but also quantifies the correlation between microstructure evolution mechanisms and deformation conditions [20,32].
 (7)
(7)
where A is a constant frequency factor, F(��) is a function of flow stress given by
 (8)
(8)
where �� is the true stress (MPa) for a given strain and temperature; ��, ��, n�� and n are the material constants, ��=��/n.
The effects of temperature and strain rate on deformation behaviors at high temperatures are commonly represented by a Zener-Hollomon parameter, Z, in an exponent-type equation shown in Eq. (9).
 (9)
(9)
where is the strain rate, R is the universal gas constant, T is the thermodynamic temperature (K), Q is the activation energy for hot deformation. The following is taking the strain of 0.3 as an example to calculate Q values.
First of all, substitute the F(��) at different stress levels (�˦ҡ�0.8, �˦ҡ�1.2 and all ��) in Eq. (8) into Eq. (9) respectively and take nature logarithms on sides of Eq. (9). The mathematical expressions are shown in the following Eqs. (10)-(12).
 (10)
(10)
 (11)
(11)
 (12)
(12)
Then, the linear relationships of ln �� - and ��- at different temperatures were fitted out as shown in Figs. 12(a) and (b), and the mean slopes in two figures correspond to the reciprocal of n�� and �� respectively. Here, ��=0.030959, n��=5.046, and ��=��/n= 0006136. Subsequently, by partial differentiation of Eq. (12), the n-value and the average activation value Q can be derived from the slopes in linear plotting ln[sinh(�˦�)]- and ln[sinh(�˦�)]-1/T respectively as shown in Figs. 12(c) and (d). Here, n=3.69388, and Q=405.57 kJ/mol.
4.3.2 Deformation activation energy maps
In this work, Q values corresponding to different temperatures and strain rates at strains of 0.3, 0.5, 0.7, 0.9 were calculated respectively via the calculation procedures introduced in Section 4.3.1. Then, the deformation activation energy maps of Ni80A superalloy under the different strains were constructed as shown in Fig. 13. Obviously, at each strain the activation energy distributes similarly with deformation temperature and strain rate. So, we can take the case at the strain of 0.3 [32] as an example to analyze the detailed distribution characteristics of activation energy. The activation energy varies from 325 to 465 kJ/mol with an average value of 407 kJ/mol, and the higher activation energy (>441 kJ/mol) appears at the higher temperatures 1373-1473 K and strain rates 1-10 s-1, while the lower activation energy (<325 kJ/mol) appears at the lower temperatures 1273-1350 K and strain rates 0.016- 0.15 s-1. This phenomenon can be explained from the following two aspects. On one hand, with increasing temperature, the level of dynamic restoration (DRV or DRX) becomes higher [33], which leads to the reduction of dislocation density, i.e. reduction of activation energy. But when the temperature exceeds a certain critical value (about 1370 K), the deformation activation energy turns to increase with increasing temperature due to the full completion of DRX, �á���� phase transformation and re-dissolution of �á� phase. On the other hand, the level of dislocation density is higher at higher strain rates, then dislocation tangles and dislocation intersections will lead to strain hardening, subsequently the activation energy required for further deformation increases [17].
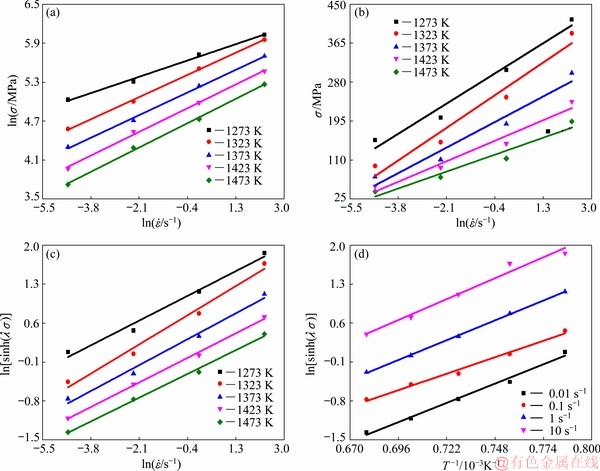
Fig. 12 Linear relationships of ln �� - (a), �� - (b), ln[sinh(�˦�)]- (c) and ln[sinh(�˦�)]-1/T (d)

Fig. 13 Deformation activation energy maps at different temperatures and strain rates under strains of 0.3 (a), 0.5 (b), 0.7 (c) and 0.9 (d)
In the activation energy maps, the domains with activation energy near that of self-diffusion activation energy (about 285 kJ/mol) [34] correspond to DRV mechanism [35], while the domains with activation energy much higher than self-diffusion activation energy correspond to DRX mechanism [22]. Besides, the domains for safe working correspond to the regions where Q is relatively constant [22,27,35]. Thus, in activation energy maps, the desired domains with easy deformation and stable flow correspond to the regions where activation energy is relatively lower and constant [22,33].
4.4 Improved workability based on enhanced processing maps

Fig. 14 Enhanced processing maps by superimposing activation energy maps over deformation mechanism maps at strains of 0.3 (a), 0.5 (b), 0.7 (c) and 0.9 (d)
During the hot working process of Ni80A superalloy, the optimized processing conditions with DRX mechanism should also give relatively lower and fairly constant activation energy. Thus, the DRX parameter domains identified by deformation mechanism map need to be improved further by an enhanced processing map including activation energy indicator. The enhanced processing maps are constructed by superimposing the activation energy maps over the deformation mechanism maps as shown in Fig.14. The instable and DRV regions correspond to red and yellow areas, respectively. In addition, among the superposition area of DRX and activation energy, the contour number corresponds to the efficiency of power dissipation (��) and the color bar represents activation energy value (Q). Eventually, the parameter domains corresponding to DRX mechanism and lower deformation barrier are clarified with white dotted line and are determined as follows: OPT #1-0.3 occurs in the temperature range of 1296-1350 K and narrow strain rate range of 0.056-0.32 s-1, with an average Q value of about 318 kJ/mol; OPT #2-0.3 occurs in the temperature range of 1350-1375 K and narrow strain rate range of 0.035-0.11 s-1, with an average Q value of about 334 kJ/mol; OPT #1-0.5 occurs in the temperature range of 1290-1348 K and narrow strain rate range of 0.2-0.5 s-1, with an average Q value of about 317 kJ/mol; OPT #2-0.5 occurs in the temperature range of 1305-1370 K and narrow strain rate range of 0.035-0.2 s-1, with an average Q value of about 308 kJ/mol; OPT #0.7 occurs in the temperature range of 1290-1355 K and narrow strain rate range of 0.042-0.26 s-1, with an average Q value of about 297 kJ/mol; OPT #0.9 occurs in the temperature range of 1298-1348 K and narrow strain rate range of 0.037-0.224 s-1, with an average Q value of about 307 kJ/mol. Then, superimposing all the ��OPT�� domains mentioned above, a common domain without strain influence is summarized as follows: temperature range of 1314-1348 K and strain rate range of 0.037-0.178 s-1 at all the strains.
5 Conclusions
(1) A series of processing maps including instability parameter and power dissipation efficiency were constructed at strains of 0.3, 0.5, 0.7 and 0.9. Based on the traditional processing maps and microstructural validation, the relationship between deformation mechanism and hot processing parameter was mapped.
(2) A series of deformation activation energy maps at strains of 0.3, 0.5, 0.7 and 0.9 were constructed, the Q values with higher levels appear at higher temperatures and strain rates, while the values with lower levels appear at lower temperatures and strain rates. Taking the strain of 0.3 as an example, the higher activation energy greater than 441 kJ/mol corresponds to 1373-1473 K and 1-10 s-1, while the lower activation energy less than 325 kJ/mol corresponds to 1273-1350 K and 0.016- 0.15 s-1.
(3) A series of enhanced processing maps at discrete strains were constructed by superimposing the activation energy maps on the deformation mechanism maps, and the desired parameter domains corresponding to DRX mechanism and lower energy barrier are finally determined as follows: ��=0.3, 1296-1350 K, 0.056-0.32 s-1, and 1350-1375 K, 0.035-0.11 s-1; ��=0.5, 1290-1348 K, 0.2-0.5 s-1 and 1305-1370 K, 0.035-0.2 s-1; ��=0.7, 1290-1355 K, 0.042-0.26 s-1; ��=0.9, 1298-1348 K, 0.037-0.224 s-1; all strain, 1315-1348 K, 0.037-0.178 s-1.
References
[1] POLLOCK T M, TIN S. Nickel-based superalloys for advanced turbine engines: Chemistry, microstructure and properties [J]. Journal of Propulsion & Power, 2006, 22(2): 361-374.
[2] DONG K K, DONG Y K, RYU S H, DONG J K. Application of Nimonic 80A to the hot forging of an exhaust valve head [J]. Journal of Materials Processing Tech, 2001, 113(1): 148-152.
[3] XU Yu-lai, YANG Cai-xiong, XIAO Xue-shan, CAO Xiu-li, JIA Guo-qing, SHEN Zhi. Evolution of microstructure and mechanical properties of Ti modified superalloy Nimonic 80A [J]. Materials Science & Engineering A, 2011, 530(1): 315-326.
[4] ZHU Yuan-zhi, YIN Zhi-min, XU Jiang-pin. Microstructural mapping in closed die forging process of superalloy Nimonic 80a valve head [J]. Journal of Alloys & Compounds, 2011, 509(20): 6106-6112.
[5] TIAN Bao-hui, ZICKLER G A, LIND C, PARIS O. Local microstructure and its influence on precipitation behavior in hot deformed Nimonic 80a [J]. Acta Materialia, 2003, 51(14): 4149-4160.
[6] PEREZ M. Microstructural evolution of Nimonic 80a during hot forging under non-isothermal conditions of screw press [J]. Journal of Materials Processing Technology, 2018, 252: 45-57.
[7] PRASAD Y V R K, GEGAL H L, DORAIVELU S M, MALAS J C, MORGAN J T, LARK K A, BARKER D R. Modeling of dynamic material behavior in hot deformation: Forging of Ti-6242 [J]. Metallurgical Transactions A, 1984, 15(10): 1883-1892.
[8] CHANG Li-li, ZHENG Li-wei. Isothermal compression behavior and constitutive modeling of Ti-5Al-5Mo-5V-1Cr-1Fe alloy [J]. Transactions of Nonferrous Metals Society of China, 2018, 28: 1114-1122.
[9] ZHU Yan-chun, ZENG Wei-dong, FENG Fei, SUN Yu, HAN Yuan-fei, ZHOU Yi-gang. Characterization of hot deformation behavior of as-cast TC21 titanium alloy using processing map [J]. Materials Science & Engineering A, 2011, 528(3): 1757-1763.
[10] ZHU Rui-hua, LIU Qing, LI Jin-feng, CHEN Yong-lai, ZHANG Xu-hu, ZHENG Zi-qiao. Flow curve correction and processing map of 2050 Al-Li alloy [J]. Transactions of Nonferrous Metals Society of China, 2018, 28(3): 404-414.
[11] LIN Y C, LUO Shun-cun, JIANG Xing-you, TANG Yi, CHEN Ming-song. Hot deformation behavior of a Sr-modified Al-Si-Mg alloy: Constitutive model and processing maps [J]. Transactions of Nonferrous Metals Society of China, 2018, 28(4): 592-603.
[12] CHAMAN-ARA M, EBRAHIMI G R, EZATPOUR H R. Deformation behavior and processing maps of Mg-Zn-Y alloy containing I phase at elevated temperatures [J]. Transactions of Nonferrous Metals Society of China, 2018, 28(4): 629-641.
[13] SUN Cui-cui, LIU Ke, WANG Zhao-hui, LI Shu-bo, DU Xian, DU Wen-bo. Hot deformation behaviors and processing maps of Mg-Zn-Er alloys based on Gleeble�C1500 hot compression simulation [J]. Transactions of Nonferrous Metals Society of China, 2016, 26(12): 3123-3134.
[14] EZATPOUR H R, SAJJADI S A, SABZEVAR M H, CHAICHI A, EBRAHIMI G R. Processing map and microstructure evaluation of AA6061/Al2O3 nanocomposite at different temperatures [J]. Transactions of Nonferrous Metals Society of China, 2017, 27(6): 1248-1256.
[15] ZHANG Yan-qiu, JIANG Shu-yong, ZHAO Ya-nan, LIU Si-wei. Constitutive equation and processing map of equiatomic NiTi shape memory alloy under hot plastic deformation [J]. Transactions of Nonferrous Metals Society of China, 2016, 26(8): 2152-2161.
[16] WANG L, LIU F, CHENG J J, ZUO Q, CHEN C F. Hot deformation characteristics and processing map analysis for nickel-based corrosion resistant alloy [J]. Journal of Alloys & Compounds, 2015, 623: 69-78.
[17] MOHAMADIZADEH A, ZAREI-HANZAKI A, ABEDI H R. Modified constitutive analysis and activation energy evolution of a low-density steel considering the effects of deformation parameters [J]. Mechanics of Materials, 2016, 95: 60-70.
[18] MOKDAD F, CHEN D L, LIU Z Y, NI D R, XIAO B L, MA Z Y. Three-dimensional processing maps and microstructural evolution of a CNT-reinforced Al-Cu-Mg nanocomposite [J]. Materials Science & Engineering A, 2017, 702: 425-437.
[19] ZHANG Chi-zhang, ZHANG Li-wen, SHEN Wen-fei, XU Qian-hong, CUI Yan. The processing map and microstructure evolution of Ni-Cr-Mo-based C276 superalloy during hot compression [J]. Journal of Alloys & Compounds, 2017, 728: 1269-1278.
[20] MOHAMADIZADEH A, ZAREI-HANZAKI A, ABEDI H R, MEHTONEN S, PORTER D. Hot deformation characterization of duplex low-density steel through 3D processing map development [J]. Materials Characterization, 2015, 107: 293-301.
[21] LAI Lin, ZHANG Kui, MA Ming-long, LI Xing-gang, LI Yong-jun, SHI Guo-liang, YUAN Jia-wei. Hot deformation behavior of AZ40 magnesium alloy at elevated temperatures [J]. Journal of Wuhan University of Technology��Mater Sci Ed, 2017, 32(6): 1470-1475.
[22] SUN Yu, WAN Zhi-peng, HU Lian-xi, REN Jun-shuai. Characterization of hot processing parameters of powder metallurgy TiAl-based alloy based on the activation energy map and processing map [J]. Materials & Design, 2015, 86: 922-932.
[23] ZHANG Rui, WANG Dong-jun, LIU Shi-qiu, DING Hong-sheng, YUAN Shi-jian. Hot deformation characterization of lamellar Ti-43Al-2Si alloy fabricated by cold crucible continuous casting [J]. Journal of Alloys & Compounds, 2016, 688: 542-552.
[24] GHASEMI E, ZAREI-HANZAKI A, FARABI E, TESAR K, JAGER A, REZAEE M. Flow softening and dynamic recrystallization behavior of BT9 titanium alloy: A study using process map development [J]. Journal of Alloys & Compounds, 2017, 695: 1706-1718.
[25] LI Peng-wei, LI Hui-zhong, LAN Huang, LIANG Xiao-peng, ZHU Ze-xiao. Characterization of hot deformation behavior of AA2014 forging aluminum alloy using processing map [J]. Transactions of Nonferrous Metals Society of China, 2017, 27(8): 1677-1688.
[26] QUAN Guo-zheng, ZHANG Le, WANG Xuan, LI Yong-le. Correspondence between microstructural evolution mechanisms and hot processing parameters for Ti-13Nb-13Zr biomedical alloy in comprehensive processing maps [J]. Journal of Alloys & Compounds, 2016, 698: 178-193.
[27] QUAN Guo-zheng, ZHAO Lei, CHEN Tao, WANG Yang, MAO Yuan-ping, LV Wen-quan, ZHOU Jie. Identification for the optimal working parameters of as-extruded 42CrMo high-strength steel from a large range of strain, strain rate and temperature [J]. Materials Science & Engineering A, 2012, 538(3): 364-373.
[28] PU En-xiang, ZHENG Wen-jie, SONG Zhi-gang, FENG Han, DONG Han. Hot deformation characterization of nickel-based superalloy UNS10276 through processing map and microstructural studies [J]. Journal of Alloys & Compounds, 2017, 694: 617-631.
[29] HE Dao-guang, LIN Y C, HUANG Jian, TANG Yi. EBSD study of microstructural evolution in a nickel-base superalloy during two-pass hot compressive deformation [J]. Advanced Engineering Materials, 2018, 20: 1800129.
[30] HE Dao-guang, LIN Y C, CHEN Jian, CHEN Dong-dong, HUANG Jian, TANG Yi, CHEN Ming-song. Microstructural evolution and support vector regression model for an aged Ni-based superalloy during two-stage hot forming with stepped strain rates [J]. Materials & Design, 2018, 154: 51-62.
[31] DU Zhi-hao, JIANG Shao-song, ZHANG Kai-feng. The hot deformation behavior and processing map of Ti-47.5Al-Cr-V alloy [J]. Materials & Design, 2015, 86(7): 464-473.
[32] WU Yun-sheng, ZHANG Mai-cang, XIE Xi-shan, DONG Jian-xin, LIN Fu-sheng, ZHAO Shuang-qun. Hot deformation characteristics and processing map analysis of a new designed nickel-based alloy for 700 ��C A-USC power plant [J]. Journal of Alloys & Compounds, 2016, 656: 119-131.
[33] WANG S, HOU L G, LUO J R, ZHANG J S, ZHUANG L Z. Characterization of hot workability in AA 7050 aluminum alloy using activation energy and 3-D processing map [J]. Journal of Materials Processing Technology, 2015, 225: 110-121.
[34] EDALADI K, HORITA Z. Correlations between hardness and atomic bond parameters of pure metals and semi-metals after processing by high-pressure torsion [J]. Scripta Materialia, 2011, 64(2): 161-164.
[35] ZHANG Jing-qi, DI Hong-shuang, WANG Hong-tao, MAO Kun, MA Tian-jun, CAO Yu. Hot deformation behavior of Ti-15-3 titanium alloy: A study using processing maps, activation energy map, and Zener�CHollomon parameter map [J]. Journal of Materials Science, 2012, 47(9): 4000-4011.
Ȩ����1,2���� ��1���� ��1���� ��3��ʩ���1
1. �����ѧ ���Ͽ�ѧ�빤��ѧԺ ��е���������ص�ʵ���ң����� 400044��
2. ���пƼ���ѧ ���ϼӹ���ģ���������ص�ʵ���ң��人 430074��
3. �廪��ѧ ����������Դ�����о�Ժ �Ƚ����ܼ���Эͬ�������� �Ƚ���Ӧ�ѹ����밲ȫ�������ص�ʵ���ң����� 100084
ժ Ҫ���ܹ��յ�����ϸ���Ķ�̬�ٽᾧ���λ������ڱ��β��������Գ��ι��յ���ƾ�����Ҫ���塣����Ni80A ���ºϽ����¶ȷ�Χ1273~1473 K��Ӧ�����ʷ�Χ0.01~10 s-1�ڽ��е���ѹ�����飬���ݴ˽����ӹ�ͼ����ϼӹ�ͼ������֯��֤�������ڱ��λ���ͼ��ʶ�����̬�ٽᾧ��Ӧ�IJ������⣬��������������ݵļ�����ָ���һ���Ż���һ���������գ�������Ľ���ļӹ�ͼ������ö�Ӧ��̬�ٽᾧ���λ��ƺͽϵͼ����ܵ����Ų��������£�Ӧ��Ϊ0.3ʱ��������Ϊ 1296~1350 K��0.056~0.32 s-1 �� 1350~1375 K��0.035~0.11 s-1��Ӧ��Ϊ0.5ʱ��������Ϊ 1290~1348 K��0.2~0.5 s-1 �� 1305~1370 K��0.035~0.2 s-1��Ӧ��Ϊ0.7ʱ��������Ϊ 1290~1355 K��0.042~0.26 s-1��Ӧ��Ϊ0.9ʱ��������Ϊ1298~1348 K��0.037~0.224 s-1��
�ؼ��ʣ��������ºϽ𣻱��μ����ܣ��ӹ�ͼ����̬�ٽᾧ
(Edited by Xiang-qun LI)
Foundation item: Project (cstc2018jcyjAX0459) supported by Chongqing Basic Research and Frontier Exploration, China; Project (P2017-020) supported by Open Fund Project of State Key Laboratory of Materials Processing and Die & Mould Technology, China; Project (SKLMTZZKT-2017M15) supported by Research Project of State Key Laboratory of Mechanical Transmission, China
Corresponding author: Guo-zheng QUAN; Tel: +86-15922900904; Fax: +86-23-65111493; E-mail: quangz3000@sina.com, xwthu@mail.tsinghua.edu.cn
DOI: 10.1016/S1003-6326(19)65052-1

