J. Cent. South Univ. (2016) 23: 2373-2381
DOI: 10.1007/s11771-016-3296-5

Discrete element method analysis of lateral resistance of fouled ballast bed
XU Yang(��D)1, 2, 3, GAO Liang(����)1, 2, 3, ZHANG Yan-rong(������)1, 2, 3,
YIN Hui(����)4, CAI Xiao-pei(����)1, 2, 3
1. School of Civil Engineering, Beijing Jiaotong University, Beijing 100044, China;
2. Key Laboratory of Rail Track Engineering of Beijing, Beijing 100044, China;
3. State Key Laboratory of Rail Traffic Control and Safety, Beijing 100044, China;
4. School of Computer and Information Technology, Beijing Jiaotong University, Beijing 100044, China
 Central South University Press and Springer-Verlag Berlin Heidelberg 2016
Abstract: The lateral resistance of sleeper plays an important role in ensuring the stability of a railway track, which may change in the operation of railway, due to the fouling in the ballast bed. In this work, discrete element method was adopted to investigate the effect of fouling on the lateral resistance of sleeper. The shape information of ballast was captured by method of three-dimensional vision reconstruction. In order to calibrate the mechanical parameters and verify the models, a lateral resistance field test was carried out by using a custom-made device. The contact force distributions in the different parts of sleeper as well as the interaction between ballast and sleeper were discussed in depth. The results show that fouling of ballast bed evidently reduces the lateral resistance of sleeper and the decreasing degree is also related to the fouled position of ballast bed, in the order of shoulder > bottom > side. Therefore, the effect of fouling, especially the fouling in the ballast shoulder, on the lateral resistance of sleeper, should be taken into account in ballast track maintenance work.
Key words: discrete element modelling; three-dimensional vision reconstruction; ballast; lateral resistance of sleeper; ballast fouling
1 Introduction
The ballast bed is one of the most important parts of the railway track structure, which plays vital roles in hindering the failure of the subgrade even after millions of loading cycles due to its considerable effects on attenuating vertical stresses [1-2]. The lateral resistance of sleeper provided by ballast bed contributes a lot to prevent temperature-induced buckling, therefore it is quite important in the context of continuously welded tracks being widely used nowadays. Much research [3-5] has been dedicated to investigate the lateral resistance of sleeper. It has been widely accepted that the lateral resistance of the sleeper mainly originates from the interaction between the three parts (bottom, side, end) of sleeper and ballast bed. It is well known that ballast bed may suffer from fouling due to the degradation of ballast and the progressive accumulation of fines within the ballast voids, which will greatly reduce the shear strength of the ballast bed, according to the references [6]. In that case, the lateral resistance of sleeper maybe change because of the fouling in the ballast bed. However, so far, little research reported the effects of fouling in the ballast bed on the lateral resistance of sleeper. Meanwhile, current research [7-8] on the lateral resistance is often carried out from an experimental point of view, the relevant research about the effect of ballast fouling on lateral resistance are rarely found in the literatures.
In this work, the effects of fouling in the ballast bed on the lateral resistance were systematically investigated on the basis of a discrete element method, and a lateral resistance field test was carried out by using a custom- made device. The contact force distributions in different parts of a sleeper with varied fouling level were studied in detail. Finally, the working mechanism of the fouling in different parts of the railway sleeper affecting the lateral resistance was studied.
2 Process of numerical models establishing
Due to the discrete nature of ballast, the discrete element method (DEM) [9] has been used to simulate the ballast in this study. Because ballast shape has significant influence on ballast interaction [10], the simulation of irregular shape of ballast plays an important role in the models establishing process and has significant influence on simulated results [11].
In this wrok, a 3D digital reconstruction method based on the binary profile of ballast was employed to obtain the spatial coordinates of the ballast shape, as shown in Fig. 1. Two mirrors are used to obtain a binary profile of ballast.
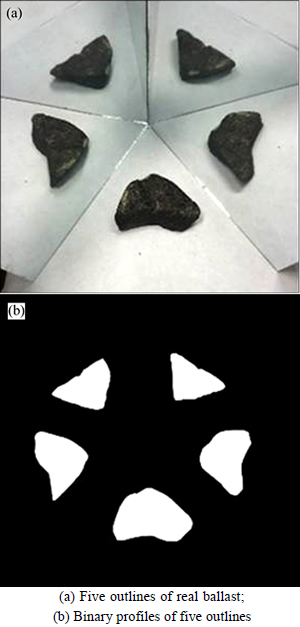
Fig. 1 Reflected images from two mirrors, and ballast binary profile obtained by MATLAB:
According to the existing literature [12-13], the spatial surface grid can be acquired based on the five binary profiles of ballast.
After inputting the spatial grid coordinates of the ballast shape into the DEM software, inlaid spheres were used to fill the grid for simulating the ballast shape. Figure 2(a) shows the real ballast; Fig. 2(b) represents the 3D digital ballast grid; Fig. 2(c) represents the fill process; and Fig. 2(d) represents the DEM numerical model.
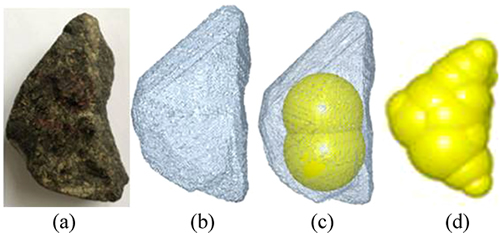
Fig. 2 Real ballast (a), 3D ballast mesh (b), Fill process (c), and DEM ballast model (d)
Based on the analysis on a large number of ballast, the ballast shape could be roughly divided into five typical ballast shapes, as shown in Fig. 3, including (a) triangle type, (b) tetrahedral type, (c) sheet type, (d) strip type, and (e) pyramid type. In the model generation process, ballast shapes were selected randomly from these five shapes to represent all ballast shapes.
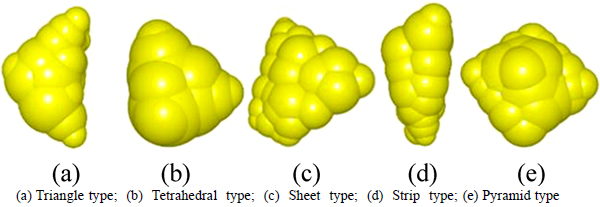
Fig. 3 DEM models of ballasts with typical shapes:
Because the repetitive computing of the overlapped mass of clump will cause the mass uneven distribution. And this affects the moment of inertia and density of the clump. Thus, a modified mass according to the following equation was used for each clump.
 (1)
(1)
 (2)
(2)
 (3)
(3)
where M represents the entire mass of the ballast clump; n represents the total number of balls in a clump; ��b is the density of ballast; Vi represents the volume of Balli subtracting its overlapping volume (Viq) with other balls; r is the number of balls overlapping with Balli; Hq is the segment length of Balli cut by Balliq; and Ri is the radius of Balli.
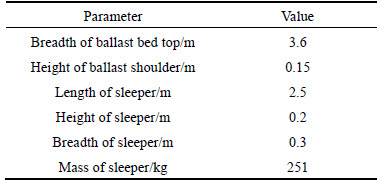
The model boundary consists of three walls (one bottom and two lateral walls) shown in Fig. 4, and the detailed geometric parameters are listed in Table1.
The whole model generation process was divided into 8 steps. (a) Set the boundary of the model. (b) Generate ballasts in the simulated boundary. (c) Increase the gravity six times, and allow the ballasts to fall freely. (d) Generate the ballasts above the existing ballast layer. (e) Set the sleeper on the top of the ballast bed. (f) Compact the sleeper and heap the shoulder of the bed with ballasts. (g) Trim the shoulder and side slop. (h) Set the gravity to the normal value, and rebalance the model before actual calculations as shown in Fig. 5.
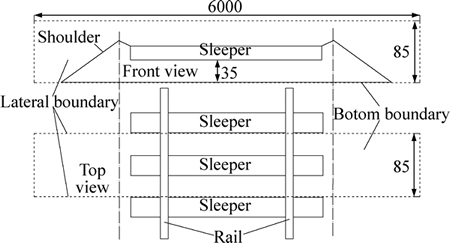
Fig. 4 Simulated boundary of DEM model
Table 1 Parameters of sleeper and ballast bed
In the process of model building, because the free falling of the ballasts in normal gravity cannot produce ideal compactness, extra gravity (six times) is adopted only for the ballast fall process. After the ballast free fall process is completed, the gravity is reset to standard values (9.8 m/s2) and the mode is rebalanced to ensure sufficient compactness. According to the actual constructing process, the ballasts are paved twice before setting the sleepers. And the enlargement of the shoulder of ballast bed is shown in Fig. 6.
There are mainly two types of methods are used for simulating the fouled ballast. 1) The fouled ballast is simulated by reducing the ballast surface friction angle [14-17]; this method saves considerable computing resources, but the process of calibrating the surface friction angle is complex. 2) A direct stress test is performed on fouled ballast by injecting small particles into the voids between ballast particles [6, 18-19]; this method is more close to the real situation that fouling is caused by fine particles accumulate in the voids of ballast. Thus, this means was adopted in this work, the comparison of clean and fouled ballast numerical models are shown in Fig. 7.
Based on the field sieving results of a previous study, coal granules are found to be the main fouling material and are also regarded as the most typical fouling material. Thus, coal granules were used to represent fouled particles. Different DEM models of different fouling conditions were built for study the effect of fouling on the lateral resistance of sleeper. The sleeper moved at a horizontal speed of 1 mm/min (equal to the speed of field test), and every sleeper was pushed to a total distance of 8 mm. The lateral resistance and displacement curves were recorded.
3 Simulating parameters
To calibrate the micromechanical parameters of the DEM model and verify the model, a series of lateral resistance field tests were carried out by using custom- made devices, as shown in Figs. 8 and 9. Specifically,a hydraulic jack was employed to push the sleeper whilst a pressure sensor was fixed on the jack for monitoring the horizontal thrust and a displacement sensor was fixed on the other end of the sleeper for measuring the horizontal displacement. Both sensors were connected to a data acquisition unit and a computer. Thus, the on-line data could be visualized and recorded.
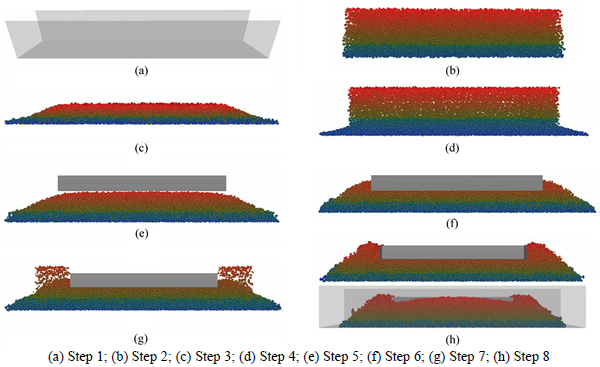
Fig. 5 Model generation process:
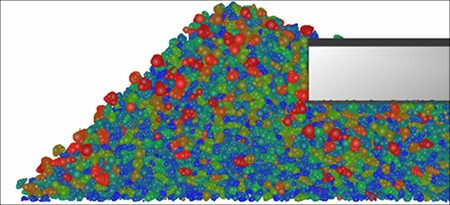
Fig. 6 Enlargement of shoulder of ballast bed
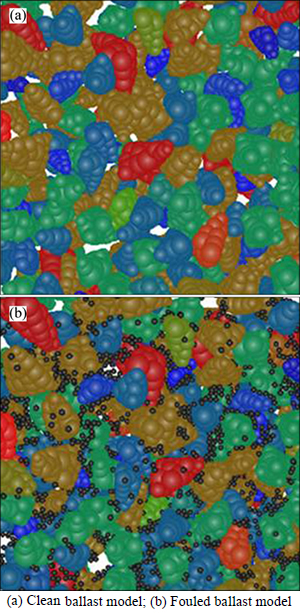
Fig. 7 Comparison of clean and fouled ballast model:
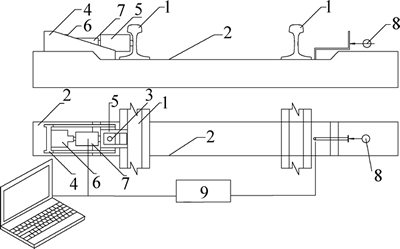
Fig. 8 Sketch of lateral resistance field test device (1-Rail; 2-Sleeper; 3-Spike; 4-Rack; 5-Steel plate; 6-Jack; 7-Loadcell; 8-Displacement meter; 9-Data collection system)
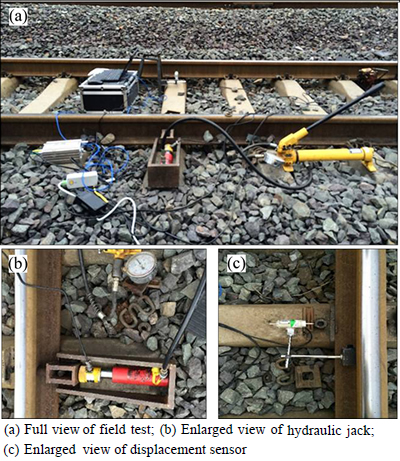
Fig. 9 Photographs of lateral resistance field test:
The lateral resistances of ballast were tested before and after the ballast was cleaned, respectively. The tests were conducted on the same day to diminish the measuring errors caused by physical conditions. The rubber blanket and the fastener of the sleeper were dismantled to ensure that the contact occurs only between the sleeper and the ballast in the test process. The Chinese type-II concrete sleeper was used in the field tests as well as in the numerical simulation using the DEM model. The parameters of the sleeper and ballast bed of field tests are listed in Table 1.
The mean values of 15 sleepers for each condition were tested as the final lateral resistance. Meanwhile, the tests were conducted for a span of three sleepers to avoid the interference by the adjacent sleepers. Based on the field test results, the DEM model was calibrated.
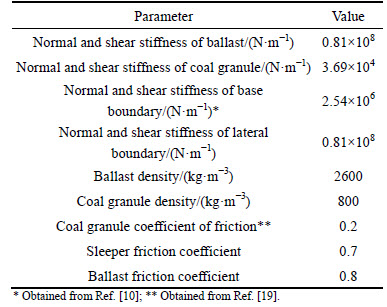
The process of parameter calibration is divided into the following two steps: 1) Testing different stiffness of ballast until the DEM results are quite close to the field test data for clean ballast; 2) Predicting the field test data for fouled ballast with different stiffness of fouled granules; These parameters are not considered to be valid until they are consistent with the field test data of the cleaned ballast and could accurately predict the field test data of the fouled ballast. After numerous simulations, the field test data are in good agreement with the numerical results, as shown in Fig. 10. Consequently, a set of micromechanical parameters were obtained and listed in Table 2, which will be adopted for modelling the ballast track in the next section.
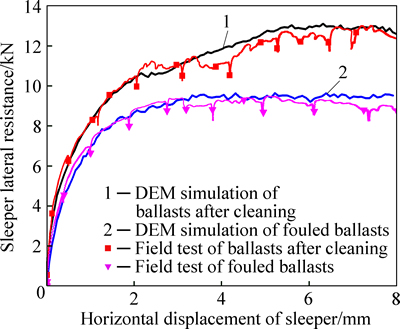
Fig. 10 Comparison of DEM and field test results
Table 2 Mechanical parameters
To determine the gradation of the ballast and fouled granule of the DEM model, the ballast was sieved. Figures 11 and 12 show the process and the results of sieving the fouled ballast.
Ballast gradation was carried out in the DEM model in accordance with the clean ballast gradation curve (blue curve). On the basis of the sieving results, the fouled ballast was simulated using 1.5-mm-diameter spheres.
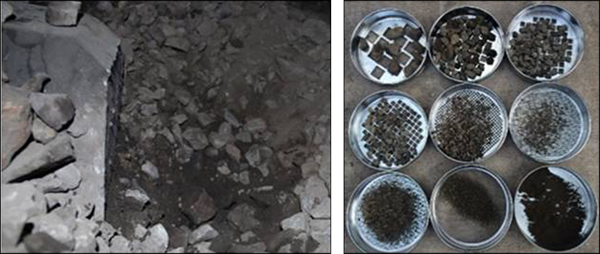
Fig. 11 Sieving of fouled ballast
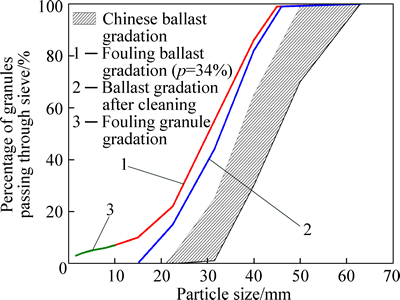
Fig. 12 Gradation curve of clean and fouled ballasts
To evaluate the fouling degree of the ballast bed, the fouling degree percentage index P is defined as
 (4)
(4)
where Vv represents the volume of the total voids among the ballasts and Vf denotes the total volume of fouled granules in the voids among the ballasts. To study the effect of ballast bed fouling on the lateral resistance of sleeper, different numerical models of ballast bed for the different fouling conditions (fouling indices P=0, 11%, 22%, 34%) were built.
4 Results
The lateral resistance of the sleeper consists of three parts: the bottom resistance, side resistance, and end resistance. Figures 13, 14 and 15 exhibit the change of total resistance and the distributional resistance of the three parts (bottom, side, and end) with the different fouling degrees.
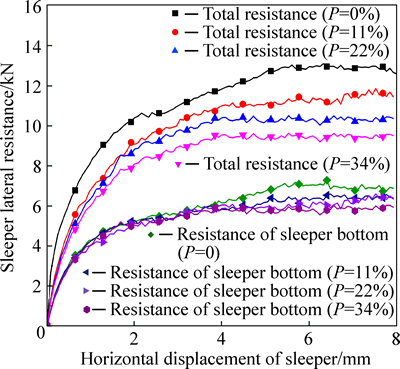
Fig. 13 Comparison of lateral resistance of sleeper bottom
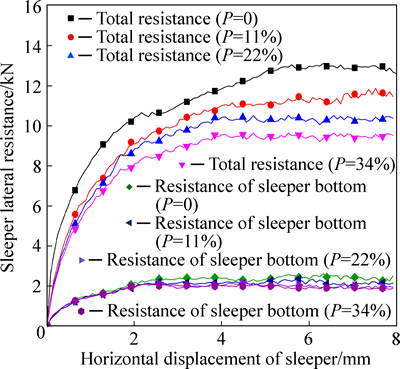
Fig. 14 Comparison of lateral resistance of sleeper side
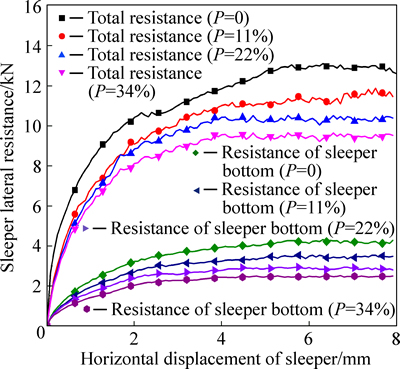
Fig. 15 Comparison of lateral resistance of sleeper
To study the composition relationship of the distributional lateral resistance provided by the sleeper bottom, side, and end to the total lateral resistance, I(b,s,e) was defended and it represents the ratio of lateral resistance supplied by sleeper (bottom, side, end) to total lateral resistance.
 (5)
(5)
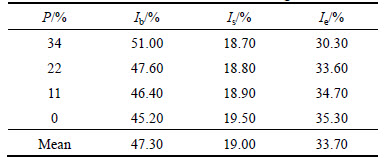
where DT represents the total lateral resistance of the sleeper, and D(b, s, e) signifies the distributional lateral resistance provided by the sleeper bottom, side, and end. When the fouling index is P=34%, the composition relationship of distributional lateral resistance to the total lateral resistance is shown in Fig. 16.
As listed in Table 3 and shown in Figs. 13, 14 and 15, for the Chinese type-II sleeper, the majority of the lateral resistance, 45%-50%, is provided by the sleeper bottom, followed by the sleeper end (33%-35%) and the sleeper side (18%-20%). Furthermore, as the fouling condition becomes worse, the contributions of the sleeper end to the lateral resistance declines.
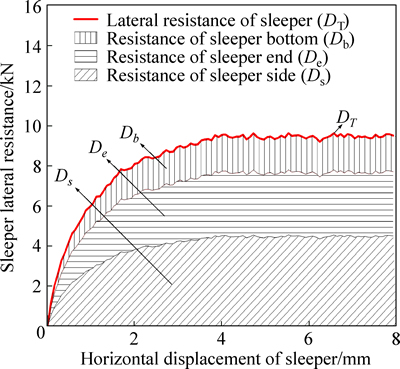
Fig. 16 Composition relationship of lateral resistance when P=34%
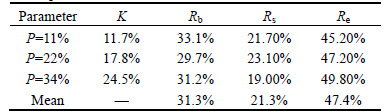
Table 3 Composition relationship of different parts of sleeper to entire lateral resistance under different fouling conditions
To evaluate the reduction ratio of the entire lateral resistance caused by fouling to the lateral resistance of the clean ballast bed, the K (Ratio of lateral resistance reduction caused by fouling compared to clean ballast lateral resistance) is defined as
 (6)
(6)
 (7)
(7)
where Cb, Cs, and Ce are defined as the values of the lateral resistance reduction generated in the sleeper bottom, side, and end, respectively; Dc denotes the total sleeper lateral resistance of the clean ballast bed. The composition relationship of lateral resistance reduction for P=34% is shown in Fig. 17.
To analyze the ratio of resistance reduction due to each part of the sleeper to the total resistance reduction, R(b, s, e) is defined in Eq. (8). It represents the ratio of lateral resistance reduction of sleeper (bottom, side, end) to total lateral resistance reduction.
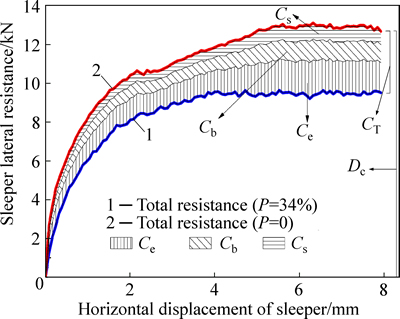
Fig. 17 Composition relationship of lateral resistance reduction
 (8)
(8)
It is clearly seen from Table 4 that the resistance gradually reduces with the increase of the fouling degree. The resistance of ballast with a contamination ratio of P=34%, falls by 24.5% compared to the resistance of clean ballast.
Table 4 Percentage ratio of resistance reduction of three parts of sleeper to total resistance reduction
As shown in Figs. 13, 14 and 15, in the initial stage (0-2 mm) of lateral movement of the sleeper, a small displacement can produce a large resistance. The resistance increases linearly with the movement of the sleeper. However, when the displacement of the sleeper exceeds a certain value (3 mm), the resistance slightly increases, which means that the ballast bed around the sleeper undergoes shear failure.
By comparing the values of Ib listed in Table 3 and the graph shown in Fig. 13, it can be seen that the lateral resistance of the sleeper bottom contributes to the majority (approximately 47%) of the total lateral resistance. However, based on the values of Rb listed in Table 4, the resistance reduction caused by the sleeper bottom accounts for only 31% of the total resistance reduction. It means that the sleeper bottom is not the mainly part which causes the lateral resistance reduction in fouling condition. The main contact force distribution of the sleeper bottom is shown in Fig. 18. The red lines represent the tangential contact force that is greater than the double mean of normal contact force.
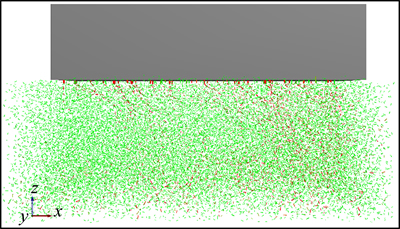
Fig. 18 Force chain distribution of sleeper bottom
It is noticeable from Fig. 18, the ballast particles that directly contact with the undersurface of the sleeper contribute a lot to the resistance of sleeper, while the ballast in the deep layer of the ballast bed is hardly affected by sleeper movement. This indicating that the lateral resistance of the ballast bottom is mainly dependent on the point-surface contact between the sleeper undersurface and the top ballasts rather than the entire ballast under the sleeper. And it is the reason that fouling not markedly reduce the resistance provided by the sleeper bottom.
By comparing the data in Fig. 14 and Table 3, it can be seen that the resistance provided by the sleeper side accounts for only approximately 19% of the total ballast resistance. Both the side and bottom surfaces of the sleeper are in contact with ballast during point-surface contact. The side of the sleeper contributes only a small proportion of the lateral resistance. The resistance reduction of the sleeper side caused by fouling accounts for only 21% of the total resistance reduction. Analysis results also show that the fouling degree exerts little effect on the resistance of the sleeper side.
Comparing the values of Ie listed in Table 3 and the graph shown in Fig. 15, it can be seen that the lateral resistance provided by the sleeper end accounts for approximately 34% of the total ballast resistance. However, the values of Re listed in Table 4 show that the resistance reduction of the sleeper end caused by fouling accounts for 47.7% of the total resistance reduction, which is a high percentage. Figure 19 shows the force chain distribution of the sleeper end when the sleeper moves laterally.
It can be seen that the surface area of the sleeper end is the least among the three parts (end, bottom, and side) of the sleeper. However the influence region of the ballast bottom and side is mainly confined to the superficial ballasts, which are in direct contact with the sleeper surface. However, the sleeper end almost affects the entire amount of shoulder ballasts of the ballast bed when the sleeper is moving. This indicates that more ballast participate in the resistance distribution at thesleeper end. It can also be seen from the force chain distribution in Fig. 19 that the lower part (red lines) of the shoulder ballast supplies more lateral resistance than the upper part of the shoulder ballast. It means that increasing the pile height of the shoulder will increase the pressure and friction on the lower part of the shoulder ballasts. Furthermore, it can be noted that the resistance provided by ballast far away from the sleeper end reduces. This indicates that once a certain range is exceeded, increasing the shoulder width is ineffective in increasing the ballast lateral resistance. A more economical solution would be to increase the height of the ballast shoulder.
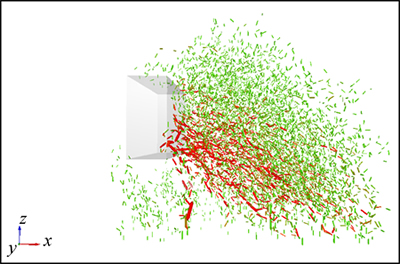
Fig. 19 Force chain distribution of sleeper end
5 Conclusions
1) The mechanisms of resistance provided by the three parts of the sleeper are different. Therefore, ballast fouling has different effects on the lateral resistance of each part of the sleeper. 47% of the total reduction in lateral resistance occurs in the sleeper end. Thus, more attention should be focused on the ballast shoulder during daily maintenance.
2) For the Chinese type-II sleeper, the sleeper resistance provided by the sleeper bottom accounts for the largest percentage of the total resistance (45%�C50%), followed by the sleeper end (33%�C35%) and the sleeper side (18%�C20%).
3) Ballast fouling can weaken the lateral resistance of the ballast bed. When the fouled index P=34%, the lateral resistance reduces by 24.5%. During ballast bed maintenance, close attention should be paid to the fouling situation of the ballast bed.
4) Lateral resistance changes with the horizontal displacement of the sleeper in two stages. The first stage is the effective resistance stage (0-2 mm), in which a small displacement can produce a large resistance. The resistance grows linearly with the movement of the sleeper. The second stage is the failure stage (3-8 mm), in which the resistance no longer grows with an increase in the relative displacement between the sleeper and ballast. This indicates that the ballast bed around the sleeper experiences shear failure.
5) For the sleeper end, if the width of the ballast shoulder exceeds a certain range, increasing the height of the ballast shoulder is more useful than increasing the width of the shoulder for enhancing the ballast lateral resistance.
In this work, only the lateral resistance is analyzed. In future studies, the effect of fouling on the longitudinal resistance and the prioritization scheme for the maintenance cycle of the ballast bed will be investigated based on the results of the fouling effect.
References
[1] LI Ding-qing, SELIG E T. Method for railroad track foundation design. I: Development [J]. Journal of Geotechnical and Geoenvironmental Engineering, 1998, 124(4): 316-322.
[2] LI Ding-qing, SELIG E T. Method for railroad track foundation design. II: Applications [J]. Journal of Geotechnical and Geoenvironmental Engineering, 1998, 124(4): 323-329.
[3] LOUIS L P, POWRIE W. Contribution of base, crib, and shoulder ballast to the lateral sliding resistance of railway track: A geotechnical perspective [J]. Proceedings of the Institution of Mechanical Engineers, Part F: Journal of Rail and Rapid Transit, 2011, 225(2): 113-128.
[4] GAO Liang, GU Ai-jun. Discussion on the new testing method of ballast resistance [J]. Journal of Northern Jiaotong University, 1999, 23(4): 123-127.
[5] ZAKERI J, MIRFATTAHI B, FAKHARI M. Lateral resistance of railway track with frictional sleepers [J]. Proceedings of the Institution of Civil Engineers Transport, 2012, 165(2): 151-155.
[6] INDRARATNA B, NGO N T, RUJIKIATKAMJORN C, VINOD J S. Behavior of fresh and fouled railway ballast subjected to direct shear testing: discrete element simulation [J]. International Journal of Geomechanics, 2014. 14(1): 34-44.
[7] KOC W, WILK A, CHROSTOWSKI P, GRULKOWSJI S. Tests on lateral resistance in railway tracks during the operation of a tamping machine [J]. Proceedings of the Institution of Mechanical Engineers, Part F: Journal of Rail and Rapid Transit, 2011, 225(3): 325-340.
[8] YANG Yan-li. Experimental study on design parameters of longitudinal and lateral resistance of ballast bed for ��-type concrete sleeper [J]. Journal of Railway Engineering Society, 2010, 10: 49-51.
[9] CUNDALL P A, STRACK O D L. A discrete numerical model for granular assemblies [J]. Geotechnique, 1979, 29(1): 47-65.
[10] LU M, MCDOWELL G R. The importance of modelling ballast particle shape in the discrete element method [J]. Granular Matter, 2007, 9(1/2): 69-80.
[11] AIKAWA A. Techniques to measure effects of passing trains on dynamic pressure applied to sleeper bottoms and dynamic behavior of ballast stones [J]. Quarterly Report of RTRI, 2009, 50(2): 102-109.
[12] FORBES K, NICOLLS F, GERHARD D J, VOIGT A. Shape-from- silhouette with two mirrors and an uncalibrated camera [C]// Computer Vision�CECCV 2006. Berlin: Springer, 2006: 165-178.
[13] FORBES K, ANTHON V, BODIKA N. Visual hulls from single uncalibrated snap-shots using two planar mirrors [C]// Proceedings of the 15th Annual Symposium of the Pattern Recognition. Cape Town: Association of South African, 2004: 326-355.
[14] HUANG Hai. Discrete element modeling of railroad ballast using imaging based aggregate morphology characterization [D]. Chicago: Chicago University of Illinois at Urbana-Champaign, 2010.
[15] HUANG Hai, TUTUMLUER E. Discrete Element Modeling for fouled railroad ballast [J]. Construction and Building Materials, 2011, 25(8): 3306-3312.
[16] HUANG Hai, TUTUMLUER E, HASHASH Y M A, GHABOUSSI J. Discrete element modeling of aggregate behavior in fouled railroad ballast [J]. Geotechnical Special Publication, 2009, 192: 33-41.
[17] DOMBROW W, HUANG Hai, TUTUMLUER E. Comparison of coal dust fouled railroad ballast behavior��Granite vs. limestone [C]// Bearing Capacity of Roads, Railways and Airfields. Netherlands: CRC Press, 2009: 1349-1357.
[18] INDRARATNA B, NGO N T, RUJIKIATKAMJORN C. Deformation of coal fouled ballast stabilized with geogrid under cyclic load [J]. Journal of Geotechnical and Geoenvironmental Engineering, 2012, 139(8): 1275-1289.
[19] NGO N T, INDRARATNA B, RUJIKIATKAMJORN C. DEM simulation of the behaviour of geogrid stabilised ballast fouled with coal [J]. Computers & Geotechnics, 2014, 55(1): 224-231.
(Edited by DENG L��-xiang)
Foundation item: Projects(U1234211, 61472029, 51208034) supported by the National Natural Science Foundation of China
Received date: 2015-05-26; Accepted date: 2015-11-15
Corresponding author: GAO Liang, PhD, Professor; Tel/Fax: +86-10-51687243; E-mail: Lgao@bjtu.edu.cn

