
J. Cent. South Univ. (2019) 26: 768-778
DOI: https://doi.org/10.1007/s11771-019-4046-2

Sensitivity analysis of geomechanical parameters affecting a wellbore stability
Abolfazl ABDOLLAHIPOUR1, Hamid SOLTANIAN1, Yaser POURMAZAHERI1,Ezzatollah KAZEMZADEH1, Mohammad FATEHI-MARJI2
1. Division of Petroleum Engineering, Faculty of Upstream Petroleum Industry, Research Institute of Petroleum Industry (RIPI), Tehran 14665-37, Iran;
2. Faculty of Mining and Metallurgical Engineering, Yazd University, Yazd 89195-741, Iran
 Central South University Press and Springer-Verlag GmbH Germany, part of Springer Nature 2019
Abstract: Wellbore stability analysis is a growing concern in oil industries. There are many parameters affecting the stability of a wellbore including geomechanical properties (e.g., elastic modulus, uni-axial compressive strength (UCS) and cohesion) and acting forces (e.g., field stresses and mud pressure). Accurate determination of these parameters is time-consuming, expensive and sometimes even impossible. This work offers a systematic sensitivity analysis to quantify the amount of each parameter��s effect on the stability of a wellbore. Maximum wellbore wall displacement is used as a stability factor to study the stability of a wellbore. A 3D finite difference method with Mohr model is used for the numerical modeling. The numerical model is verified against an analytical solution. A dimensionless sensitivity factor is developed in order to compare the results of various parameters in the sensitivity analysis. The results show a different order of importance of parameters based on rock strength. The most sensitive properties for a weak rock are the maximum horizontal stress, internal friction angle and formation pressure, respectively, while for a strong rock, the most sensitive parameters are the maximum horizontal stress, mud pressure and pore pressure, respectively. The amount of error in wellbore stability analysis inflicted by the error in estimation of each parameter was also derived.
Key words: wellbore stability; sensitivity analysis; numerical modeling
Cite this article as: Abolfazl ABDOLLAHIPOUR, Hamid SOLTANIAN, Yaser POURMAZAHERI, Ezzatollah KAZEMZADEH, Mohammad FATEHI-MARJI. Sensitivity analysis of geomechanical parameters affecting a wellbore stability [J]. Journal of Central South University, 2019, 26(3): 768�C778. DOI: https://doi.org/10.1007/s11771-019- 4046-2.
1 Introduction
Wellbore instability is one of the key challenges influencing the drilling and production operations. Problems associated with it are both time-consuming and expensive. Therefore, an accurate prediction of wellbore state is of paramount importance. There are many parameters affecting the behavior of a wellbore both during drilling and production stages including fluids�� viscous behavior, temperature, etc [1�C3]. Instability mechanisms may be caused by two mechanisms: mechanical interactions by in-situ stresses [4, 5], formation geomechanical properties [6�C8], formation pressure (pore pressure), and physicochemical interactions of drilling fluid and shale formations [9�C14]. YAN et al [1] studied the effects of drilling fluid circulation, drilling fluid density, and mud displacement on the stability of a wellbore in high-temperature formations.
They showed that fracture pressure and closure pressure both increase with the increase of the borehole temperature. Many studies have focused on the effects of well trajectory and stress concentration on the stability of the wellbore [5, 15�C19]. Mostly, the optimized well path has been determined from the mud window and an allowable breakout width. Each parameter affects the stability state of the well differently. Studies show that uncertainty always exists in geoscience input data and this results in uncertainty of the output models [20�C24]. ZHANG et al [25] proposed a probability analysis for coal crushing due to in-situ condition and uncertainty of affecting parameters. Because of limited accessibility to wellbore depth, it is difficult and sometimes even impossible to determine the geomechanical properties with appropriate accuracy. Therefore, the resulted geomechanical modeling of wellbore stability should not be considered as the final evaluation. There is always a level of uncertainty in the final analysis. Sensitivity analysis can determine the effect of each parameter on the wellbore stability problem. SUN et al [26] used sensitivity analysis in a study to evaluate a proposed objective function for soil slope back analyses. HU et al [27] used sensitivity analysis to study the strain-rate sensitivity of a concrete dam to dynamic loading. LUO et al [28] used sensitivity analysis to study the influence of coefficient variation of rock parameters on deep tunnel��s reliability index. HELTON et al [29] presented a sampling method for an efficient sensitivity analysis. Other authors have used this analysis method for numerical modeling optimization, hydraulic fracturing design and other geomechanical applications in jointed rocks [30�C36]. DOU et al [37] studied the sensitivity of stresses in tight reservoirs. They concluded that lower permeabilities of sandstone reservoir results in a stronger stress sensitivity. A complete study on the sensitivity of influencing parameters on the stability of well bores has never been carried out to the best of authors�� knowledge. This study offers a systematic method to quantify this uncertainty. A sensitivity analysis is performed on geomechanical properties affecting the wellbore stability problem. The numerical model is first verified by an analytical solution. Then, the sensitivity analysis has been performed. The sensitivity of each parameter will be determined and in the process, the effect of each parameter��s uncertainty on the final stability analysis will be found.
2 Sensitivity analysis method
Sensitivity analysis is a method of system stability evaluation [38]. It relates the uncertainty in the output of a model to different sources of uncertainty in the model input [39]. In a system that character F is controlled by n factors of ��1, ��2, ��, ��n (i.e., F=f(��1, ��2, ��, ��n)). Sensitivity analysis may be performed by varying each factor in a reasonable range while keeping other factors constant at a base value and observing the changes in the behavior of the character F.
The first step of sensitivity analysis is developing the relationship of factors ��k with the system character F.
 (1)
(1)
The relation should be, if possible, analytical. However, it is not usually possible in case of complex systems. In that case, numerical methods or graphic charts may be also used. The base factors should as closely as possible follow the target system character.
When the effect of factor ��k is studied, it is changed in a reasonable and possible range of values. The character F shows a relation such as Eq. (2).
 (2)
(2)
Figure 1 shows the schematic changes of the F�C��k curve. The steep slope of the curve near ��k1 shows that the character F is very sensitive to changes of ��k near ��k1, on the opposite, the low slope of the curve near ��k2 shows that character F is not affected much by changes of ��k at values close to ��k2.
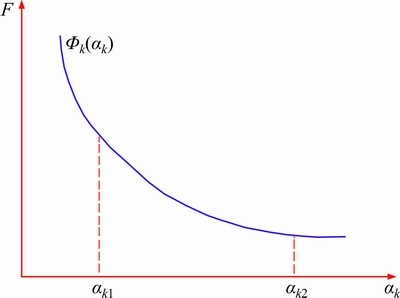
Figure 1 Schematic curve of sensitivity of factor ��k for character F
This sensitivity analysis describes the system sensitivity to a single factor. However, a real-world system character (such as wellbore stability in this study) is governed by several factors (in-situ stresses, geomechanical properties, etc.) with various physical quantities and units. It makes the comparison of sensitivity analysis of different factors difficult. A dimensionless sensitivity analysis should be used to compare various factors�� sensitivity. ABDOLLAHIPOUR et al [21] used a dimensionless sensitivity analysis to study the effect of various parameters on the stability of storage caverns.
The dimensionless sensitivity analysis uses a dimensionless sensitivity function. This function is obtained from the ratio of the relative error of system character ��F (��F=|��F|/F) to factor��s relative error

 (3)
(3)
If  is sufficiently small, the function
  can be approximated by:
 (4)
(4)
Equation (4) results in sensitivity function curve for ��k shown in Figure 2. The sensitivity factor is obtained by substituting ��k with its base value ��k*.
 (5)
(5)
where k=1, 2, ��, n and  are a group of dimensionless and positive real numbers. The higher values of indicate a higher sensitivity of system character F to parameter ��k. A simple comparison of sensitivity factorsreveals intensity of each factor��s effect on the system. Following this method influencing factors may be sorted from the most sensitive to the least sensitive factors.
The described method will be used in sensitivity analysis of factors affecting the stability of a wellbore.
3 Numerical model
A 3D finite difference method is used to study the stability of a wellbore. The maximum wellbore wall displacement is used as a stability criterion. Models with higher displacements are considered more unstable. According to Ref. [21], the sensitivity of parameters may differ in elastic and elastoplastic models [21]. Therefore, two sets of basic geomechanical parameters (i.e., elastic modulus E, Poisson ratio ��, internal friction angle �� and cohesion c) presenting weak and strong rocks are used in the study. Also, an elastoplastic Mohr behavior is considered to fully capture possible plastic part of behaviors. The basic stress field and pressures (i.e., vertical stress ��v, maximum horizontal stress ��h, minimum horizontal stress ��h, formation pressure or pore pressure Pp and mud or wellbore pressure Pw) are the same in both rock types�� models, only geomechanical basic properties are different in two rock types. Tables 1 and 2 present the basic geomechanical and stress sets, respectively. It should be noted that properties shown in Tables 1 and 2 are almost hypothetical. They are chosen so that to present common rock types in petroleum geomechanics studies based on authors experience in the field and a previous study [40].
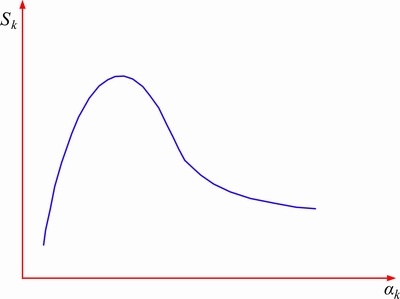
Figure 2 Sensitivity function curve
The modeled wellbore is circular with 10 cm diameter. All boundaries are fixed (i.e., zero displacement boundary condition) and they are considered far enough from the wellbore (20 times the wellbore diameter) to ensure no boundary effect on the wellbore behavior. Figure 3 shows the initial model. Stresses are considered constant in the model and gradual changes are not considered.
Table 1 Basic geomechanical factors set and their varying range
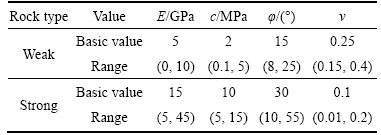
Table 2 Basic in situ stresses and pressures set
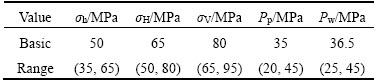
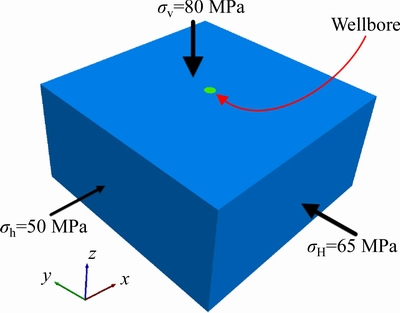
Figure 3 Initial 3D model for wellbore stability analyses
4 Verification of numerical method
A circular borehole in an infinite elasto-plastic material subjected to in-situ stresses is used to verify the accuracy and reliability of the used numerical model in this study. A linearly elastic, perfectly plastic medium with a Mohr-Coulomb criterion is considered for this verification. The results of the simulation are compared with an analytic solution proposed by SALEN ON [41].
Figure 4 shows a sketch of the model used for this analysis. A wellbore of 1 m radius has been used. Elastic modulus of 7 GPa, Poisson ratio of 0.2, friction angle of 30�� and cohesion of 4 MPa is used in this analysis. The wellbore is subjected to a uniform 50 MPa far field stress.
Figure 5 compares the numerical and analytical results for radial and tangential stresses and radial displacements of the problem in Figure 4. As it is seen, the results are in good agreement. Both stresses and radial displacements are predicted with good accuracy. Stresses are approaching the far field value (50 MPa) as they are gaining distance from the wellbore wall (Figure 5(a)). The radial displacement is also approaching zero far away from the wellbore wall (Figure 5(b)). This indicates the accuracy and applicability of the used numerical method in computing reliable stress and displacements of the models in the rest of this work.

Figure 4 Sketch of model used for verification of applied numerical method
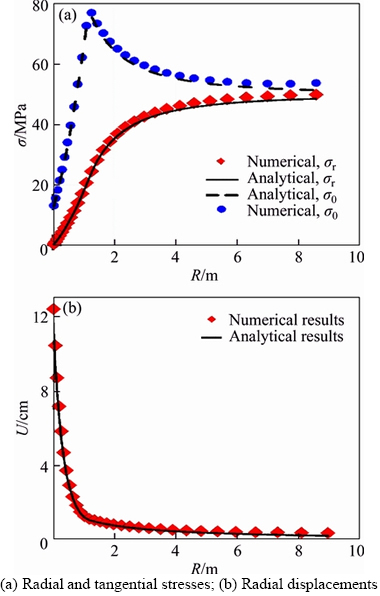
Figure 5 Comparison of numerical and analytical results for a circular hole in an infinite plate problem:
Figure 6 shows displacements around the wellbore wall for the both rock types with the basic values of Tables 1 and 2. Wellbore displacements are 10�� magnified to better show the deformation of the wellbore. As expected, higher displacements have occurred for the weak rock type. The maximum displacement of the wellbore wall is used to compare the stability of different models in the next section.
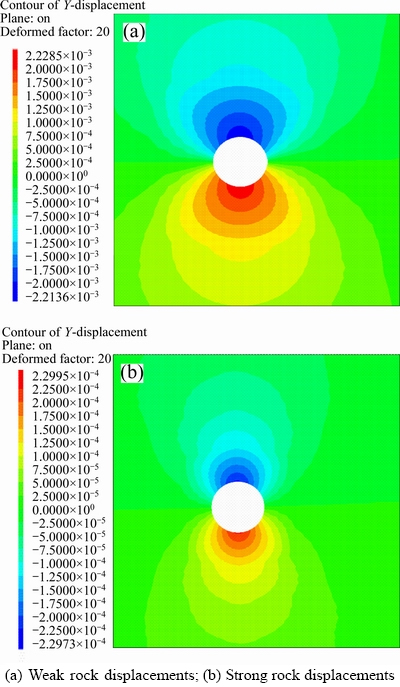
Figure 6 Maximum displacements (in direction of maximum horizontal stress) around wellbores at base values of Tables 1 and 2:
5 Regression analysis
A comprehensive regression analysis was performed on all numerical results in order to find the best possible relation between each factor and wellbore wall displacements. In order to evaluate various possible relations and to avoid disadvantages of linear regression (trying to linearize the model may significantly affect the accuracy of the estimated parameters. In addition to that, there are only a few useful regression models that can be linearized), nonlinear regression analysis was used. The following steps were used in the nonlinear regression.
1) Obtain initial estimates for the variable being fitted for in the model;
2) Compute the merit function (Eq. (6)) according to the initial estimates;
3) Use the Levenberg-Marquardt method algorithm to adjust the variable in order to improve the fit of the model to the data points;
4) Compute the merit function (Eq. (6)) one more time and compare it to the previous iteration;
5) Repeat steps 3) and 4) until the merit function reaches a specified minimum or almost stops decreasing;
6) Calculate the goodness of fit statistics.
The following merit function was minimized in the nonlinear regression analysis:
 (6)
(6)
where ��i is the standard deviation of the ith data point; yi is the actual (numerical) value of wellbore wall displacement; y(xi) is the predicted displacement; xi are independent variables.
6 Dimensionless sensitivity analysis results
The sensitivity of each factor was studied by varying its value in the specified range shown in Tables 1 and 2 while keeping all other factors constant at their basic value. Figures 7�C10 show the sensitivity of wellbore wall displacement as the stability criterion to factors indicated in Tables 1 and 2 for both rock types. The wellbore wall displacements shown almost no sensitivity to vertical stress changes; hence it is not shown in Figures 7 and 8.
As expected, the wellbore wall displacements increase (i.e., wellbore stability decreases) by the increase of in-situ stresses and pore pressure, while an increase of mud pressure or wellbore pressure decreases the wellbore wall displacement (i.e., has increased the wellbore stability). The minimum horizontal stress has distinctively different behavior in the weak and strong rock types. As shown in Figure 7(a), the increase of the minimum horizontal stress has resulted in the increase of displacements, i.e., decrease of stability. On the contrary, the increase of the minimum horizontal stress has resulted in decrease of displacements for the strong rock type in Figure 8(a). By the increase of the minimum horizontal stress, a more uniform stress field, i.e., a litho static stress field emerges. This improves the wellbore stability for a strong rock. However, while approaching the litho static field, stress concentrations grow around the wellbore,causing higher displacements for the weak rock type. The mechanical properties of this rock already show its lack of strength in a high stress fields. At the start of the increase of the minimum horizontal stress in Figure 7(a), the displacements are decreasing. However, as the minimum horizontal stress increases more, the stress concentration around the wellbore exceeds the strength of the weak rock. Since the maximum horizontal stress is constant at this analysis, more increase of the minimum horizontal stress results in higher stress concentration around the wellbore. This has eventually led to the higher displacements in the wellbore wall since it is more and more controlled by plastic properties instead of elastic ones. The maximum horizontal stress seems to have a significant effect on the stability of the wellbore since the results change rapidly around the basic value (��H=65 MPa) both in Figures 7(b) and 8(b) for weak and strong rock types respectively.
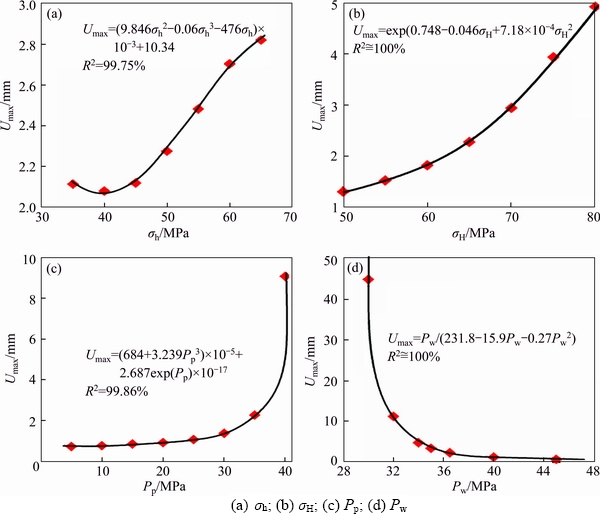
Figure 7 Sensitivity analysis of in-situ stresses and pressures effect on wellbore stability for weak rock type:
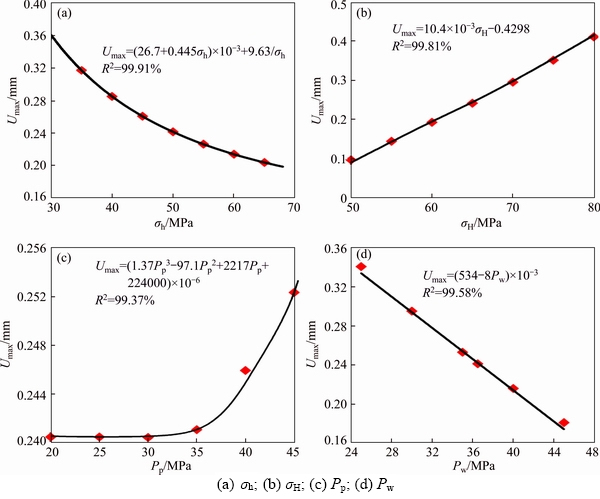
Figure 8 Sensitivity analysis of in-situ stresses and pressures effect on wellbore stability for strong rock type:
Figures 9 and 10 show the effect of geomechanical properties on the well bore stability. The increase of geomechanical properties has increased the stability of the wellbore in all cases except for the Poisson ratio of the strong rock type. The increase of Poisson ratio has increased the wellbore wall displacements at the beginning and then it has started to reduce the displacements.
An accurate decision may not be given on the most sensitive parameters based on Figures 7�C10 alone, since the studied factors have different units and variation range. In order to perform a sensitivity analysis, a relation between the studied factor (e.g., elastic modulus) and system character (e.g., wellbore stability) is needed. The fitted equations in Figures 7�C10 are chosen from numerous possible fitted curves to estimate wellbore wall displacements as closely as possible to the numerical results. These fitted equations are used to quantify the sensitivity on each factor.
As mentioned, one should use dimensionless sensitivity factors to compare sensitivity results.The sensitivity factordefined by Eqs. (4) and (5) has been used to compare the results of various factors.
The derivation of the sensitivity factor for the minimum horizontal stress in Figure 7(a) is given as an example. The basic value for ��h=50 MPa.
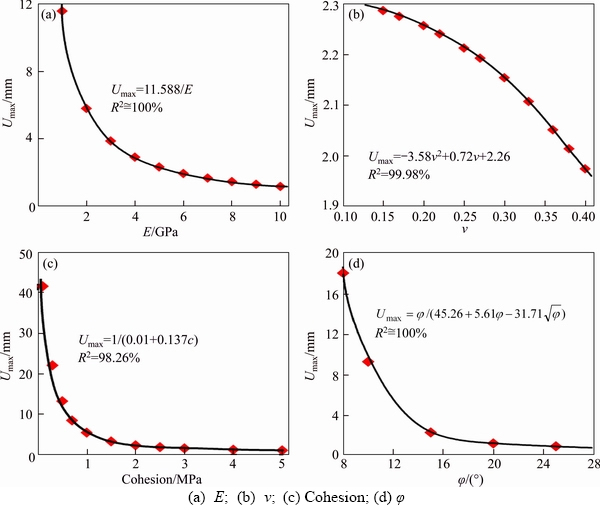
Figure 9 Sensitivity analysis of geomechanical factors on wellbore stability for weak rock type:
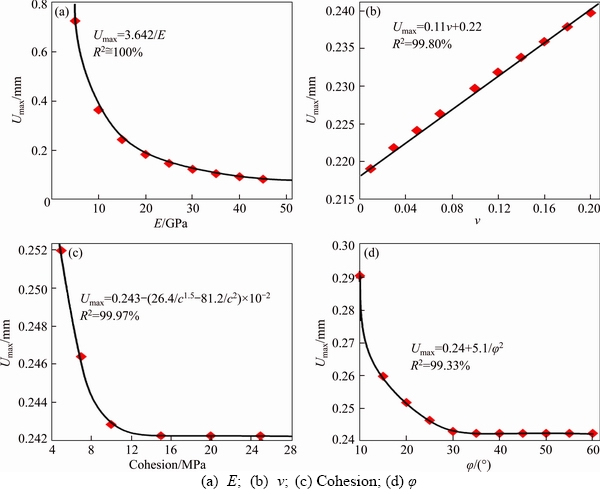
Figure 10 Sensitivity analysis of geomechanical factors on wellbore stability for strong rock type:
 (7)
(7)
Following the same procedure, the sensitivity factor of all studied parameters has been calculated. Tables 3 and 4 present the sensitivity factors for the weak and strong rock types respectively.
Table 3 Sensitivity factors of weak rocks
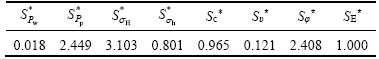
Table 4 Sensitivity factors of strong rocks
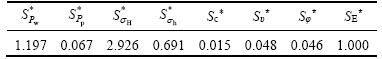
Based on Tables 3 and 4, one can quantify and compare the effect of different factors on wellbore stability. The maximum horizontal stress has the highest effect on the stability in both rock types. Poisson ratio has the lowest effect on weak rock type while cohesion has the lowest effect on strong rock type. Accordingly, the most effective factors for weak rock type are the maximum horizontal stress, pore pressure, internal friction angle and elastic modulus while the most sensitive parameters of strong rock type are the maximum horizontal stress, wellbore pressure and elastic modulus. It is interesting to point out that elastic modulus sensitivity is not affected by rock type. It is always constant and equal to 1. The same result was obtained by ABDOLLAHIPOUR et al [21].
Tables 3 and 4 indicate that when the maximum displacement of the wellbore wall is used to evaluate the stability of the well, then the most sensitive factor that affects the stability is maximum horizontal stress. It has sensitivity as high as 3.103 and 2.926 in weak and strong rock types, respectively. In other words, if there exists an error of 15% in ��H, the relative errors ( ) of Umax are 3.103��15%=46.54% and 2.926��15%=43.89% for weak and strong rock types, respectively. The least sensitive factors are wellbore pressure Pw
  0.018) and friction angle ��
  0.046) in weak and strong rock types, respectively. An error of 15% in Pw and �� results in only 0.27% and 0.69% error of Umax. According to Tables 3 and 4, the maximum horizontal stress and elastic modulus have always high sensitivity factors and should be treated with great care. Also, the weak rock type is generally more sensitive to its inputs since plastic behavior is dominant and system��s response may change considerably by small changes of input factors.
7 Conclusions
A dimensionless sensitivity analysis is performed on wellbore stability. The maximum wellbore wall displacement is chosen as the stability criterion (i.e., wellbores with higher displacement considered more unstable). The dimensionless sensitivity analysis using a sensitivity factor allowed quantifying the amount of error in final wellbore stability estimation based on the uncertainty of basic geomechanical factors and in-situ stresses and pressures. Two sets of geomechanical factors presenting weak and strong rock types are used in the work. The results show that the maximum horizontal stress is the most effective factor in both rock types. Since a vertical wellbore is used in the study, the maximum horizontal stress may be generalized to the maximum stress acting normal to the wellbore axis. An interesting finding is the effect of internal friction angle. It is one of the most effective parameters for weak rocks while it has a very low sensitivity in strong rocks. The Poisson ratio has always a low sensitivity on the results. Another interesting finding is the effect of elastic modulus. It has always the constant sensitivity factor of 1.000. The results of this study may be used in oilfields planning. Taking into account the overall strength of the formations, engineers can plan on the number of needed geomechanical samples and tests for deriving the properties of the field, saving costs on low sensitive parameters and investing on most effective parameters. It should be noted that the vertical stress played no role in sensitivity because a vertical well is studied. In case of a directional well, vertical stress may be also a serious affecting parameter needed to be accounted for.
References
[1] YAN C, DENG J, CHENG Y, LI M, FENG Y, LI X. Mechanical properties of gas shale during drilling operations [J]. Rock Mech Rock Eng, 2017, 50: 1753�C1765.
[2] TABATABAEE M SS, NIKOLAEV N I, CHUDINOVA I V. Geomechanical analysis of Wellbore stability in high- pressure, high-temperature formations [C]// 79th EAGE Conf Exhib 2017. Paris: EAGE, 2017.
[3] TANG Z, LI Q, YIN H. The influence of solute concentration and temperature of drilling fluids on wellbore failure in tight formation [J]. J Pet Sci Eng, 2018, 160: 276�C284. DOI: 10.1016/j.petrol.2017.10.053.
[4] CHERNY S, CHIRKOV D, LAPIN V, MURANOV A, BANNIKOV D, MILLER M, WILLBERG D, MEDVEDEV O, ALEKSEENKO O. Two-dimensional modeling of the near-wellbore fracture tortuosity effect [J]. Int J Rock Mech Min Sci, 2009, 46: 992�C1000. DOI: 10.1016/j.ijrmms. 2009.01.001.
[5] MANSOURIZADEH M, JAMSHIDIAN M, BAZARGAN P, MOHAMMADZADEH O. Wellbore stability analysis and breakout pressure prediction in vertical and deviated boreholes using failure criteria�CA case study [J]. J Pet Sci Eng, 2016, 145: 482�C492. DOI: 10.1016/j.petrol.2016.06.024.
[6] GEORGE R C, DENOO S A. Mechanical properties program using borehole analysis and Mohr��s circle [C]// SPWLA 22nd Annu Logging Symp. Mexico City, Mexico: 1981: 212�C219.
[7] LU Y L, ELSWORTH D, WANG L G. Microcrack-based coupled damage and flow modeling of fracturing evolution in permeable brittle rocks [J]. Comput Geotech, 2013, 49: 226�C244.
[8] YILMAZ O, UNLU T. Three dimensional numerical rock damage analysis under blasting load [J]. Tunn Undergr Sp Technol, 2013, 38: 266�C278.
[9] CAENN R, DARLEY H C, GRAY G R. Composition and properties of drilling and completion fluids [M]. Gulf Professional Publishing, 2011.
[10] ZEYNALI M E. Mechanical and physico-chemical aspects of wellbore stability during drilling operations [J]. J Pet Sci Eng, 2012, 82�C83: 120�C124.
[11] CHEN G. A study of wellbore stability in shales including porelastic, chemical and thermal effects [D]. Univ of Texas at Austin, 2001.
[12] MA T S, CHEN P. A wellbore stability analysis model with chemical mechanical coupling for shale gas reservoirs [J]. J Nat Gas Sci Eng, 2015, 26 :72�C98.
[13] YUE Y, CHEN S, WANG Z, YANG X, PENG Y, CAI J, NASR-EL-DIN H A. Improving wellbore stability of shale by adjusting its wettability [J]. J Pet Sci Eng, 2017, 161(2): 692-702. DOI: 10.1016/ j.petrol.2017.12.023.
[14] ZHAO C, SCHAUBS P, HOBBS B. Effects of porosity heterogeneity on chemical dissolution-front instability in fluid-saturated rocks [J]. Journal of Central South University, 2017, 24: 720�C725. DOI: 10.1007/s11771-017-3473-1.
[15] KADYROV T, TUTUNCU A N. Integrated Wellbore stability analysis for well trajectory optimization and field development in the West Kazakhstan Field [C]// 46th US Rock Mechanics/Geomechanics Symposium. American Rock Mechanics Association. 2012: 1626�C1638.
[16] DUTTA D J, FAROUK M. Wellbore stability and trajectory sensitivity analyses help safe drilling of the first horizontal well in Asl formation, Gulf of Suez, Egypt [C]// IADC/SPE Asia Pacific Drilling Technology Conference and Exhibition. 2008: 168�C177.
[17] RAHMAN M, HOSSAIN M, RAHMAN S. Hydraulic fracture initiation and propagation: Roles of wellbore trajectory, perforation and stress regimes [J]. J Pet Sci Eng 2000, 27: 129�C149.
[18] ZHANG W, LIU Y. Investigation of incremental fatigue crack growth mechanisms using in situ SEM testing [J]. International Journal of Fatigue, 2012, 42: 14�C23.
[19] MA T, CHEN P, YANG C, ZHAO J. Wellbore stability analysis and well path optimization based on the breakout width model and Mogi�CCoulomb criterion [J]. J Pet Sci Eng, 2015, 135: 678�C701. DOI: 10.1016/j.petrol.2015.10.029.
[20] UDEGBUNAM J E, AADN Y B S, FJELDE K K. Uncertainty evaluation of wellbore stability model predictions [J]. J Pet Sci Eng, 2014, 124: 254�C263. DOI: 10.1016/j.petrol.2014.09.033.
[21] ABDOLLAHIPOUR A, RAHMANNEJAD R. Sensitivity analysis of influencing parameters in cavern stability [J]. Int J Min Sci Technol, 2012, 22: 707�C710. DOI: 10.1016/ j.ijmst.2012.08.020.
[22] RUTQVIST J, TSANG C F, STEPHANSSON O. Uncertainty in the maximum principal stress estimated from hydraulic fracturing measurements due to the presence of the induced fracture [J]. Int J Rock Mech Min Sci, 2000, 37: 107�C20.
[23] LOPEZ J L, RAPPOLD P M, UGUETO G A, WIESENECK J B, VU K. Integrated shared earth model: 3D pore-pressure prediction and uncertainty analysis [J]. Lead Edge, 2004: 52�C59.
[24] GHOLAMI R, RABIEI M, RASOULI V, AADNOY B, FAKHARI N. Application of quantitative risk assessment in wellbore stability analysis [J]. J Pet Sci Eng, 2015, 135: 185�C200. DOI: 10.1016/j.petrol.2015.09.013.
[25] ZHANG L, YAN X, YANG X, TIAN Z, YANG H. Failure probability analysis of coal crushing induced by uncertainty of influential parameters under condition of in-situ reservoir [J]. Journal of Central South University, 2014, 21: 2487�C2493. DOI: 10.1007/ s11771-014-2203-1.
[26] SUN Z, ZHANG D. Back analysis for soil slope based on measuring inclination data [J]. Journal of Central South University, 2012, 19: 3291�C3297.
[27] HU Qi, LI Yun-gui, LU Xi-lin. Practical elasto-plastic damage model for dynamic loading and nonlinear analysis of Koyna concrete dam [J]. Journal of Central South University, 2013, 20: 2586�C2591.
[28] LUO W, LI W. Reliability analysis of supporting pressure in tunnels based on three-dimensional failure mechanism [J]. Journal of Central South University, 2016, 23: 1243�C1252.
[29] HELTON J C, DAVIS F J. Illustration of sampling-based methods for uncertainty and sensitivity analysis [J]. Risk Anal, 2002, 22: 591�C622.
[30] NIKADAT N, FATEHI M M, ABDOLLAHIPOUR A. Numerical modelling of stress analysis around rectangular tunnels with large discontinuities (fault) by a hybridized indirect BEM[J]. Journal of Central South University, 2015, 22(11): 4291�C4299.
[31] YU W, LUO Z, JAVADPOUR F, VARAVEI A, SEPEHRNOORI K. Sensitivity analysis of hydraulic fracture geometry in shale gas reservoirs [J]. J Pet Sci Eng, 2014, 113: 1�C7. DOI: 10.1016/j.petrol.2013.12.005.
[32] NIU S, JING H, HU K, YANG D. Numerical investigation on the sensitivity of jointed rock mass strength to various factors [J]. Min Sci Technol, 2010, 20: 530�C534. DOI: 10.1016/S1674-5264(09)60238-6.
[33] WANG J G, WANG Z, LI Y. A method for evaluating dynamic tensile damage of rock [J]. Eng Fract Mech, 2008, 75: 2812�C2825. DOI: 10.1016/j.engfracmech.2008.01.005.
[34] SHI J, LUA J, CHEN L, CHOPP D, SUKUMAR N. X-FEM for Abaqus (XFA) toolkit for automated crack onset and growth simulation: New development, validation, and demonstration [C]// Proc 2009 SIMULIA Cust Conf. 2009: 1�C15. DOI: 10.2514/6.2008-1763.
[35] LIU J F, QI T Y , WU Z R. Analysis of ground movement due to metro station driven with enlarging shield tunnels under building and its parameter sensitivity analysis [J]. Tunneling Undergr Sp Technol, 2012, 2: 287�C296.
[36] CASTRO-FILGUEIRA U, ALEJANO L R, ARZ A J, IVARS D M. Sensitivity analysis of the micro-parameters used in a PFC analysis towards the mechanical properties of rocks [J]. Procedia Eng, 2017, 191: 488�C495.
[37] DOU H, ZHANG H, YAO S, ZHU D, SUN T, MA S, et al. Measurement and evaluation of the stress sensitivity in tight reservoirs [J]. Pet Explor Dev, 2016, 43: 1116�C1123.
[38] ZHU W, ZHAO J. Stability analysis and modelling of underground excavations in fractured rocks [M]. Amesterdam: Elsevier, 2004.
[39] SALTELLI A, RATTO M, ANDRES T, CAMPOLONGO F, CARIBONI J, GATELLI D, SAISANA M, TARANTOLA S. Global Sensitivity Analysis: The Primer [M]. John Wiley and Sons, 2008.
[40] ABDOLLAHIPOUR A, RAHMANNEJAD R. Investigating the effects of lateral stress to vertical stress ratios and caverns shape on the cavern stability and sidewall displacements [J]. Arab J Geosci, 2012, 6(12): 4811�C4819. DOI: 10.1007/ s12517-012-0698-z.
[41] SALENON J. Contraction quasi-statique d��une cavite a symetrie spherique ou cylindrique dans un milieu elastoplastique [J]. Ann Des Ponts Chauss��es, 1969, 4: 231�C236.
(Edited by FANG Jing-hua)
���ĵ���
Ӱ�쾮���ȶ��Եĵ�����ѧ���������Է���
ժҪ�������ȶ��Է�����ʯ��ҵ�еõ�Խ��Խ��Ĺ�ע��Ӱ�쾮Ͳ�ȶ��ԵIJ����ܶ࣬����������ѧ����(�絯��ģ��������ѹǿ�Ⱥ�����)��������(�糡Ӧ�����ཬѹ��)����ȷ��ȷ����Щ����������ʱ���۸���ʱ�����Dz����ܵġ������ṩ��һ��ϵͳ�������ȷ�������������ÿ�������Ծ�Ͳ�ȶ��Ե�Ӱ��̶ȡ��������λ����Ϊ�о���Ͳ�ȶ��Ե�һ���ȶ����ӡ�����Mohrģ�͵���ά����ַ�������ֵģ�⣬�ý��������ֵģ�ͽ�������֤��Ϊ�˱Ƚϸ��ֲ����������ȷ����еĽ���������һ�����������������ӡ����������������ʯǿ�ȵIJ�ͬ����������Ҫ�̶��Dz�ͬ�ġ���������ʯ�������еIJ����ֱ������ˮƽӦ������Ħ���Ǻ͵ز�ѹ����������ǿ��ʯ�������еIJ����ֱ������ˮƽӦ�����ཬѹ���Ϳ�϶ѹ��������Ҳ������ÿ�������Ĺ������Ծ����ȶ��Է���������Ӱ�졣
�ؼ��ʣ������ȶ��ԣ������Է�������ֵģ��
Received date: 2017-12-21; Accepted date: 2018-02-12
Corresponding author: Ezzatollah KAZEMZADEH, PhD, Associate Professor; Tel/Fax: +98-21-48252591; E-mail: Kazemzadehe@ ripi.ir; ORCID: 0000-0003-2687-4470

