2219-C10S���Ͻ�TIG���ӽ�ͷ��������֯�ݱ估�����ѧ���ܵ�Ӱ��
��Դ�ڿ����й���ɫ����ѧ��(Ӣ�İ�)2020���10��
�������ߣ��ŵǿ� �ⰮƼ �ԫh ���ʹ� ��ռ�� ������ �ν��� ����ƽ ������
����ҳ�룺2625 - 2638
�ؼ��ʣ�2219-C10S���Ͻ��ټ��������屣����������֯�ݱ䣻��ѧ���ܣ���ϵģ��
Key words��2219-C10S aluminum alloy; tungsten inert gas arc welding; microstructural evolution; mechanical properties; relationship model
ժ Ҫ����ϸ����2219-C10S���Ͻ�TIG���ӽ�ͷ��������֯�ݱ估�����ѧ���ܵ�Ӱ�졣����������ں������������γɦ�+�ȹ�����֯�������������ࣻ�ڲ����ۻ����������γɹ������������칲������������������������״�ȡ��ࣻ�ڹ�ʱЧ�����ȡ�����ֻ����ܽ⣬�֦ȡ���ת���ɦ��ࣻ����Ӱ�������ȡ�����ֻ���ǿ���ࡢ�����ߴ硢����Cu������λ���ܶȵ����ؿ�Ӱ���ͷ������ѧ���ܡ����⣬���һ�ֿ���������������ѧ���������������������������ƽ��ֱ��������Ԫ��Ũ��֮���ϵ��ģ�͡�
Abstract: Microstructural evolution and its effect on mechanical properties in different regions of 2219-C10S aluminum alloy tungsten inert gas (TIG) welded joint were analyzed in detail. In weld zone (WZ), ��+�� eutectic structure formed at grain boundaries with no precipitates inside the grains. In partially melted zone (PMZ), symbiotic eutectic or divorced eutectic formed at grain boundaries and needle-like �ȡ� phases appeared in the secondary heated zone. In over aged zone (OAZ), the coarsening and dissolution of �ȡ� phases occurred and most �ȡ� phases transformed into �� phases. In general heat affected zone (HAZ), �ȡ� phases coarsened. Factors such as the strengthening phases, the grain size, the Cu content in matrix and the dislocation density can affect the mechanical properties in different regions of the joint. Moreover, a model describing the relationship between mechanical properties of the material and the volume fraction of precipitates, the average diameter of precipitates and the concentration of soluble elements was proposed.
Trans. Nonferrous Met. Soc. China 30(2020) 2625-2638
Deng-kui ZHANG1, Ai-ping WU1,2,3, Yue ZHAO1,2, Ji-guo SHAN1,2, Zhan-dong WAN1, Guo-qing WANG4, Jian-ling SONG5, Zhong-ping ZHANG5, Xian-li LIU6
1. Department of Mechanical Engineering, Tsinghua University, Beijing 100084, China;
2. Key Laboratory for Advanced Materials Processing Technology, Ministry of Education, Tsinghua University, Beijing 100084, China;
3. State Key Laboratory of Tribology, Tsinghua University, Beijing 100084, China;
4. China Academy of Launch Vehicle Technology, Beijing 100076, China;
5. Tianjin Long March Launch Vehicle Manufacturing Co., Ltd., Tianjin 300462, China;
6. Capital Aerospace Machinery Corporation Limited, Beijing 100076, China
Received 12 December 2019; accepted 21 July 2020
Abstract: Microstructural evolution and its effect on mechanical properties in different regions of 2219-C10S aluminum alloy tungsten inert gas (TIG) welded joint were analyzed in detail. In weld zone (WZ), ��+�� eutectic structure formed at grain boundaries with no precipitates inside the grains. In partially melted zone (PMZ), symbiotic eutectic or divorced eutectic formed at grain boundaries and needle-like �ȡ� phases appeared in the secondary heated zone. In over aged zone (OAZ), the coarsening and dissolution of �ȡ� phases occurred and most �ȡ� phases transformed into �� phases. In general heat affected zone (HAZ), �ȡ� phases coarsened. Factors such as the strengthening phases, the grain size, the Cu content in matrix and the dislocation density can affect the mechanical properties in different regions of the joint. Moreover, a model describing the relationship between mechanical properties of the material and the volume fraction of precipitates, the average diameter of precipitates and the concentration of soluble elements was proposed.
Key words: 2219-C10S aluminum alloy; tungsten inert gas arc welding; microstructural evolution; mechanical properties; relationship model
1 Introduction
2219 aluminum alloy is a kind of alloys that can be strengthened by precipitation. After the heat treatment of C10S (solution heat treatment and cold working with a deformation of approximately 10%, followed by artificial aging), 2219 aluminum alloy exhibits excellent mechanical properties, stress corrosion resistance and weldability. Based on the above advantages, 2219-C10S aluminum alloy has been widely used in the aerospace field [1-10].
Currently, the combination of direct current tungsten inert gas (TIG) arc welding and variable polarity TIG (VPTIG) arc welding has been applied in the manufacturing of fuel tanks for large launch vehicles. Unfortunately, the solidification segregation occurs in weld zone (WZ) and nanometer sized precipitates change a lot in other regions of the joint during the TIG-welding. That is, the 2219-C10S aluminum alloy TIG welded joint shows a softening phenomenon. Due to the inhomogeneous microstructure and mechanical properties in each typical region of the joint, the tensile strength of the joint is always severely reduced [11]. NIU et al [12] studied the softening behavior of 2219-T87 alloy VPTIG welded joint with emphasis on the welding temperature field, the grain size, alloying element distribution and precipitate evolution in each region of the joint. XU et al [13] studied the temperature field and mechanical properties of 2219-O alloy friction stir welded (FSW) joint. LI et al [14] studied the segregation in WZ of 2219-T87 alloy and its influence on mechanical properties. However, there are a few detailed studies on the microstructure and mechanical properties of typical regions of the joint. Further, the relationship between microstructure and mechanical properties is not completely clear.
In this work, we investigated the micro- structural evolution and analyzed the effect of microstructural evolution on mechanical properties in different regions of the joint. This basic work can be beneficial to understanding the reasons for the softening of the joint and can lay a technical foundation for improving mechanical properties of the joint in the future.
2 Experimental
The base materials were 2219 aluminum alloy rolled plates with dimensions of 300 mm �� 150 mm �� 10 mm after C10S heat treatment. The welding wire was ER2325. The nominal chemical compositions of welding materials are given in Table 1. The main welding parameters of the joint are listed in Table 2. The joint in this work was prepared by a three-layer welding process on one side. The schematic illustration diagram of the formation of the joint is shown in Fig. 1. The welding retention time between every two welding layers was about 30 min. The first layer adopted direct current TIG helium-arc welding without grooves and welding wire. The second and third layers adopted pulse VPTIG argon-arc welding with welding wire.
The macroscopic morphology along transverse cross-section of the joint is shown in Fig. 2. Typical specimens obtained from capping weld, backing weld, partially melted zone (PMZ), over aged zone (OAZ) and heat affected zone (HAZ) were used for the observation and analysis. The metallographic structure in each region was observed by using an Olympus Bx51m optical microscope (OM). The dislocations and precipitates in each region were observed by using an FEI Technai F20 transmission electron microscope (TEM). The TEM specimens were prepared by mechanical polishing to 40-50 ��m, followed by double-jet electropolishing at 15 V in a solution of 30% nitric acid and 70% methanol solution cooled to -30 ��C. The grain size distribution and texture in each region were observed by using an Oxford Nordlys Max3 electron back scattered diffraction (EBSD) system. The EBSD specimens were prepared by mechanical polishing followed by vibration polishing. The lattice constant of ��(Al) matrix and Cu content in each region were analyzed by using a Bruker D8-Advance X-ray diffraction (XRD) with a THCLXPD software.
Table 1 Chemical compositions of 2219 aluminum alloy and ER2325 filler metal (wt.%)
Table 2 Main welding parameters of joint

Fig. 1 Schematic diagrams of formation of welded joint

Fig. 2 Macroscopic morphology along transverse cross- section of joint
For the above analysis, only the specimens used for the metallographic structure observation were etched. The etchant was Keller��s reagent (1 mL HF + 1.5 mL HCl + 2.5 mL HNO3 + 95 mL H2O) and the etching time was 10-15 s.
3 Results and discussion
3.1 Microstructural evolution
3.1.1 OM results
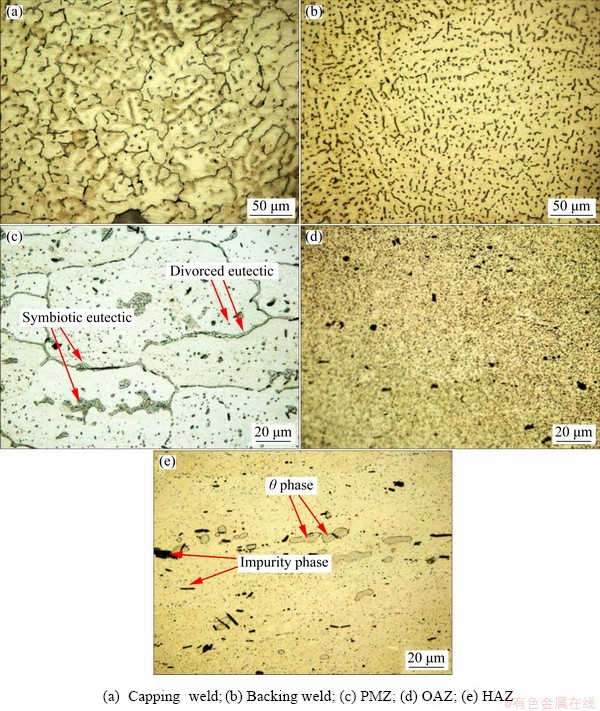
Fig. 3 Metallographic structures along transverse cross-section in different regions of joint
Dendritic equiaxed structure was observed at the center of capping weld and backing weld, as shown in Figs. 3(a) and (b), respectively. On one hand, tungsten arc acted at the center of WZ and the temperature of welding pool decreased gradually from the center to the boundary. The temperature gradient in liquid phase was smaller and that in the constitutional supercooling zone was larger at the center of WZ. On the other hand, the welding wire and base materials melted together when welding. The fine particles such as Al3Ti and Al3Zr in welding wire were distributed in the welding pool to act as heterogeneous nucleating agents. Meanwhile, columnar grains which solidified firstly at the edge of welding pool caused the impurity phases to be squeezed into the liquid phase with increasing the number of nucleation sites at the center of welding pool. All of the above processes increased the grain nucleation rate at the center of WZ and the resulting nuclei grew in all directions to form equiaxed structure accordingly.
In addition, for backing weld, the smaller welding heat input (shown in Table 2) and the faster cooling speed of welding pool resulted in a higher constitutional supercooling. Therefore, the grain nucleation rate was greatly improved and the grain growth was greatly hindered. Ultimately, the average grain size of the backing weld was smaller.
In PMZ, the peak temperature during the welding was 543-643 ��C [12]. All of �ȡ� and some �� phases from base materials dissolved and partial materials melted. Subsequently, the non-equilibrium solidification led to the precipitation of eutectic structure (��(Al)+��), as shown in Fig. 3(c). The larger �� phases from base materials liquefied and solidified. And finally, these �� phases became large granular symbiotic eutectic at grain boundaries. Meanwhile, a small amount of symbiotic eutectic or divorced eutectic formed at grain boundaries and some fine granular divorced eutectic formed inside grains [15].
In OAZ, the peak temperature during the welding was 415-535 ��C [12]. �ȡ� phases from base materials became coarsening, then dissolved and started to transform into �� phases. The coarsening and dissolution of �ȡ� phases coexisted. As shown in Fig. 3(d), many fine black particles (�� phases) precipitated from the matrix.
In HAZ, the peak temperature during the welding was 319-415 ��C [12] and �ȡ� phases became coarsening. However, �ȡ� phases were too small to be observed by OM and only large granular �� phases from base materials can be observed, as shown in Fig. 3(e).
In addition, some black irregular-shaped substances in regions of PMZ, OAZ and HAZ were undissolved impurity phases (e.g. Al7Cu2Fe and Al20Cu2Mn3). These impurity phases were brittle, which would weaken mechanical properties of the aluminum alloy [1,16].
3.1.2 TEM results
TEM bright-field images and selected area electron diffraction (SAED) patterns around grain boundaries in different regions of the joint are shown in Fig. 4. As shown in Figs. 4(a1-a3), the thickest �� phases (the average thickness was about 660 nm) precipitated at grain boundaries to form eutectic structure in the capping weld. As shown in Figs. 4(b1-b3), the thickness of �� phases precipitated at grain boundaries decreased in PMZ. As shown in Figs. 4(c1-c3), �� phases precipitated and coarsened at grain boundaries in OAZ. As shown in Figs. 4(d1) and (d2), only scattered �� phases from base materials were observed at grain boundaries in HAZ. In addition, obvious precipitation free zones (PFZ) were observed near grain boundaries in PMZ and the average width of PFZ was about 350 nm.
TEM bright-field images and SAED patterns inside grains of WZ and PMZ are shown in Figs. 5 and 6, respectively. All phases were dissolved and some dislocation lines were tangled in capping weld, as shown in Fig. 5. Granular �� phases and needle-like �ȡ� phases precipitated in PMZ, as shown in Fig. 6. The sampling location of PMZ experienced ��partial melting�� during the backing welding (the 1st layer) and was affected by ��solid solution + aging�� during the capping welding (the 2nd and 3rd layers) and needle-like �ȡ� phases precipitated naturally. In order to further verify that needle-like phases were indeed �ȡ� phases, high resolution TEM (HRTEM) testing of red circle in Fig. 6(b) was conducted. The HRTEM result (as shown in Fig. 7) showed that the needle-like phase maintained a semi-coherent relationship with ��(Al) matrix and it was further verified that needle-like phases presented in PMZ were �ȡ� phases. The specific orientation relationship between �ȡ� phase and ��(Al) matrix was {110}�ȡ�//{200}Al and [001]�ȡ�//[011]Al.
TEM bright-field images and SAED patterns inside grains of OAZ and HAZ are shown in Figs. 8 and 9, respectively. The corresponding energy- dispersive spectrometry (EDS) results in Figs. 4, 5, 6 and 8 are shown in Table 3. It was observed that the numbers of �� and �ȡ� phases decreased with coarsened size in OAZ and a large number of thin disc-like (the side was needle-like) �ȡ� phases in HAZ. The sizes of the �ȡ� phases in HAZ were significantly larger than those in base materials and this coarsening phenomenon was obvious. In addition, impurity T phase with body-centered cubic (BCC) structure was observed in OAZ.

Fig. 4 TEM bright-field images and corresponding SAED patterns around grain boundaries in different regions of joint
The peak temperature in each typical region of the joint was higher than 180 ��C and �ȡ� phases were dissolved substantially. The composition and shape of impure phases were complex and their effects on mechanical properties of the joint were not considered currently. The contribution situation of various phases to the strength of aluminum alloy was as follows: �ȡ� > �ȡ� > GP zone > �� [17]. In view of the above, the strengthening phase �ȡ� (size, content, etc) should be taken into account when analyzing the effect of microstructural evolution on mechanical properties in each region of the joint.
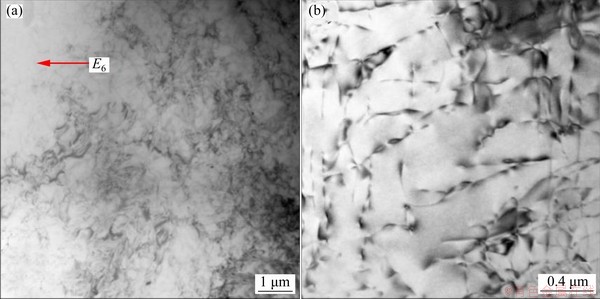
Fig. 5 TEM bright-field images in wide range (a) and narrow range (b) inside grains of WZ
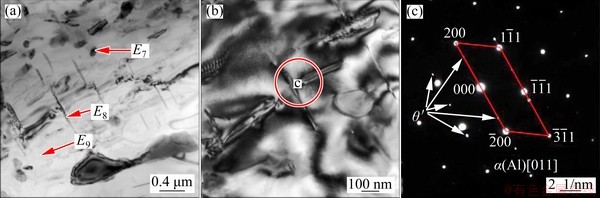
Fig. 6 TEM bright-field images (a, b) and corresponding SAED pattern (c) inside grains of PMZ
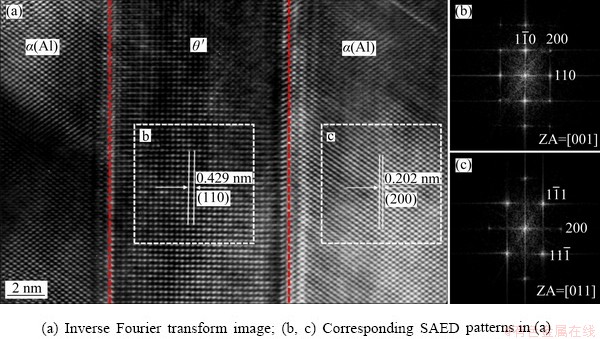
Fig. 7 HRTEM results of red circle in Fig. 6(b)
According to the above TEM results, the distribution situation of strengthening phase �ȡ� in each region was as follows: the biggest amount in HAZ, the smallest amount in PMZ, a small amount with severe coarsening in OAZ and not in WZ.
3.1.3 EBSD results
The grain distributions and size statistics in different regions of the joint are shown in Fig. 10. The average grain size of capping weld (about 73 ��m) was larger than that of backing weld (about 49 ��m), which was consistent with the OM results. The average grain sizes of PMZ, OAZ and HAZ were similar (41-44 ��m) and smaller than that of WZ. This showed that the fine-grain strengthening effect in regions of PMZ, OAZ and HAZ was higher.
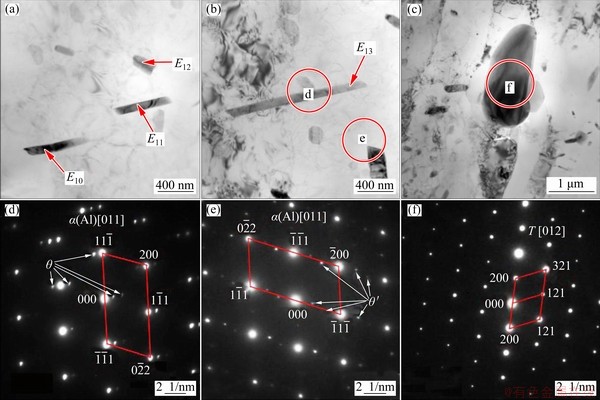
Fig. 8 TEM bright-field images (a-c) and corresponding SAED patterns (d-f) inside grains of OAZ

Fig. 9 TEM bright-field images (a, b) and corresponding SAED pattern (c) inside grains of HAZ
Table 3 EDS analysis results of different zones in Figs. 4, 5, 6 and 8 (wt.%)
The EBSD images showing recovery and recrystallization in PMZ, OAZ and HAZ of the joint are shown in Fig. 11. Combining with HKL-Channel 5 software, the meaning of different colors can be judged according to the grain boundary angle [18]. Red areas represent deformed grains (the orientation difference of any point inside the grain is greater than 10��). Yellow areas represent substructures, i.e. recovery grains (the orientation difference of any point inside the grain is between 2�� and 10��). Blue areas represent recrystallized grains (the orientation difference of any point inside the grain is less than 2��). The recrystallization rates in PMZ, OAZ and HAZ were 7.50%, 1.62% and 0.67%, respectively, and the recovery rates in PMZ, OAZ and HAZ were 78.85%, 60.92% and 39.41%, respectively. The main reasons for recovery and recrystallization were high stacking fault energy and high dislocation density in aluminium alloy matrix (the base materials experienced about 10% cold- working deformation). The peak temperatures of PMZ, OAZ and HAZ caused by welding thermal cycle were higher than 180 ��C, which basically reached the initial recrystallization temperature (recrystallization temperatures of pure Al and Cu are 150 and 200 ��C, respectively). As the distance from WZ decreased, the increase in peak welding temperature accelerated the thermal vibration and diffusion rate of atoms, which was conducive to the occurrence of recovery and recrystallization. The recovery had little effect on mechanical properties and only involved the release of deformation storage energy and partial elimination of stress. The recrystallization rates of these three regions were very low, which indicated that the recrystallization caused by welding thermal cycle was not the main factor affecting the mechanical properties in each region of the joint.

Fig. 10 Grain distributions and size statistics in different regions of joint
Local orientation distributions in PMZ, OAZ and HAZ of the joint are shown in Fig. 12. The difference of local orientation can reflect the deformation degree of grains and the distribution of dislocation density. The deformation in regions of PMZ, OAZ and HAZ was obvious. Among these three regions, the dislocation density of HAZ was the highest and that of PMZ was the lowest, which were consistent with the previous recovery and recrystallization results. The base metal was aluminum alloy of C10S heat treatment state. The C10S state underwent about 10% cold deformation and subsequent artificial aging did not completely eliminate the deformation. During the welding process, the peak temperature of HAZ was very low, which basically had no effect on the residual deformation from the base metal. So, the dislocation density in HAZ was higher than that in PMZ and OAZ.
3.1.4 XRD results
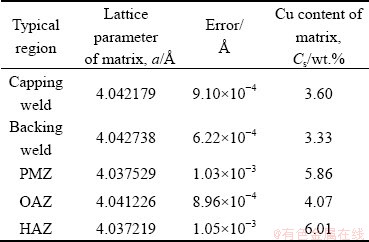
The XRD patterns in different regions of the joint are shown in Fig. 13. Both ��(Al) and �� phase were observed in each region. More impurity phases were observed in base materials and HAZ. The lattice constant of ��(Al) in each region was calculated using a THCLXPD software developed by Tsinghua University [19]. The Cu content of ��(Al) matrix in each region was calculated based on the following two assumptions: (1) ignoring the effect of other solid solution elements, it was assumed that the change of lattice parameter of ��(Al) matrix was mainly affected by the solubility of Cu; (2) the relationship between Cu content and lattice parameter in ��(Al) matrix was a=a0-pCs (a represents the lattice constant of matrix; a0 represents the lattice constant of pure Al, which is 4.0496  ; p is a constant, which is 2.06��10-3 /wt.%; Cs represents Cu content of matrix, wt.%). The corresponding calculation results are shown in Table 4. The Cu content in the matrix from higher to lower was as follows: HAZ > PMZ > OAZ > capping weld > backing weld. It was noteworthy that the Cu content in the matrix obtained by this method included �ȡ� phase.
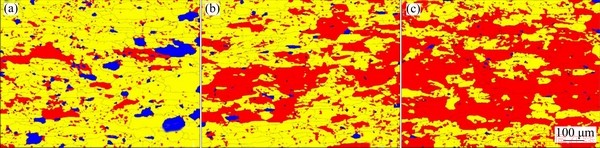
Fig. 11 EBSD images showing recovery and recrystallization in PMZ (a), OAZ (b) and HAZ (c) of joint

Fig. 12 Local orientation distributions in PMZ (a), OAZ (b) and HAZ (c) of joint
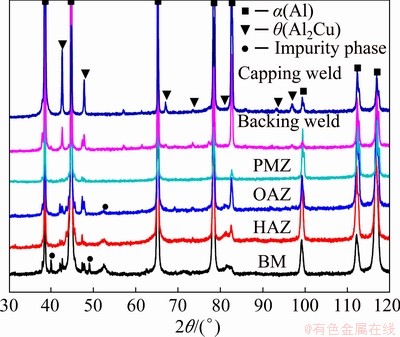
Fig. 13 XRD patterns in each region of joint
Table 4 Lattice parameters and errors, Cu contents of matrix in different regions of joint
3.2 Mechanical properties
3.2.1 Yield strength
As the precipitates of 2219 aluminum alloy, �ȡ� and �ȡ� phases can maintain a coherent and semi- coherent relationship with the ��(Al) matrix, respectively, both �ȡ� and �ȡ� phases can result in large coherent distortion energy, which has a remarkable strengthening effect on the matrix. Therefore, both �ȡ� and �ȡ� phases are the main strengthening phases of 2219 aluminum alloy. These strengthening phases can reduce the distance of dislocation slip, shorten the slip zone and control the number of dislocations when dislocation groups intersect with the order, thereby avoiding large stress concentration and achieving particle- strengthening effect [20,21]. The effect of strengthening phases can also be explained according to the Orowan strengthening mechanism described as follows [22]:
 (1)
(1)
 (2)
(2)
where ��Rp0.2 is the increase in yield strength of alloy, K is a constant, M is the Taylor factor, G is the shear modulus of matrix, b is the scale of Burgers vector of matrix, �� is the effective inter-particle distance on the dislocation slip plane, �� is Poisson ratio of matrix, ds (��dm/4) is defined as the average particle diameter, dm is the measured average particle diameter, and fv is the volume fraction of precipitates. Within a certain range, the increase in yield strength of the alloy increases with the decrease of the size of precipitates, and increases with the increase of the volume fraction of precipitates. Previous TEM results show that the distribution situation of strengthening phase �ȡ� is as follows: the biggest amount in HAZ, the smallest amount in PMZ, a small amount with severe coarsening in OAZ and not in WZ. Correspondingly, the yield strength order of these regions from higher to lower is HAZ > PMZ > OAZ > WZ.
The reduction in grain size can lead to an increase in the number of grain boundaries per unit area, which can increase the resistance to dislocation movement and the strength of the material. The effect of grain size can also be explained by the Hall-Petch relationship described as follows [22]:
Rp0.2 = Rpure + kd-1/2 (3)
where Rp0.2 is the yield strength of alloy, Rpure is the yield strength of pure metal, k is a constant, and d is the average grain size. The above Hall-Petch formula indicates that the yield strength of alloy has a negative correlation with the average grain size. Previous EBSD results show that the average grain size of WZ is significantly larger than that of other regions, indicating that the yield strength of WZ is the lowest.
With the increase of Cu content in the matrix, the pinning effect caused by solute atoms makes it more difficult to start-up dislocations. The slip resistance of dislocations becomes greater and the strength of the material increases. The effect of soluble Cu content in the matrix can also be explained as follows [22]:
Rp0.2 = Rpure + HCn (4)
where C is the content of alloying elements in matrix, H and n are constants related to work- hardening properties of materials. The yield strength of the alloy is positively correlated with the content of alloying elements in the matrix. Previous XRD results show that the soluble Cu content in the matrix from higher to lower is HAZ, PMZ, OAZ and WZ, respectively, indicating that the order of yield strength of these four regions is consistent with XRD results.
In addition, the local orientation distributions of EBSD results indicate that the dislocation density distributions in regions of PMZ, OAZ and HAZ are different. The dislocation density increases with increasing the distance from WZ. Different dislocation densities also affect the mechanical properties in different regions of the joint.
In summary, strengthening phases (the type, morphology, size and quantity), the grain size, the Cu content in matrix and the dislocation density are the main factors affecting the yield strength in each region of the joint. The yield strength of each region from higher to lower appears in HAZ, PMZ, OAZ and WZ, respectively.
3.2.2 Mathematical model
The above analysis of mechanical properties only involves the yield strength in each region, but the regularity of other mechanical properties such as tensile strength and microhardness in each region needs to be discussed.
It is found in Refs. [23,24] that nano- precipitates are the main factor affecting the mechanical properties of precipitation-strengthened aluminium alloys. The main reason why the mechanical properties of the same alloys that have undergone different heat treatments are different is the different sizes of precipitates. In order to simplify the analysis, the morphological differences of precipitates in different regions of the joint are ignored. Based on the differences in the size and quantity of precipitates, the following model for predicting mechanical properties is established.
Based on microstructural evolution in each region of the joint, it is found that the main precipitates are �ȡ� and �� phases and there may be a small amount of impurity phases. Assuming that these precipitates are spherical and according to the simulation of aging strengthening behavior of Al-Mg-Si alloy system [25], the relationship between the diameter of precipitates and the contribution of precipitates to yield strength can be expressed as follows:
 (5)
(5)
 (6)
(6)
where ��p is the contribution of precipitates to yield strength of the material,  is the average diameter of precipitates, �� is a constant, and dc is the critical diameter of precipitates. It is found in Refs. [24,26] that for aluminum alloys, after T6 heat treatment (aging temperature is 120-190 ��C), the average diameter of precipitates is just the critical value dc. For the 2000 series aluminum alloy, the radius of �ȡ� phase after T6 heat treatment is 1.8-8 nm.
The welding peak temperatures in regions of WZ, PMZ, OAZ and HAZ of 2219 aluminum alloy TIG-welded joint are significantly higher than 180 ��C. Assuming that all the diameters of precipitates are larger than the critical diameter dc, according to Eq. (6), the contribution of precipitates to yield strength ��p can be expressed as follows:
 (7)
(7)
where K1 is a constant.
For the aluminium alloy [24,25], M equals about 3.1, �� equals 0.36, G equals 27 GPa and b equals 2.84 . So, K1 is a constant.
Considering the effect of solid solution strengthening and combining Labusch-Nabarro theory [27,28], the relationship between the soluble element i and the contribution of soluble element i to yield strength of the material can be expressed as follows:
 (8)
(8)
where ��s is the contribution of soluble element i to yield strength of the material, K2 is a constant of 246, ci is the concentration of soluble element i, and ��L is the mismatch parameter of element i. According to the calculation method of mismatch parameter in solid solution, the corresponding values of different alloy systems can be obtained. For example, the ��L values of Al-Cu, Al-Mn and Al-Mg systems are found to be 2.69, 3.39 and 2.06, respectively [27,28]. The ��L value of 2219 aluminum alloy can be regarded as a constant between 2.69 and 3.39. Therefore, Eq. (8) can be further simplified to Eq. (9):
 (9)
(9)
where K3 is a constant.
The relationship between yield strength Rp0.2 of the material and precipitates is established as
 (10)
(10)
where K4 is a constant associated with pure Al.
According to the simulation of aging strengthening behavior of Al-Mg-Si alloy system and a physical model proposed for non-heat treatment strengthened aluminium alloy [24,25], the relationship between mechanical properties (P) and precipitates is further obtained as follows:

 (11)
(11)
where P represents the mechanical properties of the material, such as the tensile strength and microhardness. The literatures [24,25] show that when P is tensile strength, K5 is 49, K6 is the product of 487 and mismatch parameter, and K7 is a constant between 0.96 and 1.95. So K5, K6 and K7 can be regarded as constants.
After further simplification, the following model can be obtained to qualitatively describe the relationship between mechanical properties of the material and the volume fraction of precipitates, the average diameter of precipitates, and the solubility of elements.
 (12)
(12)
where C1, C2 and C3 are constants. In Eq. (12), C1 is equal to K1K7, C2 is equal to K6+K3K7, and C3 is equal to K5+K4K7. Equations (7) to (11) have stated that K1-K7 can be regarded as constants.
Based on the distribution of nano-precipitate �ȡ� in each region, the soluble Cu content in each region and the mathematical model proposed by Eq. (12), the order of mechanical properties (from higher to lower) of different regions can be obtained as follows: HAZ > PMZ > OAZ > WZ.
3.2.3 Model verification
Considering that the tensile specimens in micro-region are difficult to obtain, the microhardness along transverse cross-section of the joint was measured in order to verify the above model. The testing locations and curves are shown in Fig. 14. The hardness values from maximum to minimum appears in HAZ, PMZ, OAZ and WZ, respectively, which is consistent with previous analysis results in Refs. [4,8,11].

Fig. 14 Microhardness distribution along transverse cross-section of joint
4 Conclusions
(1) In WZ of 2219-C10S aluminum alloy TIG-welded joint, ��+�� eutectic structure formed at grain boundaries and there were no precipitates but dislocations inside grains. In PMZ, symbiotic eutectic or divorced eutectic formed at grain boundaries. Needle-like �ȡ� phases precipitated in the secondary heated zone. In OAZ, the coarsening and dissolution of �ȡ� phases occurred and most �ȡ� phases transformed into �� phases. In HAZ, �ȡ� phases coarsened.
(2) The mechanical properties in different regions of the joint were related to the strengthening phases, the grain size, the Cu content in matrix and the dislocation density. The mechanical properties along transverse cross- section of the joint from maximum to minimum appeared in HAZ, PMZ, OAZ and WZ, respectively.
(3) A model describing the relationship between mechanical properties of the material and the volume fraction of precipitates, the average diameter of precipitates and the concentration of soluble elements was proposed. The model can predict the mechanical properties of 2219 aluminium alloy after different heat treatments.
References
[1] WANG Hui-min, YI You-ping, HUANG Shi-quan. Investigation of quench sensitivity of high strength 2219 aluminum alloy by TTP and TTT diagrams [J]. Journal of Alloys and Compounds, 2017, 690: 446-452.
[2] LIN Yi-tong, WANG Ming-chao, ZHANG Yu, HE Ya-zhang, WANG Dong-po. Investigation of microstructure evolution after post-weld heat treatment and cryogenic fracture toughness of the weld metal of AA2219 VPTIG joints [J]. Materials and Design, 2017, 113: 54-59.
[3] NARAYANA MURTY S V S, SARKAR A, NARAYANAN P R, VENKITAKRISHNAN P V, MUKHOPADHYAY J. Microstructure and micro-texture evolution during large strain deformation of aluminium alloy AA2219 [J]. Materials Science and Engineering A, 2016, 677: 41-49.
[4] ZHANG Deng-kui, WANG Guo-qing, WU Ai-ping, ZHAO Yue, LI Quan, LIU Xian-li, MENG Dan-yang, SONG Jian-ling, ZHANG Zhong-ping. Study on the inconsistency in mechanical properties of 2219 aluminium alloy TIG-welded joints [J]. Journal of Alloys and Compounds, 2019, 777: 1044-1053.
[5] HU Y Y, LIU H J, FUJII H. Improving the mechanical properties of2219-T6 aluminum alloy joints by ultrasonic vibrations during friction stir welding [J]. Journal of Materials Processing Technology, 2019, 271: 75-84.
[6] NARAYANA G V, SHARMA V M J, DIWAKAR V, KUMAR K S, PRASAD R C. Fracture behaviour of aluminium alloy 2219-T87 welded plates [J]. Science and Technology of Welding and Joining, 2004, 9(2): 121-130.
[7] WANG Kai, ZHAN Li-hua, YANG You-liang, MA Zi-yao, LI Xi-cai, LIU Jian. Constitutive modeling and springback prediction of stress relaxation age forming of pre-deformed 2219 aluminum alloy [J]. Transactions of Nonferrous Metals Society of China, 2019, 29: 1152-1160.
[8] ZHANG Deng-kui, ZHAO Yue, DONG Ming-ye, WANG Guo-qing, WU Ai-ping, SHAN Ji-guo, MENG Dan-yang, LIU Xian-li, SONG Jian-ling, ZHANG Zhong-ping. Effects of weld penetration on tensile properties of 2219 aluminum alloy TIG-welded joints [J]. Transactions of Nonferrous Metals Society of China, 2019, 29: 1161-1168.
[9] WANG Guo-qing, LI Quan, LI Yan-jun, WU Ai-ping, MA Ning-xu, YAN Dong-yang, WU Hui-qiang. Effects of weld reinforcement on tensile behavior and mechanical properties of 2219-T87 aluminum alloy TIG welded joints [J]. Transactions of Nonferrous Metals Society of China, 2017, 27: 10-16.
[10] LIU Lei, WU Yun-xin, GONG Hai, WANG Kai. Modification of constitutive model and evolution of activation energy on 2219 aluminum alloy during warm deformation process [J]. Transactions of Nonferrous Metals Society of China, 2019, 29: 448-459.
[11] ZHANG Deng-kui, LI Quan, ZHAO Yue, LIU Xian-li, SONG Jian-ling, WANG Guo-qing, WU Ai-ping. Microstructure and mechanical properties of three-layer TIG-welded 2219 aluminum alloys with dissimilar heat treatments [J]. Journal of Materials Engineering and Performance, 2018, 27(6): 2938-2948.
[12] NIU Lan-qiang, LI Xiao-yan, ZHANG Liang, LIANG Xiao-bo, LI Mian. Correlation between microstructure and mechanical properties of 2219-T8 aluminum alloy joints by VPTIG welding [J]. Acta Metallurgica Sinica (English Letters), 2017, 30(5): 438-446.
[13] XU Wei-feng, LIU Jin-he, LUAN Guo-hong, DONG Chun-lin. Temperature evolution, microstructure and mechanical properties of friction stir welded thick 2219-O aluminum alloy joints [J]. Materials and Design, 2009, 30: 1886-1893.
[14] LI Quan, WU Ai-ping, LI Yan-jun, WANG Guo-qing, QI Bo-jin, YAN Dong-yang, XIONG Lin-yu. Segregation in fusion weld of 2219 aluminum alloy and its influence on mechanical properties of weld [J]. Transactions of Nonferrous Metals Society of China, 2017, 27: 258-271.
[15] HUANG C, KOU S. Partially melted zone in aluminum welds-liquation mechanism and directional solidification [J]. Welding Journal, 2000, 79: 113-120.
[16] LIU K, CAO X, CHEN X G. Tensile properties of Al-Cu 206 cast alloys with various iron contents [J]. Metallurgical & Materials Transactions (Part A), 2014, 45(5): 2498-2507.
[17] PAPAZIAN J M. A calorimetric study of precipitation in aluminum alloy 2219 [J]. Metallurgical Transactions, 1981, 12: 269-280.
[18] LIU Zhang-guang, LI Pei-jie, XIONG Liang-tong, LIU Tai-ying, He Liang-ju. High-temperature tensile deformation behavior and microstructure evolution of Ti55 titanium alloy [J]. Materials Science and Engineering A, 2017, 680: 259-269.
[19] LI Quan, WU Ai-ping, LI Yan-jun, WANG Guo-qing, YAN Dong-yang, LIU Juan. Influence of temperature cycles on the microstructures and mechanical properties of the partially melted zone in the fusion welded joints of 2219 aluminum alloy [J]. Materials Science and Engineering A, 2015, 623: 38-48.
[20] SHARMA V M J, KUMAR K S, SRAO B N, PATHAK S D. Fatigue crack growth of AA2219 under different aging conditions [J]. Materials Science and Engineering A, 2011, 528: 4040-4049.
[21] ARORA K S, PANDEY S, SCHAPER M, KUMAR R. Effect of process parameters on friction stir welding of aluminum alloy 2219-T87 [J]. International Journal of Advanced Manufacturing Technology, 2010, 50: 941-952.
[22] DI Xin-jie, XIE Hui-juan, CHEN Cui-xin, DENG Cai-yan, WANG Dong-po. Microstructural evolution and softening behavior of simulated heat-affected zone in 2219 aluminum alloy [J]. Acta Metallurgica Sinica (English Letters), 2017, 30(12): 1177-1184.
[23] ZANDER J, SANDSTROM R, VITOS L. Modelling mechanical properties for non-hardenable aluminium alloys [J]. Computational Materials Science, 2007, 41: 86-95.
[24] ZANDER J, SANDSTROM R. One parameter model for strength properties of hardenable aluminium alloys [J]. Materials and Design, 2008, 29: 1540-1548.
[25] MYHR O R, GRONG O, ANDERSEN S J. Modelling of the age hardening behaviour of Al-Mg-Si alloys [J]. Acta Materialia, 2001, 49: 65-75.
[26] BAKAVOS D, PRANGNELL P B, DIF R. A comparison of the effects of age forming on the precipitation behavior in 2xxx, 6xxx and 7xxx aerospace alloys [J]. Materials Forum, 2004, 28: 124-131.
[27] NABARRO F R N. The theory of solution hardening [J]. The Philosophical Magazine: A Journal of Theoretical Experimental and Applied Physics, 1977, 35(3): 613-622.
[28] LABUSCH R. Statistical theories of solid-solution hardening [J]. Acta Metallurgica, 1972, 20: 917-927.
�ŵǿ�1���ⰮƼ1,2,3���� �h1,2�����ʹ�1,2����ռ��1��������4���ν���5������ƽ5��������6
1. �廪��ѧ ��е����ϵ������ 100084��
2. �廪��ѧ �Ƚ���������������ص�ʵ���ң����� 100084��
3. �廪��ѧ Ħ��ѧ�����ص�ʵ���ң����� 100084��
4. �й����ػ�������о�Ժ������ 100076��
5. ����쳤�������������˾����� 300462��
6. �������е��˾������ 100076
ժ Ҫ����ϸ����2219-C10S���Ͻ�TIG���ӽ�ͷ��������֯�ݱ估�����ѧ���ܵ�Ӱ�졣����������ں������������γɦ�+�ȹ�����֯�������������ࣻ�ڲ����ۻ����������γɹ������������칲������������������������״�ȡ��ࣻ�ڹ�ʱЧ�����ȡ�����ֻ����ܽ⣬�֦ȡ���ת���ɦ��ࣻ����Ӱ�������ȡ�����ֻ���ǿ���ࡢ�����ߴ硢����Cu������λ���ܶȵ����ؿ�Ӱ���ͷ������ѧ���ܡ����⣬���һ�ֿ���������������ѧ���������������������������ƽ��ֱ��������Ԫ��Ũ��֮���ϵ��ģ�͡�
�ؼ��ʣ�2219-C10S���Ͻ��ټ��������屣����������֯�ݱ䣻��ѧ���ܣ���ϵģ��
(Edited by Wei-ping CHEN)
Foundation item: Project (U1637601) supported by the Joint Funds of the National Natural Science Foundation of China
Corresponding author: Ai-ping WU, Tel: +86-10-62773859, E-mail: wuaip@tsinghua.edu.cn;
Guo-qing WANG; Tel: +86-10-68756168; E-mail: guoqingwang_211@sohu.com
DOI: 10.1016/S1003-6326(20)65407-3

