J. Cent. South Univ. (2016) 23: 1123-1131
DOI: 10.1007/s11771-016-0362-y

Detection of surface cutting defect on magnet using Fourier image reconstruction
WANG Fu-liang(������)1, 2, ZUO Bo(��)1, 2
1. School of Mechanical and Electrical Engineering, Central South University, Changsha 410083, China;
2. State Key Laboratory of High Performance Complex Manufacturing (Central South University),Changsha 410083, China
 Central South University Press and Springer-Verlag Berlin Heidelberg 2016
Abstract: A magnet is an important component of a speaker, as it makes the coil move back forth, and it is commonly used in mobile information terminals. Defects may appear on the surface of the magnet while cutting it into smaller slices, and hence, automatic detection of surface cutting defect detection becomes an important task for magnet production. In this work, an image-based detection system for magnet surface defect was constructed, a Fourier image reconstruction based on the magnet surface image processing method was proposed. The Fourier transform was used to get the spectrum image of the magnet image, and the defect was shown as a bright line in it. The Hough transform was used to detect the angle of the bright line, and this line was removed to eliminate the defect from the original gray image; then the inverse Fourier transform was applied to get the background gray image. The defect region was obtained by evaluating the gray-level differences between the original image and the background gray image. Further, the effects of several parameters in this method were studied and the optimized values were obtained. Experiment results show that the proposed method can detect surface cutting defects in a magnet automatically and efficiently.
Key words: defect detection; image process; magnet; Fourier transform
1 Introduction
A magnet is an important component of a speaker, and is commonly used in mobile information terminals, such as mobile phones, game machines, and personal computers. In industry, magnets are often manufactured as big blocks, and then cut into smaller slices with desired size. During cutting, defects may appear on magnet surface, and hence, automatic detection cutting defect becomes an important task for magnet production.
Surface defect detection using computer vision and image process techniques is in great industrial demand for replacing the subjective and repetitive process of manual inspection [1]. It has applications in the inspection of wood [2], steel [3], wafers [4], ceramics [5], fruits, and aircraft [6-7]. This kind of problem is often classified as texture analysis in image processing [8]. In most cases, textural features are extracted from the spatial domain or from the spectral domain of an inspection image, and then a classifier is used to recognize defects different from the background.
In the spatial domain, the second-order statistics features from spatial gray level co-occurrence matrices are widely used in defect detection [9-10]. They have been used for the inspection of sea ice [11], particulate matter [12], wire rope defects [13], machined surfaces [14], web surfaces [15], and cotton contamination [16].
In spectral domain, Gabor filter banks with varying frequencies and phase angles are commonly used to represent texture characteristics, and are applied to the inspection of granite [17], steels [18], and textile fabrics [19-20]. The wavelet transform is a powerful multi- resolution analysis tool for textural feature extraction [21-22]. The discriminant features are generally represented by wavelet energies of decomposed sub-images in different frequency channels and scales. They have been used for the inspection of semiconductor wafers and textile fabrics [23-25]. Textural features are also extracted from the power spectrum of an image by the Fourier transform [26], and have been used for the inspection of textile fabrics and semiconductor wafers [27-29].
Fourier transform based method transforms the pixel image into the Fourier domain, multiplies with the filter function and then re-transforms back into the spatial domain to remove or keep the defect. Typically, it has been used for defect detection in textile and solar cells images. The line defects are taken out by removing the high-energy frequency components in the Fourier domain using a one-dimensional Hough transform. The differences between the restored image and the original image are considered as potential defects [30-31].
The study shows that the Fourier transform based method is an efficient method to classify the defect free and defective surface, especially when no straight forward kernel can be found in the spatial domain. However, the application of Fourier transform for the surface cutting defect detection of magnet has not been reported yet. Furthermore, the defect is obviously different from the background in the above applications, but in the magnet images, the gray levels of the cutting defect and the back ground are nearly the same. Hence, it is hard to distinguish the frequency components of the defect and the background.
In this work, the Fourier transform method for surface cutting defect detection of magnet is further developed. Fourier transform is used to get the spectrum image of the magnet image. In this spectrum image, the defect is shown as a bright line. The angle of bright line is detected with a modified Hough transform and is removed to eliminate the defect from original gray image, and the inverse Fourier transform is applied to get the background gray image. The defect region can then be easily identified by evaluating the gray-level differences between the original image and the background gray image. The effects of several parameters in this method are studied and the optimized values are obtained. Experiment results show that the method proposed can detect surface cutting defect of a magnet efficiently.
2 Problem description
In industry, the magnet is manufactured as follows: 1) Raw materials, such as neodymium, iron, boron, cobalt, copper, gadolinium and dysprosium are measured out and put in a vacuum induction furnace to form an alloy; 2) The alloy is then broken down by hydrogen decrepitation and jet milled in a nitrogen and argon atmosphere to a micron sized powder (about 3 microns or less in size); 3) Neodymium powder is then put on the die cavity and is compacted in the presence of an externally applied magnetic field to give higher magnetic properties for the NdFeB; 4) The compacted magnet is then sintered in an inert (oxygen free) atmosphere (e.g. argon) to give it its final magnetic properties; 5) Finally, the neodymium block magnets are cut into smaller blocks of the desired size, as shown in Fig. 1. This is also known as ��slice and dice��.
While cutting, the surface of some magnets may be not flat and cutting defects are caused because of the vibration of the blade or some other factors, as shown in Fig. 2. Cutting defects are obvious to the human eye, but difficult to detect for the computer, as the background is similar to the defects in the gray value.
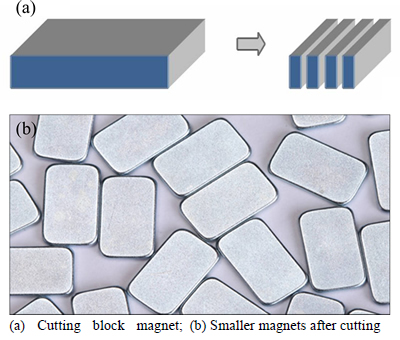
Fig. 1 Schematic diagrams:
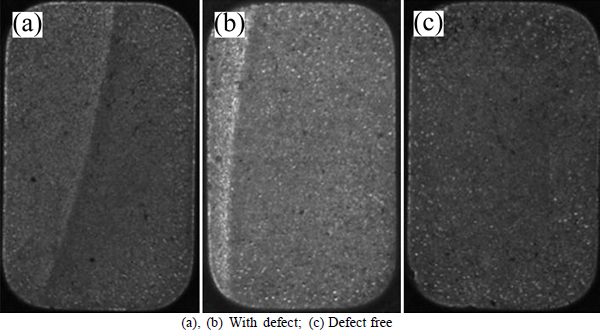
Fig. 2 Cutting surface of magnetic disk:
3 Magnet cutting defect detection system
Identifying the magnets with defective surface is an important part of the quality inspection. In this work, a computer vision based defect detection system is developed, as shown in Fig. 3. It contains a ring light to illuminate the magnet on the conveyor belt, an industry camera with lens to get the images of the magnet, and a computer to process the images and to identify whether the magnet has defect on the surface or not.
The flow chat of image process for surface defect detection is shown in Fig. 4. The image process forms the integral part of the system. Firstly, the Fourier transform is applied to the gray image of magnet G(x,y) to get the spectrum image F(u,v).The defect is shown as a bright line in the spectrum image. The angle of bright line with Hough transform is detected and this line is removed to eliminate the defect from original gray image G(x,y), the inverse Fourier transform is then applied to get the background gray image D(x,y). The defect gray image ��f(x,y) can then be obtained by subtracting D(x,y) from G(x,y), and a determination of whether G(x,y) contains defects can be obtained according to ��f(x,y).
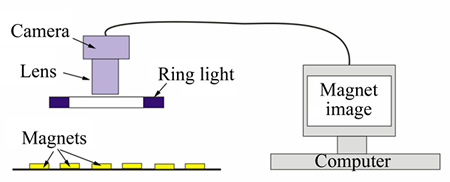
Fig. 3 Configuration of magnet imaging system
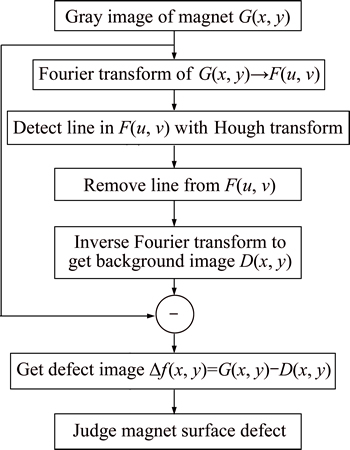
Fig. 4 Flow chart of image process for surface defect detection
4 Defect detection method
4.1 Fourier transform of magnet image and its characteristics
To intensify the high energy of a defect line, the magnet image is divided into non-overlapping sub- images with the size of 200��330 pixels. Figure 5(a) shows a defect-free sub-image, and Fig. 5(c) shows a sub-image with defect.
Let G(x, y) be the sub-image with the size of M��N pixels, the two dimensional discrete Fourier transform of G(x, y) is given by
 (1)
(1)
Generally, F(u, v) is complex
 (2)
(2)
Therefore, the power spectrum of F(u, v) can be defined as
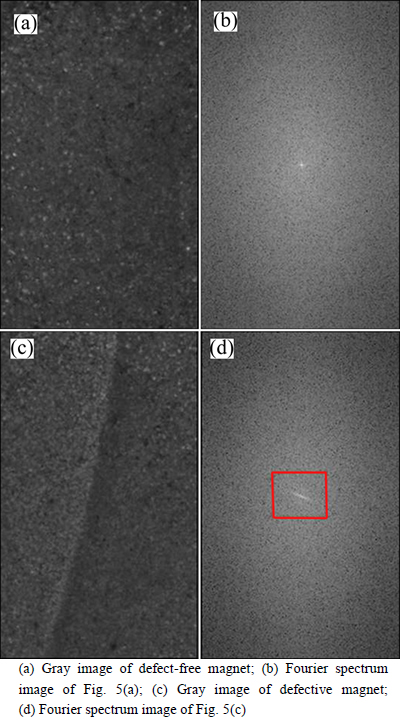
Fig. 5 Gray image and Fourier spectrum image of magnet:
 (3)
(3)
According to the above Fourier transform method, the spectrum images of Figs. 5(a) and (c) are obtained, as shown in Figs. 5(b) and (d). Because Fig. 5(a) is defect- free, the gray value of each pixel has smooth variation, hence, the spectrum image obviously has no bright line. However, Fig. 5(c) has a line defect, the gray value of pixels on the defect line undergoes a sharp variation, which causes a bright line at an angle of about 73�� across the center, as shown in Fig. 5(d). Therefore, determining and removing this line is the first step of defect detection.
4.2 Defect line detection in Fourier spectrum image
To automatically detect the bright lines in the Fourier spectrum image, a two-step defect line detection method is proposed as follows.
Step 1: To detect the defect line across the center of spectrum image, a one-dimensional accumulator A(��) and a number count B(��) is used to count the weight of each line across the center with the slope angle �� and the pixel numbers in each direction
 (4)
(4)
where P(u,v) is the power spectrum; (u, v) is the pixel in the rectangle area adjacent to the center, which is defined by two lines L1 and L2 parallel to the line L0 across the center. The distance between two lines and the length of them are w1 and L, respectively, as shown in Fig. 6, where (u0, v0) is the central coordinates of the spectrum image, and the image size is M��N pixels. The line equations of L0, L1 and L2 are defined as
 (5)
(5)
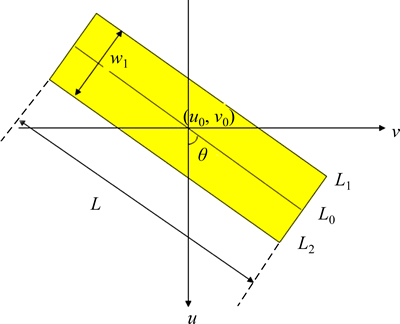
Fig. 6 Power spectrum accumulation area in Fourier spectrum image for each line across center
According to the above method, the corresponding accumulators A(��) and the number counts B(��) for Fig. 5 are obtained, as shown in Figs. 7 and 8, respectively.
It can be seen that the value of A(��) is not only related to the pixel brightness in each direction, but also related to the pixel. The number accumulation effect influences the brightness effect. To make the brightness more obvious, the average power spectrum of angle �� is defined as
 (6)
(6)
Figure 9 shows the average power spectrum C(��) corresponding to Fig. 5. A distinct peak can be seen in C(��) corresponding to a defective magnet, as shown in Fig. 9(b), however, no obvious peak can be found for a defect-free image in C(��), as shown in Fig. 9(a). Therefore, the candidate bright line angle ��0 can be found by
 (7)
(7)
Step 2: To verify the candidate angle ��0, a variable R�� is defined as
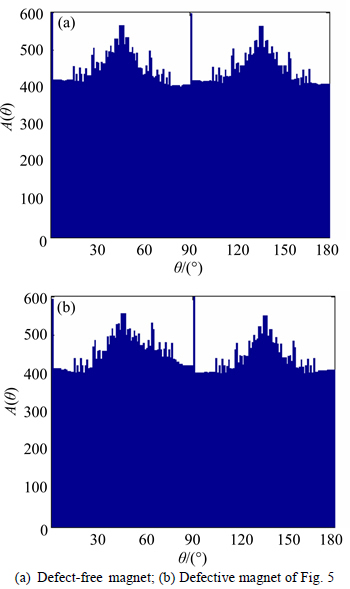
Fig. 7 Accumulator A(��) of spectrum image:
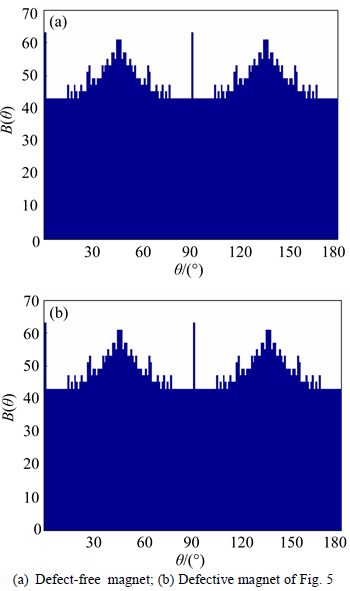
Fig. 8 Number count B(��) of spectrum image:
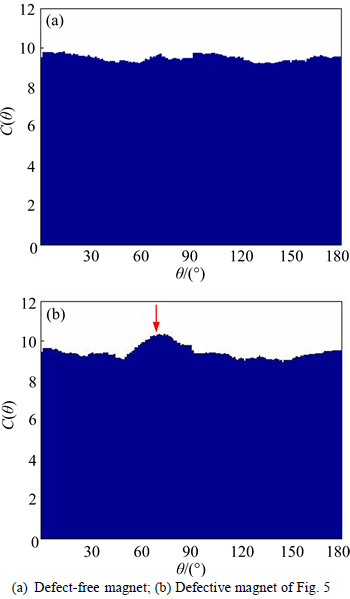
Fig. 9 Average power spectrum C(��):
 (8)
(8)
For a defective magnet surface, the value of R�� should be large because the peak is obvious in C(��), but for a defect-free magnet, the value of R�� should be small because its average spectrum C(��) is smooth. A threshold is used to determine. In this work, according to the experiment, the threshold T�� is given by 0.1.
 (9)
(9)
4.3 Defect location method
If R�� is larger than 0.1, it can be decided as a defective magnet, and then ��0 can be selected as the defect line direction. A defect-free self-reference background image from each individual test image is needed to locate the defect. This can be done by removing all the frequency components that are in the vicinity of each detected line with slope angle ��0 from section 4.2, and then back transform using the inverse discrete Fourier transform.
The defect removing method is shown in Fig. 10. The rectangle area to be removed with the width of w2 and length of L can be defined by two lines L3 and L4:
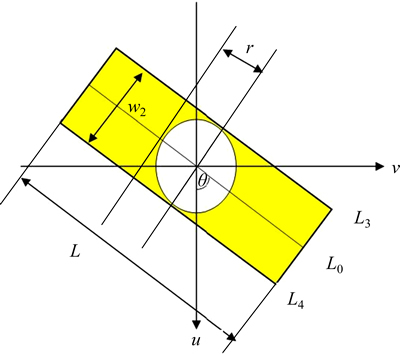
Fig. 10 Removal of defect in Fourier spectrum image
 (10)
(10)
As the global background pattern of a magnet image is represented by the low-frequency components around the DC center in the spectrum image, a small circle around the DC center should be retained. Therefore, the inverse Fourier spectrum is given by
 (11)
(11)
In this work, the circular radius r is set to 4, w is set to 5, and L is set to 20. The self-reference image of an inspection image G(x,y) of size M��N can now be reconstructed by the inverse discrete Fourier transform as
 (12)
(12)
This defect-free reference image D(x,y) is created from the inspection image G(x,y) itself. Defects can be easily identified by subtracting the original image G(x,y) from the reconstructed image D(x,y)
 (13)
(13)
where ��f(x,y) is the difference image containing defect. To remove the noise on ��f(x,y), a threshold T��f is used and given by
 (14)
(14)
where ����f and ����f are the mean and standard deviations of ��f(x,y) in the whole image, and K��f is a pre-determined control constant. Finally, the defect detection results can be represented by a binary image, where the pixel (x,y) with ��f(x,y)>T��f is a defect point and is marked in black, while the other pixels are marked in white in the binary image.
Figures 11(a1) and (b1) show respectively a defect- free and a defective sub-image. Their reconstructed images are presented in Figs. 11(a2) and (b2). Figures 11(a3) and (b3) are the final defect images. The results show that the reconstructed image of the defect-free sample is similar to its original one, and no significant differences are found in the final defect image. In contrast, the reconstructed image of the defective sample effectively blurs the defect, and the differences in the magnitudes of the defect region are significantly large in the final defect image. Figure 11 shows that the method in this work can detect the defects effectively.
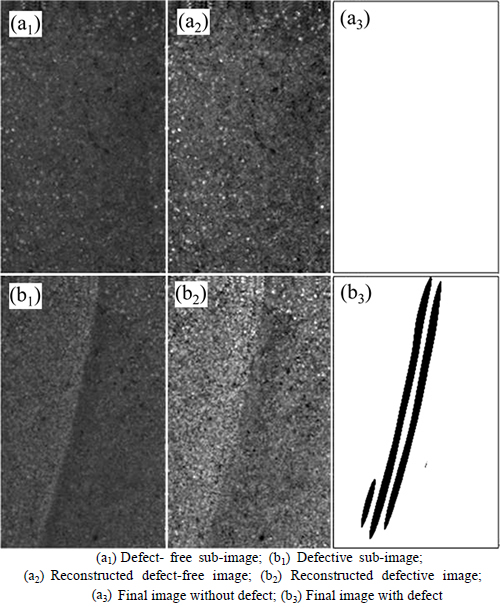
Fig. 11 Image reconstruction and image difference:
5 Results and discussion
In the proposed algorithms, three critical parameters (the width w2 and the circular radius r for defect removing, and the control constant K��f for threshold for the final defect image) may affect the detection results. The effects of changes in the parameters are individually evaluated in the following subsections.
5.1 Effect of rectangle width w2
The rectangle width w2 determines the area for removing the frequency components that correspond to the defects. A small width may not effectively remove the possible defects in the reconstructed image, and defects will be lost in the difference image, causing misdetection of defects in the resulting binary image. However, a large width may remove the frequency components not only of the defects but also of the dark regions in the background, which may generate false alarms for a defect-free magnet.
Figures 12(a) and (b) show a defective image and its corresponding Fourier spectrum, respectively.Figures 12(c1)�C(g1) present the defected area to be removed with varying widths w2 of 1, 3, 5, 7 and 9, and low-frequency components circular radius r of 4. Figures 12(c2)�C(g2) are the corresponding reconstructed images, and Fig. 12(c3)�C(g3) are the resulting binary images with control constant K��f of 2. It can be seen that a very small width of w2 does not remove the defect completely in the reconstructed image, which results in misdetection of defects. A large width of w2 will remove much of the background in the reconstructed image, which generates a minor noisy region in the final defect image. Experiment results show that a width w2 of 5 has the best detection performance.
5.2 Effect of low-frequency components circular radius r
The circular radius r determines the region for preserving the low-frequency components that correspond to the background. Too small radius may not effectively preserve the background in the reconstructed image, and can generate false alarms for defect-free magnet. However, too large radius may preserve the frequency components not only of the background regions but also of the defects, which causes misdetection of defects in the resulting binary image.
Figures 13(a) and (b) show a image of a defective magnet surface and its corresponding Fourier spectrum, respectively. Figures 13(c1)�C(g1) present the low- frequency components with varying circular radius r of 1, 2, 3, 4 and 5, and defect removing width w2 of 5. Figures 13(c2)�C(g2) are the corresponding reconstructed images, and Figs. 13(c3)�C(g3) are the resulting binary images with control constant K��f of 2. It can be seen that a very small radius of r generates a minor noisy region in the final defect image and a large radius of r does not show the presence of the defect completely in the final defect image. Experiments show that a radius of 4 has the best detection performance.
5.3 Effect of control constant K��f
The statistical control limit ����f+K��f������f is used to set the threshold for segmenting defect pixels from the background in the difference image ��f(x,y). Too small control value of K��f gives a tight threshold and may result in false alarms due to identification of the background points as defect points. However, too large a control value gives a loose threshold, which may mis-detect some true defect points.
Figures 14(a1)�C(c1) further present a set of three images of the defective magnets. Figures 14(a2)�C(c2) show the reconstructed images. Figures 14(a3)�C(c3), (a4)�C(c4), (a5)�C(c5), (a6)�C(c6), and (a7)�C(c7) show the detection results as binary images with control constants K��f=1, 2, 3, 4 and 5, respectively. It is shown that a small control constant K��f causes severe noise and a large one causes misdetection of the defect. The K��f value of 2 can detect defects efficiently. Therefore, a K��f of 2 is acceptable to all images and gives better segmentation of defects.
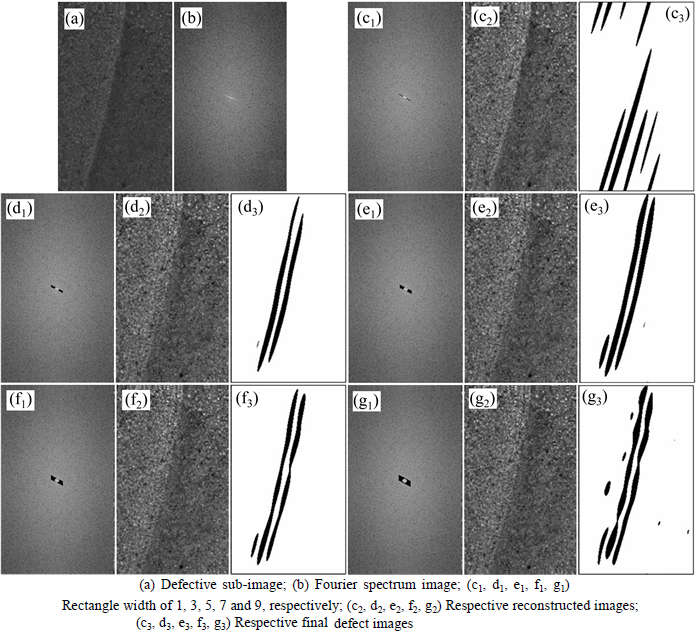
Fig. 12 Effect of changes in defect removing width w2:
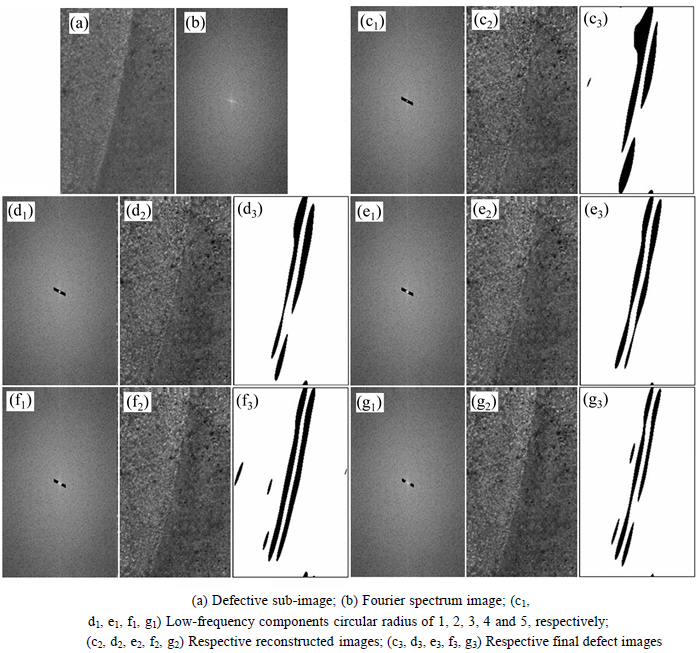
Fig. 13 Effect of changes in low-frequency components circular radius r:
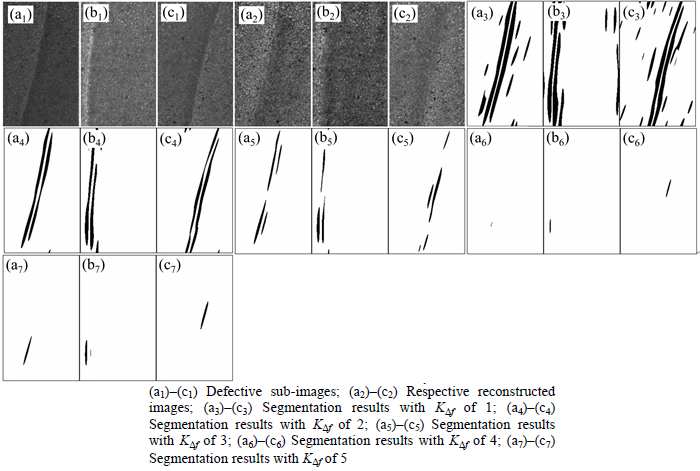
Fig. 14 Effect of changes in control constant K��f for defective magnet:
6 Conclusions
1) An image based magnet surface defect detection system is constructed, and a Fourier image reconstruction based magnet surface image process method is proposed.
2) To identify defects in the surface of a magnet, the frequency components associated with the defects are set to zero in the Fourier image, and then back-transformed to the spatial image to get a self-reference background image. Then a difference image between the original image and its background image is obtained to identify the defect regions.
3) Experimental results show that the proposed method can detect defects effectively and stably for defect-free images. This Fourier transform based method can process a magnet image with size of 200��330 pixels in 0.20 s, and shows some potential for on-line defect inspection in magnet manufacturing. The three main parameters of the proposed method, rectangle width w2 and low-frequency components circular radius r and control constant K��f, affect the defect detection results, and the optimized values are found.
References
[1] XIE X. A review of recent advances in surface defect detection using texture analysis techniques [J]. Electronic Letters on Computer Vision and Image Analysis, 2008, 7: 1-22.
[2] CONNERS R W, CHARLES W M, LIN K, RAMON E V E. Identifying and locating surface defects in wood: Part of an automated lumber processing system [J]. IEEE Transactions on Pattern Analysis and Machine Intelligence, 1983, 5: 573-583.
[3] PERNKOPF F. Detection of surface defects on raw steel blocks using Bayesian network classifiers [J]. Pattern Anal Applic, 2004, 7: 333-342.
[4] SHANKAR N G, ZHONG Z W. Defect detection on semiconductor wafer surfaces [J]. Microelectronic Engineering, 2005, 77: 337-346.
[5] BASHKANSKY M, DUNCAN M D, KAHN M. Subsurface defect detection in ceramics by high-speed high-resolution optical coherent tomography [J]. Optics Letters, 1997, 22: 61-63.
[6] DAVENEL A, GUIZARD C H, LABARRE T. Automatic detection of surface defects on fruit by using a vision system [J]. Journal of Agricultural Engineering Research,1988, 41: 1-9.
[7] GUNATILAKE P, SIEGEL M, JORDAN A G. Image understanding algorithms for remote visual inspection of aircraft surfaces [C]// Electronic Imaging'97��International Society for Optics and Photonics. New York, USA: IEEE Press, 1997: 2-13.
[8] BHARATI M H, LIU J J, MACGREGOR J F. Image texture analysis: methods and comparisons [J]. Chemometrics and Intelligent Laboratory Systems, 2004, 72: 57-71.
[9] SOH L K, TSATSOULIS C. Texture analysis of SAR sea ice imagery using gray level co-occurrence matrices [J]. IEEE Transactions on Geoscience and Remote Sensing, 1999, 37: 780-795.
[10] CHAI H Y, WEE L K, SWEE T T, SALLEH S H, ARIFF A. Gray-level co-occurrence matrix bone fracture detection [J]. American Journal of Applied Sciences, 2011, 8: 26-32.
[11] SU H, WANG Y, XIAO J, LI L. Improving MODIS sea ice detectability using gray level co-occurrence matrix texture analysis method: A case study in the Bohai Sea [J]. ISPRS Journal of Photogrammetry and Remote Sensing, 2013, 85: 13-20.
[12] MANIVANNAN K, AGGARWAL P, DEVABHAKTUNI V, KUMAR A, NIMS D, BHATTACHARYA P. Particulate matter characterization by gray level co-occurrence matrix based support vector machines [J]. Journal of Hazardous Materials, 2012, 223: 94-103.
[13] ZHANG D, ZHAO M, ZHOU Z, PAN S. Characterization of wire rope defects with gray level co-occurrence matrix of magnetic flux leakage images [J]. Journal of Nondestructive Evaluation, 2013, 32(1): 37-43.
[14] VENKAT RAMANA K, RAMAMOORTHY B. Statistical methods to compare the texture features of machined surfaces [J]. Pattern Recognition,1996, 29: 1447-1459.
[15] IIVARINEN J, HEIKKINEN K, RAUHAMAA J, VUORIMAA P, VISA A. A defect detection scheme for web surface inspection [J]. International Journal of Pattern Recognition and Artificial Intelligence, 2000, 14: 735-755.
[16] DING M, HUANG W, LI B, WU S, WEI Z, WANG Y. An automated cotton contamination detection system based on co-occurrence matrix contrast information [C]// Intelligent Computing and Intelligent Systems, 2009. New York, USA: IEEE Press, 2009: 517-521.
[17] PASCHOS G. Fast color texture recognition using chromaticity moments [J]. Pattern Recognition Letters, 2000, 21: 837-841.
[18] WILTSCHI K, PINZ A, LINDEBERG T. Automatic assessment scheme for steel quality inspection [J]. Machine Vision and Applications, 2000, 12: 113-128.
[19] KUMAR A, PANG G K. Defect detection in textured materials using Gabor filters [C]// IEEE Transactions on Industry Applications, 2002, 38: 425-440.
[20] BODNAROVA A, BENNAMOUN M, LATHAM S. Optimal gabor filters for textile flaw detection [J]. Pattern Recognition, 2002, 35: 2973-2991.
[21] MALLAT S G. A theory for multiresolution signal decomposition: the wavelet representation [J]. IEEE Transactions on Pattern Analysis and Machine Intelligence, 1989, 11: 674-693.
[22] CHEN T, KUO C C J. Texture analysis and classification with tree-structured wavelet transform [J]. IEEE Transactions on Image Processing, 1993, 2: 429-441.
[23] MARUO K, SHIBATA T, YAMAGUCHI T, ICHIKAWA M, OHMI T. Automatic defect pattern detection on LSI wafers using image processing techniques [J]. IEICE Transactions on Electronics, 1999, 6: 1003-1012.
[24] SCHARCANSKI J. Stochastic texture analysis for monitoring stochastic processes in industry [J]. Pattern Recognition Letters, 2005, 26: 1701-1709.
[25] YANG X, PANG G, YUNG N. Robust fabric defect detection and classification using multiple adaptive wavelets [J]. IEE Proceedings Vision, Image Processing, 2005, 152(6): 715-723.
[26] LIU S S, JERNIGAN M E. Texture analysis and discrimination in additive noise [J]. Computer Vision, Graphics Image Process, 1990, 49: 52-67.
[27] CHAN C H, PANG G K H. Fabric defect detection by Fourier analysis [J]. IEEE Transactions on Industry Applications, 2000, 36: 1267-1276.
[28] KUMAR A. Computer-vision-based fabric defect detection: A survey [J]. IEEE Transactions on Industrial Electronics, 2008, 55: 348-363.
[29] OHSHIGE T, TANAKA H, MIYAZAKI Y, KANDA T, ICHIMURA H, KOSAKA N, TOMODA T. Defect inspection system for patterned wafers based on the spatial-frequency filterinaz [C]// IEEE/CHMT Int Electronic Manuf Technol Symp. San Francisco, CA, USA, 1991: 192-196.
[30] TSAI D, HEISH C. Automated surface inspection for directional textures [J]. Image and Vision Computing, 1999, 18: 49-62.
[31] TSAI D M, WU S C, LI W C. Defect detection of solar cells in electroluminescence images using Fourier image reconstruction [J]. Solar Energy Materials and Solar Cells, 2012, 99: 250-262.
(Edited by FANG Jing-hua)
Foundation item: Project(51575542) supported by the National Natural Science Foundation of China; Project(2016CX010) supported by the Innovation-Driven Project of CSU, China; Project(2015CB057202) supported by the National Basic Research Program of China
Received date: 2015-03-02; Accepted date: 2015-06-11
Corresponding author: WANG Fu-liang, Professor PhD; Tel: +86-13975145436; E-mail: wangfuliang@csu.edu.cn

