不同焊速下Ti6Al4V激光焊接头显微硬度、组织和晶粒取向联系
来源期刊:中国有色金属学报(英文版)2020年第5期
论文作者:徐甄真 董志强 余钊辉 王文科 张建勋
文章页码:1277 - 1289
关键词:显微硬度;显微组织;晶界角;不均匀性;焊接速度
Key words:microhardness; microstructure; misorientation angle; non-uniformity; welding speed
摘 要:为了提高对Ti6Al4V钛合金激光焊接接头中各微区的显微组织和微区力学性能的理解,对不同焊接速度下接头中显微硬度曲线的分布趋势及其与显微组织和取向差之间的关系进行研究。从焊缝中心到母材,熔合线附近的显微硬度值(Hm)最高。在同一接头中,Hm随着焊缝宽度增加而增加;在不同接头中,Hm随着不均匀度增加而增加。从焊缝到母材,随着马氏体含量减少和初始α相含量增多,显微硬度逐渐降低。当显微组织主要由马氏体组成时,在较宽的焊缝中或在不同焊速接头的焊缝中心,显微硬度随着冷却速率、马氏体大小和马氏体的晶界取向差而变化;焊缝较窄时,冷却速率等引起的显微硬度的差异较小。
Abstract: The microhardness curve trend and its relationships with microstructure and misorientation were analyzed to enhance the comprehension of the microstructure and mechanical property of micro-areas in Ti6Al4V laser-welded joints with different welding speeds. The microhardness measured on the fusion line (Hm) is the highest from the weld center to the base metal. Hm increases with increasing weld width in a welded joint and increasing degree of the non-uniformity in all studied welded joints. The microhardness decreases from the weld metal to the base metal with decreasing amount of martensite α'''' and increasing amount of original α phase. When the microstructure is mainly composed of martensite α'''', the microhardness changes with the cooling rate, grain size of the martensite, and peak values of the fraction of misorientation angle of the martensite in a wide weld metal zone or weld center at different welding speeds, whereas the difference is small in a narrow weld metal zone.
Trans. Nonferrous Met. Soc. China 30(2020) 1277-1289
Zhen-zhen XU, Zhi-qiang DONG, Zhao-hui YU, Wen-ke WANG, Jian-xun ZHANG
State Key Laboratory for Mechanical Behavior of Materials, Xi’an Jiaotong University, Xi’an 710049, China
Received 31 July 2019; accepted 16 February 2020
Abstract: The microhardness curve trend and its relationships with microstructure and misorientation were analyzed to enhance the comprehension of the microstructure and mechanical property of micro-areas in Ti6Al4V laser-welded joints with different welding speeds. The microhardness measured on the fusion line (Hm) is the highest from the weld center to the base metal. Hm increases with increasing weld width in a welded joint and increasing degree of the non-uniformity in all studied welded joints. The microhardness decreases from the weld metal to the base metal with decreasing amount of martensite α' and increasing amount of original α phase. When the microstructure is mainly composed of martensite α', the microhardness changes with the cooling rate, grain size of the martensite, and peak values of the fraction of misorientation angle of the martensite in a wide weld metal zone or weld center at different welding speeds, whereas the difference is small in a narrow weld metal zone.
Key words: microhardness; microstructure; misorientation angle; non-uniformity; welding speed
1 Introduction
Ti6Al4V titanium alloy is widely used in aerospace, petrochemical, biomedical, and numerous other industries owing to its low density, high specific strength, good toughness, high fatigue strength, and superior biocompatibility [1-3]. High energy beam welding and additive manufacturing, such as laser beam welding (LBW) [4-7], electron beam welding [8-10], selective laser melting (SLM) [11-12], and electron beam melting (EBM) [13], of Ti6Al4V titanium alloy have gained tremendous interest owing to its extensive use and smaller distortion compared to that obtained with conventional methods, e.g., tungsten inert gas (TIG) welding [14,15].
The microstructure, microhardness, grain orientations and residual stress were studied in Ti6Al4V high energy beam welding [16-20]. Among the different microstructures of Ti6Al4V titanium alloy under different heat treatment conditions, the yield and tensile strengths of the bimodal microstructure were the highest; the ductility of the equiaxed microstructure was the highest; and the fatigue strength of the lamellar microstructure was the highest [21]. The Vickers microhardness and tensile strength of the martensite α′ in the weld metal are higher than those of the original α in the base metal [22,23]. HONG and SHIN [24] stated that the microhardness measured on the fusion line was higher than that of the weld center in Ti6Al4V laser-welded joints, whereas according to LIU et al [25] the microhardness in the weld metal remained relatively unchanged. This difference was probably caused by the differing welding parameters or plate thicknesses. Welding parameters have significant impacts on the microstructures, microhardness, mechanical properties, and welding defects of the welded joints [26-28]. HONG and SHIN [24] used a multi-physics model to calculate the martensite content in the heat affected zone (HAZ) and weld metal, which proved that the welding speed affected the martensite content and microhardness. Grain orientations of the different regions of a welded joint are related to the transformation process of microstructures during cooling [29-31]. LIU et al [32] observed that the cooling rate increased, grain changed from block to columnar, amount of the sub-grain boundaries in α grains increased, amount of α/α grain boundaries in a single primary β grain decreased, and the β to α transformation changed from diffusion transformation to massive transformation when the welding speed increased.
The thermal process of SLM essentially involves the rapid heating and cooling of a local region, similar to the thermal process of laser beam welding, leading to a similar microstructure in the remelted zone which consists primarily of α′ martensite [33]. In comparison, the microstructure obtained with EBM includes the lamellar micro- structure composed of original α and β owing to the lower cooling rate of EBM versus SLM [34,35]. BRANDL et al [36] found out that the hardness of the as-built blocks decreased from HV0.1 420 at the top to HV0.1 320 at the bottom because of the more homogeneous material at the bottom than the top. PRASHANTH et al [37] joined SLM components by friction welding to form a large SLM structure. The microhardness of the weld metal increased as the size of the martensite α′ platelets decreased [37]. The microhardness of Ti6Al4V SLM samples is usually higher than that of Ti6Al4V laser-welded samples, which results from the low heat input of SLM, whereas the same low heat input will cause the lack of penetration in laser-welded joint.
In the present work, the distributions of the microhardness, microstructure, and grain orientation of a welded joint from the weld metal to the base metal were studied. The influences of the welding speed and microhardness gradient on the microhardness were examined. The relationships of the microhardness, microstructure, and misorientation were also investigated.
2 Experimental
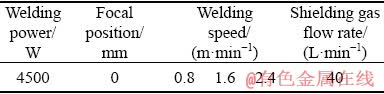
Rolled and annealed Ti6Al4V titanium alloy plates with dimensions of 120 mm × 50 mm × 4 mm were butt-welded by autogenous laser welding. Before welding, the plates were soaked in 10 wt.% NaOH aqueous solution for 10 min and in 5 vol.% hydrofluoric acid and 30 vol.% nitric acid aqueous solution for 2 min. The laser welding equipment includes an IPG YLS-10000-S2T laser and a YASKAWA robot. The shielding gas was argon with purity of 99.99%. The welding parameters are listed in Table 1.
Table 1 Welding parameters during laser welding
The metallographic specimen with dimensions of 14 mm × 10 mm × 4 mm and the electron back- scattered diffraction (EBSD) specimen with dimensions of 7 mm × 10 mm × 4 mm were located 20 mm away from the arcing point to avoid the unstable arc striking region. The metallographic and EBSD specimens were prepared using standard metallographic techniques and electrolytic polishing. The electrolyte for electrolytic polishing contained 5 vol.% glacial acetic acid and 95 vol.% ethanol. For the metallographic specimen, the voltage was 31 V and electrolytic time was 120 s. For the EBSD specimen, the voltage was 28 V and electrolytic time was 90 s. The metallographic specimen was etched for 30 s in a solution containing 2 vol.% hydrofluoric acid and 2 vol.% nitric acid and observed using a ZEISS Axio Imager M2m optical microscope. The EBSD specimen was analyzed after electrolytic polishing using a ZEISS MERLIN Compact SEM equipped with an Oxford Nordlys MAX EBSD system. The EBSD tests were operated at an accelerating voltage of 15 kV, a working distance of about 20 mm, and a step size of 0.3 μm.
The Vickers microhardness test was performed on the prepared metallographic specimen using a Vickers THVS-50 digital microhardness tester. The test load was 500 g, the load time was 15 s, and the spacing between two microhardness points was 0.2 mm. The microhardness distribution of the weld center (Vertical in Fig. 1) from the top surface to the bottom surface was tested. Moreover, the microhardness distributions were tested at different depths (0.5, 1.5, 2.5, and 3.5 mm from the bottom surface in Fig. 1) from the weld center line (WCL) to the base metal. In Fig. 1, the irregular yellow lines represent grain boundaries of the prior β phase, black lines represent the locations of microhardness test, red dashed line represents the fusion line, red dotted line represents the fully transformed HAZ (FTHAZ)/partially transformed HAZ (PTHAZ) boundary, and red solid line represents the HAZ/base metal boundary.

Fig. 1 Observed and tested cross-section of welded joint with welding speed of 1.6 m/min
3 Results
3.1 Microstructures of Ti6Al4V laser-welded joint
As can be seen from Fig. 2, the microstructure of the base metal (Fig. 2(a)) is composed of a white equiaxed original α phase and black intergranular original β phase. The microstructure of the weld metal (Fig. 2(b)) is mainly martensite α'. The martensite α' is acicular and separated by the grain boundaries of the prior β phase. During cooling of the weld metal, parallel primary martensites nucleate and grow until they reach the grain boundaries. Moreover, short secondary martensites grow in a direction perpendicular to that of the primary martensites. The secondary martensites stop growing when they encounter grain boundaries or primary martensites. HAZ can be divided into FTHAZ (Fig. 2(c)) and PTHAZ (Fig. 2(d)) based on the microstructure. The highest temperature of the FTHAZ, which is near the weld metal, exceeds the β transus temperature. The microstructure of the FTHAZ mainly includes an acicular martensite α' and a blocky transformed α. The transformed α in HAZ has clear irregular grain boundaries, and it typically occurs in the vicinity of the martensite α'. The highest temperature of the PTHAZ, which is near the base metal, is lower than the β transus temperature. Besides the acicular martensite α' and blocky transformed α, original α and β phases are present in the PTHAZ. From the weld metal to the base metal, the amount of martensite α' decreases, the amounts of the original α and β phases increase, and the amount of transformed α initially increases and then decreases.

Fig. 2 Microstructures of Ti6Al4V laser-welded joints
3.2 Grain orientation of Ti6Al4V laser-welded joint
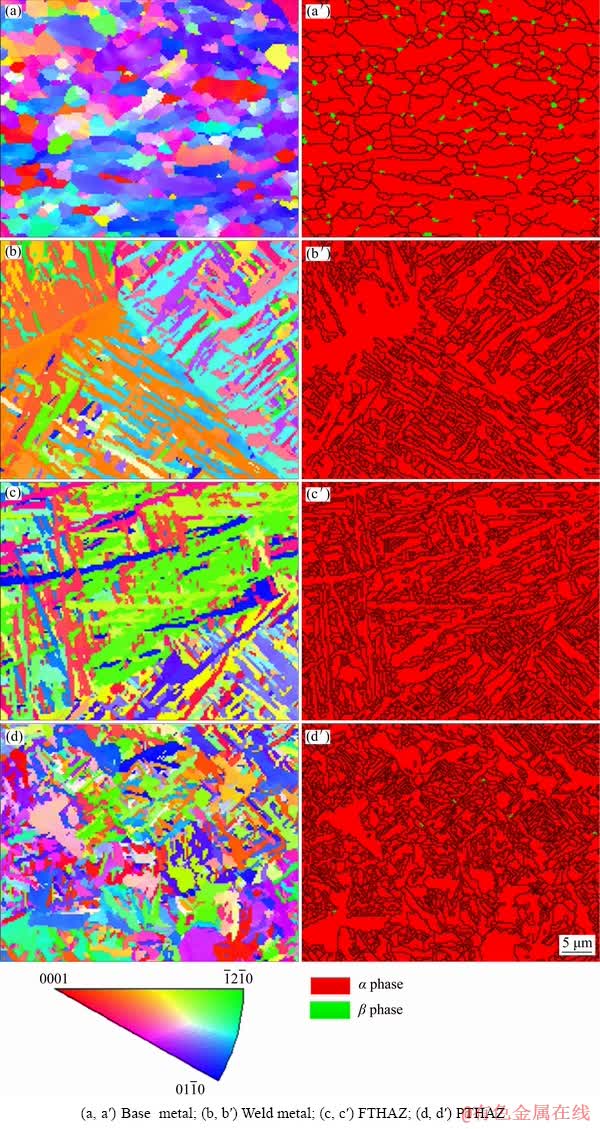
Fig. 3 Grain orientation (a, b, c, d) and grain boundary (a′, b′, c′, d′ ) maps of Ti6Al4V laser-welded joint
Figure 3 shows the grain orientation and grain boundary maps of the grain misorientations above 10° of various micro-areas in the Ti6Al4V laser- welded joint. In the base metal, the green β phase is distributed at the grain boundaries of the red original α phase. There is a little β phase in the PTHAZ. The red α grains with a large aspect ratio in the weld metal and HAZ are martensite. In a prior β grain, the martensites in the weld metal are nearly perpendicular to each other. The length of the martensite in the PTHAZ is shorter than that in the FTHAZ. In the weld metal, the areas with sparse grain boundaries are grain boundaries of the prior β. The microstructure of the grain boundaries of the prior β phase is α phase, and the less grain boundaries than martensites indicate that the α phase at the grain boundaries of prior β is transformed to α instead of martensite α'.
The distributions of the grain misorientations above 10° of the α phase in the base metal and weld metal are significantly different, as shown in Fig. 4. The misorientations of the original α in the base metal are in the range of 10°-94°. The peak of the fraction of grain misorientations of the original α in the base metal is around 10°, and the peak value is lower than 0.05. The weld metal is mainly composed of martensite, and the misorientations of the α phase in the weld metal are in the ranges of 9.5°-13.5°, 52.5°-66.5°, and 86.5°-91.5°. The peaks of the fraction of grain misorientations in the weld metal are around 11°, 60°, 64°, and 90°, and the peak values at 60° and 64° are much higher than those of the fraction of the grain misorientations of the original α. Martensite follows the Burgers orientation relationship (BOR) of {0001}α//{110}β, <1120>α//<111>β with prior β grains during the rapid cooling of the laser welding [38,39], which makes the misorientations of martensite distribute in a specific range. The distributions of the grain misorientations of the HAZ are similar to those of the weld metal because the HAZ contains a large amount of martensites. The differences between the fraction of the grain misorientations of the HAZ and the weld metal are shown in the peak values at 60° and 90° of the HAZ being lower and higher than those of the weld metal, respectively. The misorientations of the PTHAZ are not only in the ranges of 9.5°-13.5°, 52.5°-66.5°, and 86.5°-91.5°, as can be seen in the inset of Fig. 4(d), which indicates that the original α exists in the PTHAZ. From the weld metal to the base metal, the peak value of the fraction at 10° of the misorientations increases, the peak value at 60° decreases, and the peak values at 64° and 90° initially increase and then decrease.

Fig. 4 Grain misorientations of α phase in different micro-areas of welded joint
3.3 Non-uniform microhardness distribution of welded joint at three different welding speeds
Figure 5 shows the microhardness distributions at different depths (0.5, 1.5, 2.5, and 3.5 mm from the bottom surface) of the welded joint obtained at a welding speed of 1.6 m/min. The scatter points in Fig. 5 are the measured values of the microhardness, and the curves in Fig. 5 are the fitted curves using a linear fit in the weld metal and the DoseResp function in the HAZ and base metal. There is little difference in the microhardness of the weld center in a welded joint at different depths. The microhardness curve of the upper weld metal (3.5 mm from the bottom surface) rises from the WCL to the fusion line, and those of the lower (0.5 mm from the bottom surface) and middle weld metals (1.5 and 2.5 mm from the bottom surface) are flat. Moreover, the rise in the microhardness curve causes the microhardness near the fusion line of the upper weld metal to be higher than those of the lower and middle weld metals having a flat microhardness curve. Figure 5(b) shows the characteristic microhardness curves of the Ti6Al4V laser-welded joint. The microhardness of the martensite α' is higher than that of the original α because more lattice imperfections are caused by the fast cooling rate in martensite, which results in a higher microhardness for the weld metal than the base metal. In Fig. 5(b), the flat solid line in the weld metal represents the microhardness curve of the lower and middle weld metals in Fig. 5(a), whereas the rising dashed line in the weld metal represents the microhardness curve of the upper weld metal in Fig. 5(a). Hm is the maximum microhardness in the microhardness curve, which is located near the fusion line. In the PTHAZ, the microhardness decreases gradually from the FTHAZ/PTHAZ boundary to the base metal.

Fig. 5 Microhardness distributions at different depths with welding speed of 1.6 m/min (a) and characteristic microhardness curves (b)
Figure 6 shows the relationships between the weld width and slope of the microhardness curve of the weld metal at various depths of the welded joints at three different welding speeds. When the weld width is smaller than 1.1 mm, the slope of the microhardness curve of the weld metal is zero, which implies that the microhardness curve of the weld metal is flat, and Hm is as high as the microhardness of the weld center. When the weld width is larger than 1.1 mm, the slope of the microhardness curve of the weld metal rises with increasing weld width in general. The slope of the microhardness curve of the weld metal is positive, which implies that the microhardness increases from the WCL to the fusion line. The points that are marked in Fig. 6 will be explained subsequently in the discussion section.

Fig. 6 Relationships between weld width and slope of microhardness curve of weld metal
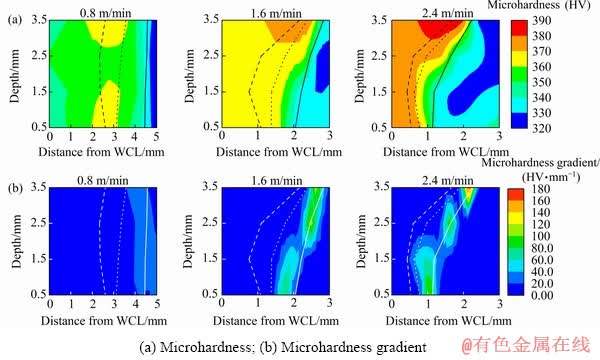
Fig. 7 Contours of welded joints
Figure 7 shows non-uniform distributions of the microhardness and microhardness gradient of the Ti6Al4V laser-welded joints at three different
welding speeds. The microhardness near the fusion line of the upper joint is the highest in a welded joint. The highest microhardness increases with the increasing welding speed. When the welding speed is 0.8 m/min, the microhardness of the welded joint is uniform in thickness. When the welding speeds are 1.6 and 2.4 m/min, the microhardness of the upper HAZ is higher than that of the lower HAZ. The degree of the non-uniformity of the microhardness in thickness increases with the increasing welding speed. The microhardness gradient is the absolute value of the changing rate of the microhardness, which represents the degree of non-uniformity in the transverse direction of the welded joints. From the WCL to the base metal, the microhardness gradient of the PTHAZ is the highest. As the welding speed increases, the microhardness gradient increases, which implies that the degree of non-uniformity in the transverse direction increases. When the welding speed is high, e.g., 1.6 and 2.4 m/min, the microhardness gradient of the upper HAZ is higher than that of the lower HAZ.
3.4 Relationship between microhardness, micro- structure, and grain misorientation
3.4.1 Comparison of different micro-areas in weld metal
The microstructure in the weld metal is mainly martensites α', but the microhardness of different micro-areas in the weld metal is significantly different when the weld width is large. Thus, four micro-areas in the weld metal, which were 1.0, 1.5, 2.0 and 2.6 mm from the WCL and near the top surface of the welded joint with a welding speed of 0.8 m/min, were selected to analyze the micro- structure morphology and grain misorientations when the weld width is wide. As the distance from the WCL increases, the amount of martensite boundaries increases, and the martensites become finer after ignoring the prior β grain boundaries (Fig. 8(a)). The misorientation angles in Fig. 8(b) are basically in the range of those of martensites because the weld metal is mainly composed of martensites. As the distance from the WCL increases, the peak value of the fraction at 60° of the misorientation decreases by 0.066, whereas that at 64° increases by 0.076 and 90° increases by 0.031. Figure 8(c) shows that the microhardness increases and the grain area of the martensite decreases exponentially from the weld center to the fusion line in the wide weld metal zone.
Three micro-areas in the weld metal, which were 0.1, 0.5 and 0.8 mm from the WCL and near the bottom surface of the welded joint at a welding speed of 1.6 m/min, were selected to analyze the microstructure morphology and grain mis- orientations when the weld width is narrow. As the distance from the WCL increases, the amount of martensite boundaries has no significant change (Fig. 9(a)). As can be seen from Fig. 9(b), the peak value of the fraction at 60° of the misorientations is lower than 0.20, and it has no tendency when the distance from the WCL increases. The peak values of the fraction at 64° and 90° decrease with the increasing distance from the WCL, which is opposite with that in the wide weld metal zone. Figure 9(c) shows that there is little change in the microhardness and the grain area of the martensites from the weld center to the fusion line in the narrow weld metal zone.
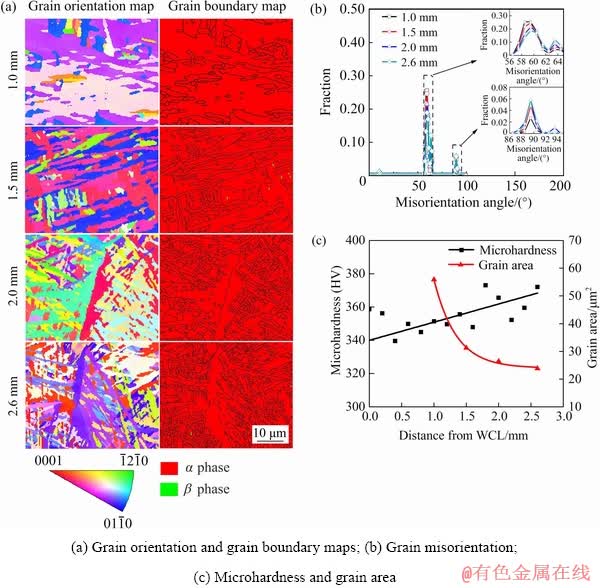
Fig. 8 Misorientations and microhardness of micro-areas with different distances from WCL in wide weld metal zone
3.4.2 Comparison of weld center at different welding speeds
As the welding speed increases from 0.8 to 2.4 m/min, martensite laths are finer (Fig. 10(a)), the peak value of the fraction at 60° of the misorientations of the martensites decreases, whereas the peak values at 64° and 90° increase (Fig. 10(b)), the grain area of the martensites decreases from 31 to 19 μm2 and the microhardness increases from HV 359 to 378 (Fig. 10(c)). The increase in the welding speed leads to an increase in the cooling rate [40], which shortens the growth time of the martensites, makes the martensites finer, and changes the peak values of the grain misorientations of the martensites.
4 Discussion
4.1 Microstructures and phase transformations in Ti6Al4V laser-welded joint

Fig. 9 Misorientations and microhardness of micro-areas with different distances from WCL in narrow weld metal zone

Fig. 10 Misorientations and microhardness of weld center of welded joints at different welding speeds
Ti6Al4V alloy is a two-phase titanium alloy including the original α and β phases. The crystal structure of the original α phase is hexagonal close packed (HCP), and its lattice parameters are a=b=0.292 nm and c=0.466 nm [38]. Al is rich in the α phase, which is stable at low temperatures such as 20 °C. The crystal structure of the original β phase is body centered cubic (BCC), and its lattice parameters are a=b=c=0.320 nm [41,42]. V is rich in the β phase, which is stable at high temperatures such as 1000 °C. During the solidification of the liquid metal, the liquid phase transforms into the prior β phase, and then the priorβ phase transforms into the α variants. The type of the α variant that forms during cooling depends on the cooling rate. When the cooling rate is higher than 410 °C/s, the prior β phase transforms into fully martensite α' via a diffusionless transformation during cooling. When the cooling rate is in the range of 20-410 °C/s, the prior β phase transforms into the martensite α' phase via a diffusionless transformation and into the transformed α via a massive transformation during cooling. When the cooling rate is lower than 20 °C/s, the prior β phase transforms into the equilibrium α phase by a diffusion transformation during cooling. The transformed α nucleates successively at the prior β boundaries, martensite plates adjacent to the prior β boundaries, and individual martensite α' plates within the prior β grains with decreasing cooling rate [43].
In the weld metal, the metal transforms into the liquid phase during heating. And the liquid transforms into the prior β phase, then transforms into martensite α' and transformed α after rapid cooling during laser welding. In the FTHAZ, the metal transforms into the prior β phase during heating. And the prior β phase converts into martensite α' and transformed α phase during rapid cooling. In the PTHAZ, some original α transforms into the prior β phase during heating, then the prior β phase turns into martensite α' and transformed α phase during rapid cooling, and some original α and β phase do not transform into the prior β phase during heating because the temperature is lower than the β transus temperature.
4.2 Relationships between microhardness, weld width, and non-uniformity
Figure 11(a) exhibits the relationship between the microhardness (Hm) and weld width. In a welded joint, Hm increases with increasing weld width. In the welded joints at different welding speeds, the highest and lowest Hm both increase with increasing welding speed. The microhardness point which is marked with a circle in Fig. 6 is the microhardness of the upper weld metal at a welding speed of 2.4 m/min where a large microhardness gradient exists. The microhardness point which is marked with a box in Fig. 6 is the microhardness of the middle weld metal at a welding speed of 0.8 m/min where a small microhardness gradient exists, which indicates that the microhardness of the weld metal is not only relevant with the weld width, but also with the microhardness gradient. Figure 11(b) exhibits the relationship between the microhardness and non-uniformity. Hm increases with the increasing microhardness gradient and welding speed, which implies that Hm increases with the increasing degree of non-uniformity.
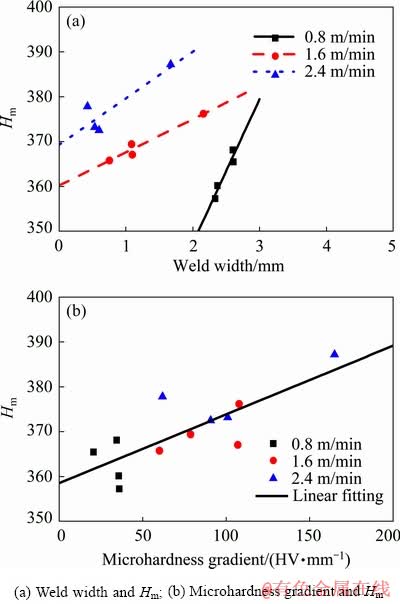
Fig. 11 Relationships between weld width, microhardness gradient and Hm
4.3 Relationships between microhardness, micro- structure, and misorientation
There are three types of misorientation angles in the welded joints of Ti6Al4V: 2-8.029° of substructure boundaries (Type 1); 8.029-13.029°, 57.5-65.762° and 87.5-92.5° of α/α grain boundaries in one parent β grain (Type 2); 13.029-57.5°, 65.762-87.5° and 92.5-94° of α/α grain boundaries in two parent β grains (Type 3) [32]. Subgrains and misorientation angles less than 10° are not considered in this study. The grain boundaries of the martensites are α/α grain boundaries in one parent β grain. And the misorientation angles of the weld metal and FTHAZ, which are composed of mainly martensite, basically fall in the range of the misorientation angles of Type 2. The grain boundaries of the original α phase are α/α grain boundaries in two parent β grains. Thus, the fraction of Type 2 could represent the amount of the martensite, and the fraction of the other misorientation angles except Type 2 could represent the amount of the original α phase. Figure 12 shows the microhardness, fraction of type 2 and other misorientation angles in the weld metal, FTHAZ, PTHAZ, and base metal. The differences in the microhardness and fraction of misorientations in the weld metal and FTHAZ are small. From the FTHAZ to the base metal, the microhardness decreases by about HV 40 with decreasing amount of the fraction of type 2 misorientation angles and increasing amount of the other, which means that the microhardness decreases with decreasing amount of the martensite α' and increasing amount of the original α.
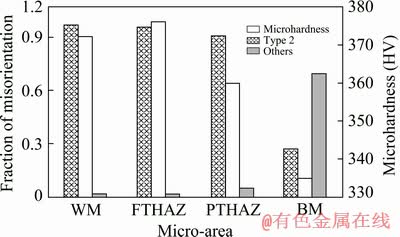
Fig. 12 Fraction of misorientation angles and microhardness of different micro-areas
When the microstructure is mainly martensite, such as in the weld metal, the microhardness still fluctuates. The microhardness near the fusion line is higher than that of the weld center when the weld width is wide. This is because the differences in the cooling rate, grain size, and the fraction of misorientation of the weld center and fusion line are much larger for a wide weld metal zone than a narrow weld metal zone. Moreover, the microhardness of the weld center increases with increasing welding speed. The cooling rate of the fusion line is higher than that of the weld center [24], and the cooling rate increases with increasing welding speed [40]. When the microhardness increases obviously in the weld metal, the cooling rate increases, the amount of grain boundaries of the martensites increases, the grain area of the martensites decreases; the peak value of the fraction at 60° of the misorientations of the martensite decreases, whereas those at 64° and 90° increase. Figure 13 shows the relationships of the microhardness and peak values of the fraction of misorientations of the martensite in the weld metal zone. As the microhardness increases, the peak value of the fraction at 10° of misorientations is nearly invariable, where as that decreases at 60°, increases at 64° and slightly increases at 90°.

Fig. 13 Relationship between fraction of misorientation and microhardness in wide weld metal zone
5 Conclusions
(1) From the weld metal to the base metal, the microhardness decreases with decreasing amount of the martensite α' phase and increasing amount of the original α phase, and the amount of the transformed α phase first increases and then decreases. Further, the peak value of the fraction at 10° of the misorientation angles increases, the peak value at 60° decreases, and the peak values at 64° and 90° first increase and then decrease from the weld metal to the base metal.
(2) The microhardness measured on the fusion line, Hm, is the highest from the weld center to the base metal. As the welding speed increases, the highest microhardness of the welded joint and the degree of non-uniformity of the microhardness in thickness and transverse direction both increase. Hm increases with increasing weld width in a welded joint and increasing degree of non-uniformity in different welded joints.
(3) When the weld width is small, the change is small between the microhardness, grain area of the martensite and peak value of the fraction of the misorientations in the weld metal. When the weld width is wide, the microhardness increases, the grain area of the martensites decreases, and the peak value of the fraction at 60° of the misorientations of the martensite decreases, whereas the peak values at 64°and 90° increase with increasing cooling rate from the weld center to the fusion line or when welding speed increases.
References
[1] RACK H J, QAZI J I. Titanium alloys for biomedical applications [J]. Materials Science and Engineering C, 2006, 26: 1269-1277.
[2] FROEND M, FOMIN F, RIEKEHR S, ALVAREZ P, ZUBIRI F, BAUER S, KLUSEMANN B, KASHAEV N. Fiber laser welding of dissimilar titanium (Ti-6Al-4V/cp- Ti) T-joints and their laser forming process for aircraft application [J]. Optics and Laser Technology, 2017, 96: 123-131.
[3] BARTOLOMEU F, BUCIUMEANU M, PINTO E, ALVES N, SILVA F S, CARVALHO O, MIRANDA G. Wear behavior of Ti6Al4V biomedical alloys processed by selective laser melting, hot pressing and conventional casting [J]. Transactions of Nonferrous Metals Society of China, 2017, 27: 829-838.
[4] CASALINO G, CURCIO F, MINUTOLO F M C. Investigation on Ti6Al4V laser welding using statistical and Taguchi approaches [J]. Journal of Materials Processing Technology, 2005, 167: 422-428.
[5] KASHAEV N, VENTZKE V, FOMICHEV V, FOMIN F, RIEKEHR S. Effect of Nd:YAG laser beam welding on weld morphology and mechanical properties of Ti-6Al-4V butt joints and T-joints [J]. Optics and Lasers in Engineering, 2016, 86: 172-180.
[6] KUMAR U, GOPE D K, SRIVASTAVA J P, CHATTOPADHYAYA S, DAS A K, KROLCZYK G. Experimental and numerical assessment of temperature field and analysis of microstructure and mechanical properties of low power laser annealed welded joints [J]. Materials, 2018, 11: 1-14.
[7] ZHANG Jian-xun, SONG Xu, ZHENG Li. Investigation into plastic damage behavior of the CO2 laser deep penetration welded joint for Ti-6Al-4V alloy [J]. Engineering Fracture Mechanics, 2012, 83: 1-7.
[8] WANG Shao-gang, WU Xin-qiang. Investigation on the microstructure and mechanical properties of Ti-6Al-4V alloy joints with electron beam welding[J]. Materials and Design, 2012, 36: 663-670.
[9] GAO Fu-yang, LI Pei-yue, JIANG Peng, LIAO Zhi-qian. The effect of constraint conditions on microstructure and properties of titanium alloy electron beam welding [J]. Materials Science and Engineering A, 2018, 721: 117-124.
[10] LIU Jing, GAO Xiao-long, ZHANG Lin-jie, ZHANG Jian-xun. Effects of the heterogeneity in the electron beam welded joint on mechanical properties of Ti6Al4V alloy [J]. Journal of Materials Engineering and Performance, 2015, 24: 319-328.
[11] WU S Q, LU Y J, GAN Y L, HUANG T T, ZHAO C Q, LIN J J, GUO S, LIN J X. Microstructural evolution and microhardness of a selective-laser-melted Ti-6Al-4V alloy after post heat treatments [J]. Journal of Alloys and Compounds, 2016, 67: 643-652.
[12] THIJS L, VERHAEGHE F, CRAEGHS T, HUMBEECK J V, KRUTH J P. A study of the microstructural evolution during selective laser melting of Ti-6Al-4V [J]. Acta Materialia, 2010, 58: 3303-3312.
[13] HRABE N, HEROLD T G, QUINN T. Fatigue properties of a titanium alloy (Ti-6Al-4V) fabricated via electron beam melting (EBM): Effects of internal defects and residual stress [J]. International Journal of Fatigue, 2017, 94: 202-210.
[14] GAO Xiao-long, ZHANG Lin-jie, LIU Jing, ZHANG Jian-xun. A comparative study of pulsed Nd:YAG laser welding and TIG welding of thin Ti6Al4V titanium alloy plate [J]. Materials Science and Engineering A, 2013, 559: 14-21.
[15] JUNAID M, BAIG M N, SHAMIR M, KHAN F N, REHMAN K, HAIDER J. A comparative study of pulsed laser and pulsed TIG welding of Ti-5Al-2.5Sn titanium alloy sheet [J]. Journal of Materials Processing Technology, 2017, 242: 24-38.
[16] LIU Zheng, ZHAO Zi-bo, LIU Jian-rong, WANG Lei, YANG Guang, GONG Shui-li, WANG Qing-jiang, YANG Rui. Effect of α texture on the tensile deformation behavior of Ti-6Al-4V alloy produced via electron beam rapid manufacturing [J]. Materials Science and Engineering A, 2019, 742: 508-516.
[17] AHMADIAN P, ABBASI S M, MORAKABATI M. The role of initial α-phase orientation on tensile and strain hardening behavior of Ti6Al4V alloy [J]. Materials Today Communications, 2017, 13: 332-345.
[18] LEARY R K, MERSON E, BIRMINGHAM K, HARVEY D, BRYDSON R. Microstructural and microtextural analysis of InterPulse GTCAW welds in Cp-Ti and Ti-6Al-4V [J]. Materials Science and Engineering A, 2010, 527: 7694-7705.
[19] JUNAID M, KHAN F N, BAKHSH N, BAIG M N, RAHMAN K. Study of microstructure, mechanical properties and residual stresses in full penetration electron beam welded Ti-5Al-2.5Sn alloy sheet [J]. Materials and Design, 2018, 139: 198-211.
[20] BALOYI N M, POPOOLA A P I, PITYANA S L. Microstructure, hardness and corrosion properties of laser processed Ti6Al4V-based composites [J]. Transactions of Nonferrous Metals Society of China, 2015, 25: 2912-2923.
[21] LEE Y T, PETERS M, WIRTH G. Effects of thermomechanical treatment on microstructure and mechanical properties of blended elemental Ti-6Al-4V compacts [J]. Materials Science and Engineering A, 1988, 102: 105-114.
[22] TSAY L W, TSAY C Y. The effect of microstructures on the fatigue crack growth in Ti-6Al-4V laser welds [J]. International Journal of Fatigue, 1997, 19: 713-720.
[23] CAO X, JAHAZI M. Effect of welding speed on butt joint quality of Ti-6Al-4V alloy welded using a high-power Nd:YAG laser [J]. Optics and Lasers in Engineering, 2009, 47: 1231-1241.
[24] HONG K M, SHIN Y C. Analysis of microstructure and mechanical properties change in laser welding of Ti6Al4V with a multiphysics prediction model [J]. Journal of Materials Processing Technology, 2016, 237: 420-429.
[25] LIU H, NAKATA K, YAMAMOTO N, LIAO J. Microstructural characteristics and mechanical properties in laser beam welds of Ti6Al4V alloy [J]. Journal of Materials Science, 2012, 47: 1460-1470.
[26] KUMAR C, DAS M, PAUL C P, BINDRA K S. Comparison of bead shape, microstructure and mechanical properties of fiber laser beam welding of 2 mm thick plates of Ti-6Al-4V alloy [J]. Optics and Laser Technology, 2018, 105: 306-321.
[27] AHN J, CHEN L, DAVIES C M, DEAR J P. Parametric optimisation and microstructural analysis on high power Yb-fibre laser welding of Ti-6Al-4V [J]. Optics and Lasers in Engineering, 2016, 86: 156-171.
[28] AKMAN E, DEMIR A, CANEL T, SINMAZCELIK T. Laser welding of Ti6Al4V titanium alloys [J]. Journal of Materials Processing Technology, 2009, 209: 3705-3713.
[29] KASHAEV N, PUGACHEV D, VENTZKE V, FOMIN F, BURKHARDT I, ENZ J, RIEKEHR S. Microstructure and mechanical performance of autogenously fibre laser beam welded Ti-6242 butt joints [J]. Materials Science and Engineering A, 2017, 694: 110-120.
[30] WU Ming-yu, XIN Ren-long, WANG Ying, ZHOU Yang, WANG Ke, LIU Qing. Microstructure, texture and mechanical properties of commercial high-purity thick titanium plates jointed by electron beam welding [J]. Materials Science and Engineering A, 2016, 677: 50-57.
[31] MAAWAD E, GAN W, HOFMANN M, VENTZKE V, RIEKEHR S, BROKMEIER H G, KASHAEV N, MULLER M. Influence of crystallographic texture on the microstructure, tensile properties and residual stress state of laser-welded titanium joints [J]. Materials and Design, 2016, 101: 137-145.
[32] LIU H, NAKATA K, ZHANG J X, YAMAMOTO N, LIAO J. Microstructural evolution of fusion zone in laser beam welds of pure titanium [J]. Materials Characterization, 2012, 65: 1-7.
[33] ZHANG Qi, LIANG Zheng-long, CAO Miao, LIU Zi-fan, ZHANG An-feng, LU Bing-heng. Microstructure and mechanical properties of Ti6Al4V alloy prepared by selective laser melting combined with precision forging [J]. Transactions of Nonferrous Metals Society of China, 2017, 27: 1036-1042.
[34] GONG Hai-jun, RAFI K, GU Heng-feng, JANAKI-RAM G D, STARR T, STUCKER B. Influence of defects on mechanical properties of Ti-6Al-4V components produced by selective laser melting and electron beam melting [J]. Materials and Design, 2015, 86: 545-554.
[35] ZHAO Xiao-li, LI Shu-jun, ZHANG Man, LIU Yan-dong, SERCOMBE T B, WANG Shao-gang, HAO Yu-lin, YANG Rui, MURR L E. Comparison of the microstructures and mechanical properties of Ti-6Al-4V fabricated by selective laser melting and electron beam melting [J]. Materials and Design, 2016, 95: 21-31.
[36] BRANDL E, SCHOBERTH A, LEYENS C. Morphology, microstructure, and hardness of titanium (Ti-6Al-4V) blocks deposited by wire-feed additive layer manufacturing (ALM) [J]. Materials Science and Engineering A, 2012, 532: 295-307.
[37] PRASHANTH K G, DAMODARAM R, MAITY T, WANG P, ECKERT J. Friction welding of selective laser melted Ti6Al4V parts [J]. Materials Science and Engineering A, 2017, 704: 66-71.
[38] YANG Jing-jing, YU Han-chen, YIN Jie, GAO Ming, WANG Ze-min, ZENG Xiao-yan. Formation and control of martensite in Ti-6Al-4V alloy produced by selective laser melting [J]. Materials and Design, 2016, 108: 308-318.
[39] NEIKTER M, WORACEK R, MAIMAITIYILI T, SCHEFFZUK C, STROBL M, ANTTI M L, AKERFELDT P, PEDERSON R, BJERKEN C. Alpha texture variations in additive manufactured Ti-6Al-4V investigated with neutron diffraction [J]. Additive Manufacturing, 2018, 23: 225-234.
[40] XU Pei-quan, LI Lei-jun, ZHANG Chun-bo. Microstructure characterization of laser welded Ti-6Al-4V fusion zones [J]. Materials Characterization, 2014, 87: 179-185.
[41] YANG Y, LIU Y J, CHEN J, WANG H L, ZHANG Z Q, LU Y J, WU S Q, LIN J X. Crystallographic features of α variants and β phase for Ti-6Al-4V alloy fabricated by selective laser melting [J]. Materials Science and Engineering A, 2017, 707: 548-558.
[42] XU X, LUI E W, PATERAS A, QIAN M, BRANDT M. In situ tailoring microstructure in additively manufactured Ti-6Al-4V for superior mechanical performance [J]. Acta Materialia, 2017, 125: 390-400.
[43] AHMED T, RACK H J. Phase transformations during cooling in α+β titanium alloys [J]. Materials Science and Engineering A, 1998, 243: 206-211.
徐甄真,董志强,余钊辉,王文科,张建勋
西安交通大学 金属材料强度国家重点实验室,西安 710049
摘 要:为了提高对Ti6Al4V钛合金激光焊接接头中各微区的显微组织和微区力学性能的理解,对不同焊接速度下接头中显微硬度曲线的分布趋势及其与显微组织和取向差之间的关系进行研究。从焊缝中心到母材,熔合线附近的显微硬度值(Hm)最高。在同一接头中,Hm随着焊缝宽度增加而增加;在不同接头中,Hm随着不均匀度增加而增加。从焊缝到母材,随着马氏体含量减少和初始α相含量增多,显微硬度逐渐降低。当显微组织主要由马氏体组成时,在较宽的焊缝中或在不同焊速接头的焊缝中心,显微硬度随着冷却速率、马氏体大小和马氏体的晶界取向差而变化;焊缝较窄时,冷却速率等引起的显微硬度的差异较小。
关键词:显微硬度;显微组织;晶界角;不均匀性;焊接速度
(Edited by Xiang-qun LI)
Foundation item: Project (51875442) supported by the National Natural Science Foundation of China
Corresponding author: Jian-xun ZHANG; Tel: +86-29-82668807; E-mail: jxzhang@mail.xjtu.edu.cn
DOI: 10.1016/S1003-6326(20)65295-5

