半固态铸造A356铝合金 冷却斜槽工艺参数的建模与优化
来源期刊:中国有色金属学报(英文版)2014年第4期
论文作者:Hamed KHOSRAVI Reza ESLAMI-FARSANI Mohsen ASKARI-PAYKANI
文章页码:961 - 968
关键词:A356铝合金;冷却斜槽加工;建模;D-实验优化设计
Key words:A356 aluminum alloy; cooling slope process; modeling; D-optimal design of experiment
摘 要:使用冷却斜槽工艺加工半固态A356铝合金。运用D-实验优化设计(DODE)设计实验并分析实验结果。采用软件抽取38个随机实验。冷却斜板长度为100、300、500 mm,斜板的斜角为30°、45°、60°,浇铸温度为660、680和700 °C。将半固态铝合金浇铸到铜质冷却斜板上,然后倾入到钢模中成型。铸造完成之后,在温度590 °C下,对部分样品进行5、8、12 min重熔处理。研究这些因素对初生α(Al)晶体圆整度的影响,并使用DODE进行参数优化处理。结果表明,传统铸造A356合金的初生α(Al)相为枝晶,而冷却斜槽铸造的为非枝晶。重熔后再经过冷却斜槽处理的样品呈现出球状结构。最优的浇铸温度、冷却板长度、斜角和保温时间分别为660 °C、360 mm、48°和9 min。在最优条件下,得到初生晶体的圆整度为0.91。所建立的模型的相关系数为0.9860。
Abstract: Semi-solid processing (SSP) of A356 aluminum alloy was discussed via cooling slope (CS) method. The D-optimal design of experiment (DODE) was employed for experimental design and analysis of results. 38 random experiments obtained by software were carried out. In experimental stage, the molten aluminum alloy was poured on an inclined plate with different lengths of 100, 300 and 500 mm set at 30°, 45° and 60° of slope angles respectively. Three different pouring temperatures of 660, 680 and 700 °C were also used. After the casting process, the partial re-melting treatment was carried out at 590 °C for different isothermal time of 5, 8 or 12 min. The combined effect of these factors on globularity of the primary α(Al) crystals was investigated and optimized using DODE. The results indicated that the primary dendritic phase in the conventionally cast A356 alloy was transformed into a non-dendritic one in ingots cast over a cooling plate. The CS processed samples exhibited a globular structure only after re-heating to semi-solid region. The optimum values of pouring temperature, cooling length, slope angle and isothermal holding time were found to be 660 °C, 360 mm, 48°, and 9 min, respectively. In this case, the globularity of primary crystals was obtained, about 0.91. The obtained model is highly significant with a correlation coefficient of 0.9860.
Trans. Nonferrous Met. Soc. China 24(2014) 961-968
Hamed KHOSRAVI1, Reza ESLAMI-FARSANI1, Mohsen ASKARI-PAYKANI2
1. Department of Materials Engineering, Faculty of Mechanical Engineering, K. N. Toosi University of Technology, Tehran, Iran;
2. School of Metallurgy and Materials Engineering, College of Engineering, University of Tehran, Tehran, Iran
Received 29 July 2013; accepted 22 September 2013
Abstract: Semi-solid processing (SSP) of A356 aluminum alloy was discussed via cooling slope (CS) method. The D-optimal design of experiment (DODE) was employed for experimental design and analysis of results. 38 random experiments obtained by software were carried out. In experimental stage, the molten aluminum alloy was poured on an inclined plate with different lengths of 100, 300 and 500 mm set at 30°, 45° and 60° of slope angles respectively. Three different pouring temperatures of 660, 680 and 700 °C were also used. After the casting process, the partial re-melting treatment was carried out at 590 °C for different isothermal time of 5, 8 or 12 min. The combined effect of these factors on globularity of the primary α(Al) crystals was investigated and optimized using DODE. The results indicated that the primary dendritic phase in the conventionally cast A356 alloy was transformed into a non-dendritic one in ingots cast over a cooling plate. The CS processed samples exhibited a globular structure only after re-heating to semi-solid region. The optimum values of pouring temperature, cooling length, slope angle and isothermal holding time were found to be 660 °C, 360 mm, 48°, and 9 min, respectively. In this case, the globularity of primary crystals was obtained, about 0.91. The obtained model is highly significant with a correlation coefficient of 0.9860.
Key words: A356 aluminum alloy; cooling slope process; modeling; D-optimal design of experiment
1 Introduction
Manufacturing processes based on thixotropy behavior are termed semi-solid processing (SSP). SSP technique was firstly invented by SPENCER et al in early 1970s [1]. In this process, cast parts are produced from a slurry kept at a temperature between the solidus and the liquidus isotherms. In SSP, fine and spherical particles with a suitable volume fraction are dispersed uniformly in a liquid matrix. Such a microstructure is thixoformable [2,3]. This technique offers distinct advantages over other manufacturing processes such as longer die life, faster production cycle, reduced porosity, lower forming temperature, better dimensional tolerance and lower energy consumption [4-6].
In recent years, many methods have been introduced for the production of semi-solid slurries. They include mechanical vibration [7-10], mechanical stirring [11,12], new rheocasting process (NRP) [13], twin screw reo-molding process [14,15], narrow melt stream (NMS) [16-18], strain induced melt activation (SIMA) [19,20], etc.
One of the most popular SSP techniques is casting using a cooling slope (CS). This method is based on pouring the melt with an appropriate superheat over an inclined cooling plate. Solid nuclei are formed by the contact between the melt and slope plate, which causes rapid heat transferring. These nuclei are detached from the surface as a result of applying shear stress and melt flow. Finally, they are distributed into the melt. The ingots obtained exhibit a non-dendritic, globular microstructure when re-heated to the semi-solid temperature range. When the semi-solid slurry at the CS is solidified in the mold without being maintained in the semi-solid region, the primary crystals do not become globular [21-24].
The key processing parameters affecting the final microstructure of the solidified slurry during CS process are pouring temperature, cooling length, slope angle, partial re-melting temperature and isothermal holding time. From the industrial point of view, it is essential to find out the best combination of CS parameters to attain the maximum globularity.
In general, an experiment is an observation which leads to characteristic information about a studied object [25]. One of the most common and classical approaches employed is one-factor-at-a-time (OFAT), in which one factor is varied while all other variables or factors in the experiment are fixed. The success of this approach depends on guesswork, luck, experience and intuition. Moreover, this type of experimentation requires large resources to obtain a limited amount of information about the process [26-32]. In many situations, in view of the high cost, the number of observations is kept a minimum [33]. With design of experiment (DOE), this number is kept as low as possible and the most informative combination of the factors is chosen [25]. Hence, DOE is an effective and economical solution. The aim of this so-called design is to optimize a process or system by performing each experiment and to draw conclusions about the significant behavior of the studied object from the results of the experiments [25]. In recent years, the use of D-optimal design of experiment (DODE) in industrial experimentation has grown rapidly, due, in part, to the fact that the methodology is now being introduced in standard DOE text books [28-30] and also because facilities for constructing DODE have become generally available [33].
On the other hand, unlike standard classical designs such as factorials and fractional factorials, DODE is usually not orthogonal [26,27,33]. This type of design is always an option regardless of the type of model that the experimenter wishes to fit (for example, first order, first order plus some interactions, full quadratic, cubic, etc.) or the objective specified for the experiment (for example, screening, response surface, etc.) [27]. DODE is straight optimization based on a chosen optimality criterion and the model that will be fitted. The optimality criterion used in generating DODE results in minimizing the generalized variance of the parameter estimates for a pre-specified model. As a result, the optimality of a given DODE is model-dependent [26,27,33]. That is, the experimenter must specify a model for the design before a computer can generate the specific treatment combinations. Given the total number of treatment runs for an experiment and a specified model, the computer algorithm chooses the optimal set of design runs from a candidate set of possible design treatment runs. This candidate set of treatment runs usually consists of all possible combinations of various factor levels that one wishes to use in the experiment.
Achieving a clear understanding of CS process through modeling is a major step towards optimal usage of its advantages. So, DODE was employed in this study to predict the globularity of primary α(Al) crystals of semi-solid cast ingot via a CS process of A356 aluminum alloy.
2 Experimental
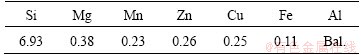
In the present study, A356 aluminum alloy produced by Arak Amijeh Saz Co., Iran, was used. The chemical composition of this alloy is given in Table 1. A356 alloy belongs to a group of hypoeutectic Al-Si alloys and has wide applications in automotive, marine and other sectors due to its excellent combination of properties such as good fluidity, low coefficient of thermal expansion, high specific strength and good corrosion resistance. The liquidus and solidus temperatures of this alloy are 610 °C and 575 °C, respectively.
Table 1 Chemical composition of A356 alloy (mass fraction, %)
1 kg of A356 aluminum alloy was put in a graphite crucible and melted by an electric resistance furnace. The alloy temperature was measured using a K-type thermocouple. The resultant melt was poured onto the surface of a copper CS after flowing through the slope, it is transferred into a steel mold (40 mm in internal diameter and 30 mm in height). The process was carried out at different pouring temperatures of 660, 680 and 700 °C. The cooling plate was adjusted at 30°, 45° and 60° with respect to the horizontal plane and was cooled by water circulation underneath. Three different cooling lengths of 100, 300 and 500 mm were used. The CS surface was coated by boron nitride. The boron nitride coating of the CS prevents sticking of the molten alloy during its flowing through the slope and in addition to that it facilitates a trouble-free flow. Figure 1(a) shows a schematic illustration of the CS process.
The solidified samples were cut according to Fig. 1(b). These samples were subjected to partial re-melting heat treatment at 590 °C for different isothermal holding time of 5, 8 and 12 min, followed by water quenching (Fig. 1(c)).
The re-heated samples were subjected to standard metallographic procedures and etched by 0.5% HF solution. The etched samples were investigated using an Olympus-BX60M light microscope. For image processing of the resulted microstructures, for each sample, a total number of 100 randomly (N=100) selected globules were analyzed using MIP software.

Fig. 1 Schematic representation of CS process (a), situation of metallographic sample (b) and partial re-melting heat treatment, followed by water quenching (c)
The degree of globularity of primary α(Al) crystals in terms of shape factor (SF) was measured using the following equation [34]:
 (1)
(1)
where A and P denote the area and perimeter of globules, respectively; SF varies in the range of 0-1.
To explore the effect of the operation factors on the response (SF), a DODE at three levels was performed. Pouring temperature (A), cooling length (B), slope angle (C) and isothermal holding time (D) were selected as independent factors. The range of values and coded levels of the factors are given in Table 2.
Table 2 Independent factors and their levels for DODE of CS process

A polynomial equation (Eq. (2)) was used to predict the response (Y) as a function of independent factors and their interactions. An interaction is the failure of the one factor to produce the same effect on the response at different levels of another factor [29]. In this work, the number of independent factors is 4, therefore, the response for the quadratic polynomials becomes
 (2)
(2)
where  are constant, linear, square and interaction regression coefficient terms, respectively; xi and xj are independent factors (A, B, C or D).
Design-Expert 7 (State-Ease, Inc., Trial version) software was used for multiple regression analysis, analysis of variance (ANOVA), and analysis of maximum of data in the response surface regression (RSREG) procedure. The goodness of fit of the model was evaluated by the coefficient of determination (R2) and its statistical significance was checked by the F-test.
3 Results and discussion
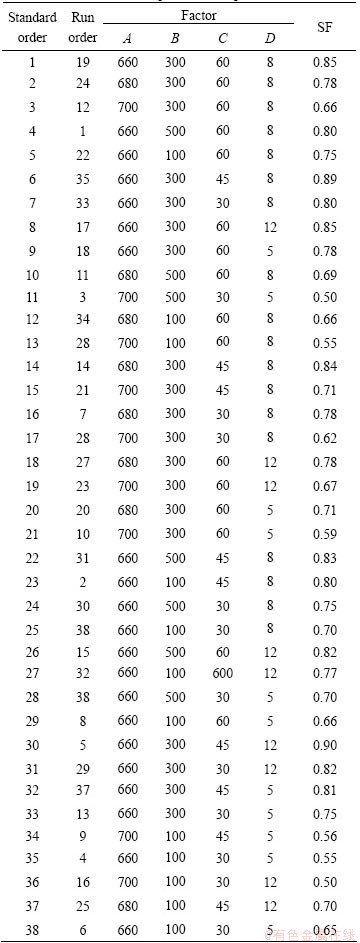
This study demonstrates the effect of pouring temperature, cooling length, slope angle and isothermal holding time on the optimization of CS process. Hence, the knowledge about the process is relatively limited, and the design is used to obtain 38 design points within the whole range of four factors. The values of SF are given in Table 3. Following the experiments, the response surface is approximated by DODE.
Table 3 DODE tests and response for CS process
The results of the DODE are presented in Table 4 with a confidence interval (CI) of 95% (P<0.05) for model. In statistics, CI is a kind of interval estimation of normal plot and normal plot (not shown here), four main population parameters and is used to indicate the reliability of an estimation. The level of confidence of CI would indicate the probability that the confidence range captures this true population parameter, giving a distribution of samples [26-32]. By considering half normal plot and normal plot (not shown here), four main effects and their squares all with CI=95% were selected as significant factors for modeling. The effect of a factor is defined as the change in response produced by change in level of factor. This is frequently called a main effect because it refers to primary factors of interest in the experiment [32]. ANOVA results for SF show a significant model with adequate precision of 58.831. Adequate precision compared the range of the predicted values at the design points with the average prediction error; on the other hand, adequate precision measured the signal to noise ratio and a ratio greater than 4 was desirable [27]. Here, the ratio is greater than 4, and then it represents the adequate model (Eq. (3)) for predicting the results within design space without doing any further experiments.
Table 4 ANOVA with CI of 95% for model and factors
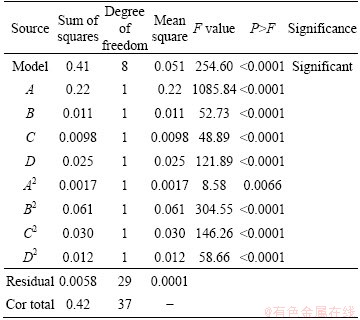
The quality of fitting of the equations was expressed by the coefficient of regression adjusted R-squared or in better way by predicted R-squared. The adjusted R-squared values indicate variability in the observed response values which can be explained by the experimental factors and their interactions. The predicted and adjusted R-squared values are closer to 1, showing that the better fitting is achieved [35]. The predicted R-squared value is 0.9738 that is in reasonable agreement with 0.9821 which is the adjusted R-squared value. The model F-value of 254.60 implies that the model is significant (Fmodel= 254.60 >> Ftable (8,29) = 3.198) and there is only 0.01% chance that a model F-value could occur due to noise. F-value is the test for comparing the variance associated with that term with the residual variance. It is the mean square for a term divided by the mean square for the residual. This term should be as large as possible [27]. Tables of F-value (a, b) for different confidence intervals exist in statistical references [26], where the first number in parenthesis is the parameter or model degree of freedom and the second one is error of (residuals) degree of freedom. To categorize the parameter or the model as a significant value, calculated F-value must be more than its value in the statistical tables. If the calculated value of F is greater than that in the F table at a specified probability level, a statistically significant factor or interaction is obtained [29]. The lack of fitted F-value for the response showed that it is not significant (P>0.05) relative to the pure error. This model (Eq. (3)) can be used to navigate the design space.
The quadratic regression coefficients obtained by employing a least squares method technique to predict quadratic polynomial models for Y are given as Eq. (3). For Y, the linear term and the quadratic terms (without interaction terms) of A, B, C and D were significant (P<0.05).

 (3)
(3)
Sum of square (SS) of each factor quantifies its importance in the process and as the value of the SS increases, the significance of the corresponding factor in the undergoing process also increases. As shown in ANOVA (Table 4), the effect of A is the strongest and then B2, C2, D, D2, B, C and A2, respectively. If we consider the model equation in actual terms, one can find that effect of A, B, C and D is positive (synergistic effect). A2, B2, C2 and D2 have negative (antagonism) effects on SF. For increasing SF, the positive effect should be ascended and the negative effect should be descended.
Significant factors in the fitted model (Eq. (3)) were chosen as the axes for the 3D plots (Fig. 2). In a contour plot (base plots in the 3D plots), curves of equal response values are drawn on a plane whose coordinates represent the levels of the independent factors. Each contour represents a specific value for the height of the surface above the plane defined for a combination of the levels of the factors. Therefore, different surface heights enable one to focus attention on the levels of the factors at which changes in the surface height occur [36].
Figure 2 shows that SF increases by decreasing amount of pouring temperature and relationships between the other factors and SF are almost parabolic. This trend is in good agreement with that of factor effects. High SF could be obtained by low pouring temperature at near level 0 of other factors (see Table 2). The observed values are reasonably close to the predicted ones as shown in Fig. 3.
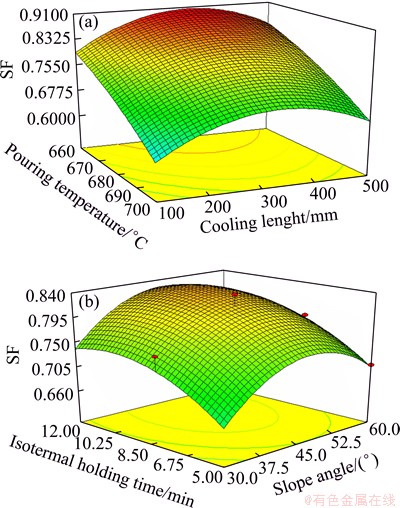
Fig. 2 3D plots of SF as function of pouring temperature and cooling length (a) and slope angel and isothermal holding time (b)

Fig. 3 Plot of predicted vs actual SF
The normality of the data can be checked by plotting a normal probability plot of the residuals. If the data points on the plot fall fairly close to the straight line, then the data are normally distributed [32,35,37]. The normal probability plot of the residuals for SF (not shown here) depicted that the data points were fairly close to the straight line. This indicates that the experiments come from a normally distributed population.
The confirmation experiments were conducted at two different conditions as follows: 1) A=690 °C, B=300 mm, C=60° and D=7 min; 2) A=670 °C, B=250 mm, C=30° and D=8 min. Figure 4 shows the microstructures of the A356 sample processed in the above mentioned conditions. If the results of the confirmation tests are within the limit of the CI, the significant factors as well as the appropriate levels for obtaining the desired results are properly chosen [26-32]. The confirmation experiments results gave 0.70 for Y1 and 0.77 for Y2. The predicted range of SF for the two conditions are Y1(pred)=0.70±0.15 and Y2(pred)=0.77±0.12, then the experimental responses Y1(exp)=0.72 and Y2(exp)=0.75 are in 95% CI and this model can be used to navigate within the design space.

Fig. 4 Microstructures of A356 sample processed under different conditions
Optimum conditions of the experiment to obtain the highest SF were predicted at A=660 °C, B=360 mm, C=48° and D=9 min. At this condition, the SF was 0.91. Figure 5 shows the microstructure of the A356 sample processed in the optimum condition before and after the partial re-melting heat treatment.
As shown in Fig. 5, the microstructure of A356 sample is non-dendritic in as-cast condition. This sample exhibits a globular microstructure when re-heated to the semi-solid temperature. In CS process, solid nuclei are formed by the contact between the melt and slope plate, which causes rapid chilling. These nuclei are detached from the surface as a result of applying shear stress and melt flow. Finally, they are distributed into the melt. In optimum condition predicted by the model, the maximum shear is applied to the molten metal during melt flow. In other words, in this condition the maximum crystal separation from the slope surface due to the dendritic arm fragmentation occurs. In addition, agglomeration and welding of primary α(Al) crystals decreased by increasing the applied shear.
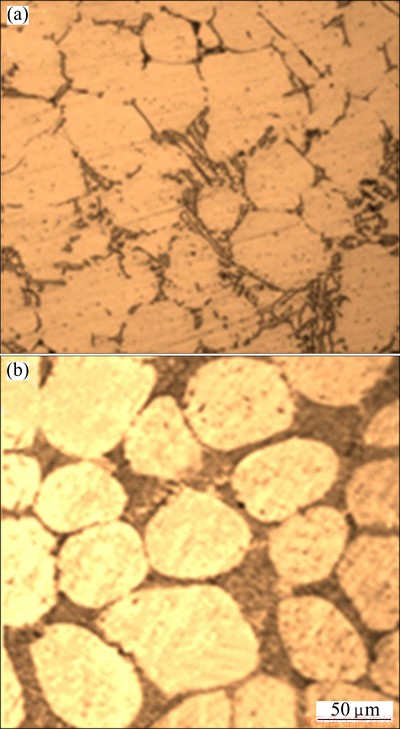
Fig. 5 Microstructures of A356 sample processed in optimum condition before (a) and after (b) partial re-melting heat treatment
As stated before, among the different factors studied in this work, the most important one which strongly affects the SF of α(Al) crystals is pouring temperature. By increasing the pouring temperature, the input heat to the surface increases, leading to a decrease in the thickness of primary solidified layer on the cooling slope. As a result, the number of solid nuclei within the solid-liquid mixture decreases. On the other hand, increasing the pouring temperature can help the melting of primary solid nuclei within the mold before the final solidification. Thus, the SF after the partial re-melting heat treatment decreases as the pouring temperature increases. Regarding the results of modeling, it can be concluded that increasing the pouring temperature causes more suppression of the effect of other factors.
4 Conclusions
1) The CS-processed samples exhibit a globular structure only after re-heating to semi-solid region.
2) The correlation coefficient of the regression model is 0.9860 which confirms the excellent accuracy of the model.
3) The optimal pouring temperature, cooling length, slope angle and isothermal holding time are found to be 660 °C, 360 mm, 48°, and 9 min, respectively.
4) The most important factor affecting the globularity of primary α(Al) crystals is found to be the casting temperature.
References
[1] SPENCER D, MEHRABIAN R, FLEMINGS M C. Rheological behavior of Sn-15%Pb in the crystallization range [J]. Metallurgical Transactions A, 1972, 3: 1925-1932.
[2] FAN Z. Semisolid metal processing [J]. International Materials Reviews, 2002, 47: 49-85.
[3] KIRKWOOD D H. Semisolid metal processing [J]. International Materials Reviews, 1994, 39: 173-189.
[4] ATKINSON H V. Modeling the semisolid processing of metallic alloys [J]. Progress in Materials Science, 2005, 50: 341-412.
[5] ZHAO Z, CHEN Q, CHAO H, HUANG S. Microstructural evolution and tensile mechanical properties of thixoforged ZK60-Y magnesium alloys produced by two different routes [J]. Materials and Design, 2010, 31: 1906-1916.
[6] KAPRANOS P, WARD P J, ATKINSON H V, KIRKWOOD D H. Near net shaping by semi-solid metal processing [J]. Materials and Design, 2000, 21: 387-394.
[7] ZHAO Jun-wen, WU Shu-sen, XIE Li-zhi, AN Ping, MAO You-wu. Effects of vibration and grain refiner on microstructure of semisolid slurry of hypoeutectic Al-Si alloy [J]. Transactions of Nonferrous Metals Society of China, 2008, 18(4): 842-846.
[8] TAGHAVI F, SAGHAFIAN H, KHARRAZI Y H K. Study on the effect of prolonged mechanical vibration on the grain refinement and density of A356 aluminum alloy [J]. Materials and Design, 2009, 30: 1604-1611.
[9] WU S, XIE L, ZHAO J, NAKAE H. Formation of non dendritic microstructure of semi-solid aluminum alloy under vibration [J]. Scripta Materialia, 2008, 58: 556-559.
[10] LIMMANEEVICHITR C, PONGANANPANYA SKAJORNCHAIYAKUL J. Metallurgical structure of A356 aluminum alloy solidified under mechanical vibration: An investigation of alternative semi-solid casting routes [J]. Materials and Design, 2009, 30: 3925-3930.
[11] SUKUMARAN K, PAI B C, CHAKRABORTY M. The effect of isothermal mechanical stirring on an Al-Si alloy in the semisolid condition [J]. Materials Science and Engineering A, 2004, 369: 275-283.
[12] KAYKHA M M, KAMAREI A, SAFARI M, ARBABI V. Semisolid structure and parameters for A360 aluminum alloy prepared by mechanical stirring [J]. World Academy of Science Engineering and Technology, 2011, 73: 872-874.
[13] CARDOSO E, ATKINSON H V, JONES H. Microstructural evolution of A356 during NRC processing [C]//8th International Conference on Semi-Solid Processing of Alloys and Composites. Limassol: University of Cyprus, 2004.
[14] JI S, FAN Z, BEVIS M J. Semi-solid processing of engineering alloys by a twin screw rheomolding process [J]. Materials Science and Engineering A, 2001, 299: 210-217.
[15] FAN Z, JI S, BEVIS M J. Twin-screw rheomolding―A new semisolid processing technology [C]//Process of the 6th International Conference on Semi-Solid Processing of Alloys and Composites. Turin, Italy, 2000: 61-67.
[16] AKHLAGHI F, FARHOOD A H S. Characterization of globular microstructure in NMS processed aluminum A356 alloy: The role of casting size [J]. Advanced Materials Research, 2011, 264-265: 1868-1877.
[17] ARZANDI F, AKHLAGHI F. Effect of castings modulus on the microstructure of Al/SiCp metal matrix composites; fabricated via Narrow Melt Stream (NMS) method [C]//3rd International Conference on Manufacturing Engineering (ICME2011). Tehran, 2011: 27-29.
[18] FARHOOD A H S, AKHLAGHI F. Formation of globular structures in Al 356 alloy by narrow melt stream (NMS) technique [J]. Iranian Journal of Materials Science and Engineering, 2010, 1: 1-9.
[19] CHOI J C, PARK H J. Microstructural characteristics of aluminum 2024 by cold working in the SIMA process [J]. Journal of Materials Processing Technology, 1998, 82: 107-116.
[20] SIRONG Y, DONGCHENG L, KIM N. Microstructure evolution of SIMA processed Al2024 [J]. Materials Science and Engineering A, 2006, 420: 165-170.
[21] BIROL Y. Cooling slope casting and thixoforming of hypereutectic A390 alloy [J]. Journal of Materials Processing Technology, 2008, 207: 200-203.
[22] HAGA T, SUZUKI S. Casting of aluminum alloy ingots for thixoforming using a cooling slope [J]. Journal of Materials Processing Technology, 2001, 118: 169-172.
[23] HAGA T, NAKAMURA R, TAGO R, WATARA H. Effects of casting factors of cooling slope on semisolid condition [J]. Transactions of Nonferrous Metals Society of China, 2010, 20: 968-972.
[24] AKHLAGHI F, TAGHANI A. Development of vibrating cooling slope (VCS) method for enhancing a globular structure in aluminum A356 alloy [C]//12th International Conference on Aluminum Alloys. Yokohama, Japan: The Japan Institute of Light Metals, 2010: 1839-1844.
[25] TRIEFENBAC F. Design of experiments: The D-optimal approach and its implementation as a computer algorithm [D]. Germany: South Westphalia University.
[26] ANDERSON M J, WHITCOMB P J. DOE simplified: Practical tools for effective experimentation [M]. Portland: Productivity Inc, 2000.
[27] Software helps Design-Expert Software, Version 7.1, User's guide, Technical Manual, Stat-Ease Inc, Minneapolis, MN, 2007.
[28] ANTONY J. Design of experiment for engineers and scientists [M]. Elsevier Science & Technology Books, 2003.
[29] MONTGOMERY D C. Design and analysis of experiments [M]. 5th ed. New York: John Wiley & Sons INC, 2000.
[30] DEAN A, VOSS D. Design and analysis of experiments [M]. New York: Spring-Verlag, Inc, 1999.
[31] CARROLL C, TOBIAS P. NIST/SEMATECH, e-Handbook of Statistical Methods [EB/OL]. http://www.itl.nist.gov/div898/ handbook/, 2002.
[32] GOTTIPATI R, MISHRA S. Process optimization of adsorption of Cr (VI) on activated carbons prepared from plant precursors by a two-level full factorial design [J]. Korean Journal of Chemical Engineering, 2010, 160: 99-107.
[33] CHIU W Y, JOHN P W M. D-optimal fractional factorial designs [J]. Statistics & Probability Letters, 1998, 37: 367-373.
[34] SEO P K, KANG C G. The effect of raw material fabrication process on microstructural characteristics in reheating process for semi-solid forming [J]. Journal of Materials Processing Technology, 2005, 162-163: 402-409.
[35] COSTA S, BARROSO M, CASTANERA A, DIAS M. Design of experiments, a powerful tool for method development in forensic toxicology: Application to the optimization of urinary morphine 3-glucuronide acid hydrolysis [J]. Anal Bioanal Chem, 2010, 396: 2533-2542.
[36] WANASUNDARA N U, SHAHIDI F. Concentration of omega 3 polyunsaturated fatty acids of seal blubber oil by urea complexation: Optimization of reaction conditions [J]. Food Chemistry, 1999, 65: 41-49.
[37] SONG Y, KIM D, PARK Y. Statistical optimization of rhodamine B removal by factorial design using reaction rate constant in electrochemical reaction [J]. Korean Journal of Chemical Engineering, 2011, 28: 156-163.
Hamed KHOSRAVI1, Reza ESLAMI-FARSANI1, Mohsen ASKARI-PAYKANI2
1. Department of Materials Engineering, Faculty of Mechanical Engineering, K. N. Toosi University of Technology, Tehran, Iran;
2. School of Metallurgy and Materials Engineering, College of Engineering, University of Tehran, Tehran, Iran
摘 要:使用冷却斜槽工艺加工半固态A356铝合金。运用D-实验优化设计(DODE)设计实验并分析实验结果。采用软件抽取38个随机实验。冷却斜板长度为100、300、500 mm,斜板的斜角为30°、45°、60°,浇铸温度为660、680和700 °C。将半固态铝合金浇铸到铜质冷却斜板上,然后倾入到钢模中成型。铸造完成之后,在温度590 °C下,对部分样品进行5、8、12 min重熔处理。研究这些因素对初生α(Al)晶体圆整度的影响,并使用DODE进行参数优化处理。结果表明,传统铸造A356合金的初生α(Al)相为枝晶,而冷却斜槽铸造的为非枝晶。重熔后再经过冷却斜槽处理的样品呈现出球状结构。最优的浇铸温度、冷却板长度、斜角和保温时间分别为660 °C、360 mm、48°和9 min。在最优条件下,得到初生晶体的圆整度为0.91。所建立的模型的相关系数为0.9860。
关键词:A356铝合金;冷却斜槽加工;建模;D-实验优化设计
(Edited by Xiang-qun LI)
Corresponding author: Reza Eslami-Farsani; Tel: +98-2184063218; E-mail: eslami@kntu.ac.ir
DOI: 10.1016/S1003-6326(14)63149-6

