J. Cent. South Univ. (2016) 23: 1906-1914
DOI: 10.1007/s11771-016-3246-2

Estimation of half-wave potential of anabolic androgenic steroids by means of QSER Approach
DAI Yi-min(������)1, 2, LIU Hui(����)2, NIU Lan-li(ţ����)2, CHEN Cong(�´�)2,
CHEN Xiao-qing(������)1, LIU You-nian(������)1
1. College of Chemistry and Chemical Engineering, Central South University, Changsha 410083, China;
2. Hunan Provincial Key Laboratory of Materials Protection for Electric Power and Transportation
(Changsha University of Science and Technology), Changsha 410114, China
 Central South University Press and Springer-Verlag Berlin Heidelberg 2016
Abstract: The quantitative structure-property relationship (QSPR) of anabolic androgenic steroids was studied on the half-wave reduction potential (E1/2) using quantum and physico-chemical molecular descriptors. The descriptors were calculated by semi-empirical calculations. Models were established using partial least square (PLS) regression and back-propagation artificial neural network (BP-ANN). The QSPR results indicate that the descriptors of these derivatives have significant relationship with half-wave reduction potential. The stability and prediction ability of these models were validated using leave-one-out cross-validation and external test set.
Key words: anabolic androgenic steroids; half-wave reduction potential; model validation; quantitative structure-electrochemistry relationship
1 Introduction
Anabolic androgenic steroids (AASs) are in the list of banned substances of the International Olympic Committee (IOC) which is a list of substances abusively used to enhance athletic performance since 1976 [1]. The anti-doping organizations have made significant progresses in the last few years to fight off the stigma of synthetic and natural AASs misusage. These compounds have been proven to be effective oral therapy to promote weight gain after extensive surgery, chronic infection, and severe trauma [2-5].
Generally, anabolic androgenic steroids are derivatives or structural modifications of testosterone, which dramatically influences their physical, chemical, and biological properties [6]. Half-wave reduction potential (E1/2) is an important electrochemical property of organic compounds. This property is a characteristic constant for a reversible oxidation-reduction system, which can be useful for predicting electrochemical properties of other organic compounds. Various methods can be used to determine the half-wave potential of a wide variety of inorganic, organic compounds [7-8]. A successful strategy for prediction of the half-wave reduction potentials is construction of quantitative structure-electrochemistry relationship (QSER) model, by which, structural features affecting E1/2 are also understood.
Several other works attempting to take the half-wave reduction potentials, or the activities of the anabolic androgenic steroids into account in QSER have also been published [9-12]. HEMMATEENEJAD and YAZDANI [9] established a QSER model to predict the E1/2 of steroids by multiple linear regression (MLR) and principle component regression (PCR) analysis. HEMMATEENEJAD and SHAMSIPUR [10] employed PCR and principle component-artificial neural network (PC-ANN) models in a QSER study of some organic compounds. NESMERAK et al [11] employed QSER approach to investigate the electrooxidation of new benzoxazines as a model of metabolic degradation. In QSER, it is assumed that properties of new or untested chemicals can be inferred from the molecular structure. The approach does not depend on any experimental properties, but needs the molecular descriptors, which can be calculated from the molecular structure alone. Once the structure of a compound is known, any molecular descriptor can be calculated no matter whether the compound is synthesized or not. When a reliable model is established, it can predict the property or activity of compounds and see which structural factors play an important role to compound property or activity [13-16]. This also supports our thought that molecular structural information is very important to half-wave reduction potentials and encourages us to do the present work using quantum and physicochemical molecular descriptors.
Considering the technological importance of the half-wave reduction potential, more rapid methods for its estimation are searched. The main objective of this investigation is to propose and validate a novel, more rapid approach for the development of robust QSER models for half-wave reduction potential of anabolic androgenic steroids based on the large space of theoretically calculated quantum and physicochemical molecular structural descriptors. Finally, an interpretation in structural terms of half-wave reduction potential is proposed.
2 Material and methods
2.1 Data set and software
All electrochemical data of the present investigation were obtained from the Handbook of Progress in Electrochemistry [17-18]. The chemical structures of studied compounds included ��-bromo, ��-bromo, ��-fluoro and ��-chloro ketosteroids. The molecular structures of the investigated compounds are shown in Fig. 1.
Molecular descriptors were mainly calculated by HyperChem 8.0 and Dragon software [19-20]. Statistical evaluation of the data and partial least square data analysis has been performed mainly by SPSS program packages. Additional calculation programs and Back- propagation artificial neural network analysis were developed in Matlab 7.0. All calculation programs implementing BP-ANN were written in M-file based on a basis MATLAB script for BP-ANN. The scripts were run on a personal computer.
2.2 Molecular descriptors generation
All molecules were drawn and optimized using the AM1 method in the HyperChem 8.0 software [19]. Dragon is a very sophisticated program for the calculation of molecular descriptors. The software can be used to calculate constitutional, topological, geometrical and electrostatic descriptors for every molecule, and the procedure of calculation of the descriptors which refer to Dragon software user��s guide [20]. To ensure obtaining structure with optimum geometry, optimization was repeated many times with different starting geometries. The optimization was preceded by the Polak-Rebiere algorithm to reach 0.01 root mean square gradient. After geometrical optimization of each molecule, the electronic descriptors such as local charges, hardness, softness, dipole moments were calculated with MOPAC vs dragon software using AM1 semi-empirical Hamiltonian [21]. ��Pair correlation checkbox�� was selected in order to exclude from output file the descriptors containing redundant information. In addition, constant descriptors were also eliminated. The AM1 algorithm was selected because it gives good estimates of molecular energies and the computation time is much shorter than needed by ab initio methods. The keyword electrostatic potential calculation was used to obtain electrostatic potential derived from net atomic charges. In the treatment, all descriptors used were derived solely from molecular structure and do not require experimental data. The lowest unoccupied molecular orbital energy (LUMO), highest occupied molecular orbital energy (HOMO) as a measure of molecular capacity to donate or to accept an electron pair, are important molecular descriptors, and can effectively inflect molecular structural information [22]. In order to provide energy information, LUMO and HOMO calculated by the semi-empirical molecular orbital program MOPAC are added as quantum descriptors. Mathematically, energies are obtained based on the molecular orbital. It makes more sense for quantum guys that HOMO and LUMO are more located in two distinct parts of the molecule, which mainly contributes to the final energy of the molecules in Fig. 2. Overall, more than 500 molecular structural descriptors were calculated.
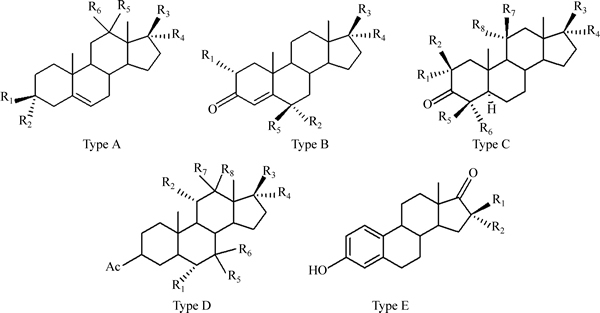
Fig. 1 Basis molecular structures of investigated anabolic androgenic steroids
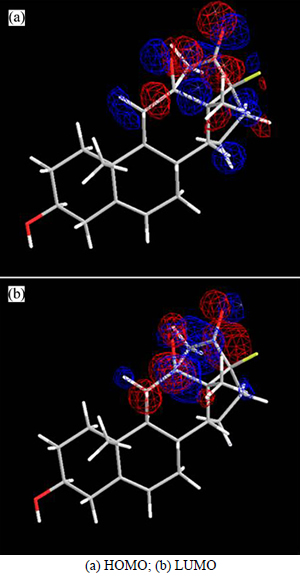
Fig. 2 Distribution of electronic density:
In truth, if a large number molecular descriptors are calculated, it is inevitable that many descriptors are collinear and that there will be much redundancy of information. A better predictive model can be obtained by ortogonalization of the variables in this work, a factorial analysis is performed by applying principal components analytical. The theoretical aspects of this statistical technique have been extensively exposed in the literature including many chemical applications [23-25]. The main uses of factorial analytical techniques are to reduce the number of variables and to detect structure in the relationships between variables [2]. Usually the factor with highest correlation coefficient is considered as the most significant one, and subsequently, the factors are introduced into the calibration model until no further improvement of the calibration model is obtained.Figure 3 shows the projections of the 38 compounds (each represented by a point) in the space defined by the first two principal components (CP1 and CP2). And the first two principal components explain 65.22% and 39.15% of the structural variance, respectively. After the heuristic reduction, the pool of descriptors was reduced from 562 to 5. The five descriptors were selected to see if they could provide a holistic description of the molecules.
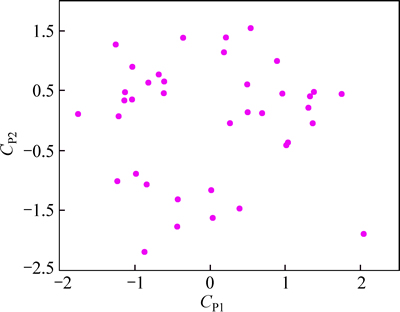
Fig. 3 Principal component analysis of structural descriptors for data set
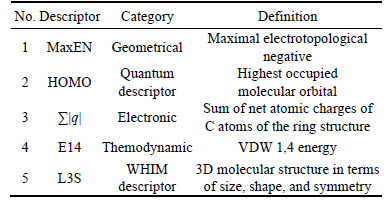
MaxEN is geometrical descriptor derived from maximal electrotopological negative [9]. The MaxEN combines the geometrical information in the influence matrix and topological information in the molecular graph weighted by various atomic properties. According to molecular frontier orbital theory and the common practice in which two descriptors calculated from quantum, chemistry computation should be included for QSER study, they were HOMO and LUMO by applying principal components analytical, only HOMO was selected as parameter in regression model for LUMO does not give out enough structural information. ��|q| is the sum of net atomic charges of C atoms of the ring structure in the anabolic androgenic steroids backbone. E14 is a thermodynamic descriptor which combines molecular VDW 1,4 energy. For all that E14 correlation coefficient is weak, E14 was selected as descriptor in model because it can preferably improve regression effects. The chemical description of anabolic androgenic steroids is made in terms of WHIM descriptors, which are 3D molecular descriptors taking into account size, shape, symmetry and atom distribution of the molecules [26]. A complete list of anabolic androgenic steroids and the calculated values of the molecular descriptors appearing in the QSER models are summarized in Table 1 and supplementary material table.
Table 1 Selected descriptors in regression model
3 Results and discussion
3.1 PLS analysis
Partial least square analysis (PLS) was developed by WOLD et al [27] as an econometric technique, but some of its most avid proponents are chemical engineers and chemometricians. PLS is an effective technique for finding the relationship between the properties of a molecule and its structure. In mathematical terms, PLS relates a matrix Y of dependent variables to a matrix X of molecular structure descriptors [28]. PLS has two objectives: to approximate the X and Y data matrices, and to maximize the correlation between them. Whereas the extraction of PLS components is performed stepwise and the importance of a single component is assessed independently, a regression equation relating each Y variable with the X matrix is created. PLS decomposes the matrix X into several latent variables that correlate best with the activity of the molecules [29].
According to the principle of statistics, a regression equation is of no relevance when the applied explanatory variables are mutually interrelated by simple or multiple correlations. Here, the bivariate correlation of two sets of variables including the dependent variables is investigated. It should be noted that variance inflation factor [30-31] (VIF, Fvi) is a method of detecting the severity of multicollinearity. VIF can be easily calculated as
 (1)
(1)
 (2)
(2)
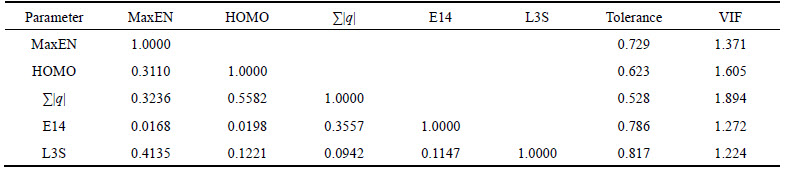
where R is the correlation coefficient of regression between one descriptor and the others and T is tolerance. In practice, if VIF equals to one, no inter-correlation exists for each descriptor; when Fvi>5 or higher, or if the tolerance remains less than 0.20, then this would indicate that there exists multicollinearity among the descriptors. Table 2 shows that there is no significant correlation between the selected descriptors, thus, there is no multicollinearity problem for the selected subset.
Partial least square analysis has been used to construct the QSER model by using the five parameters, MaxEN, HOMO, ��|q|, E14, and L3S. The relationship between the structural descriptors and half-wave reduction potential for anabolic androgenic steroids is modeled by
E1/2=(�C0.659��0.157)MaxEN+(0.687��0.169)HOMO+
(0.397��0.246)��|q|+(0.016��0.021)E14+
(0.519��0.299)L3S+(6.468��1.551) (3)
where N=38, R=0.765, Radj=0.721, S=0.448, F=9.027, p<0.0001, arithmetic mean value is 6.419, and the standard deviation is 15.473.
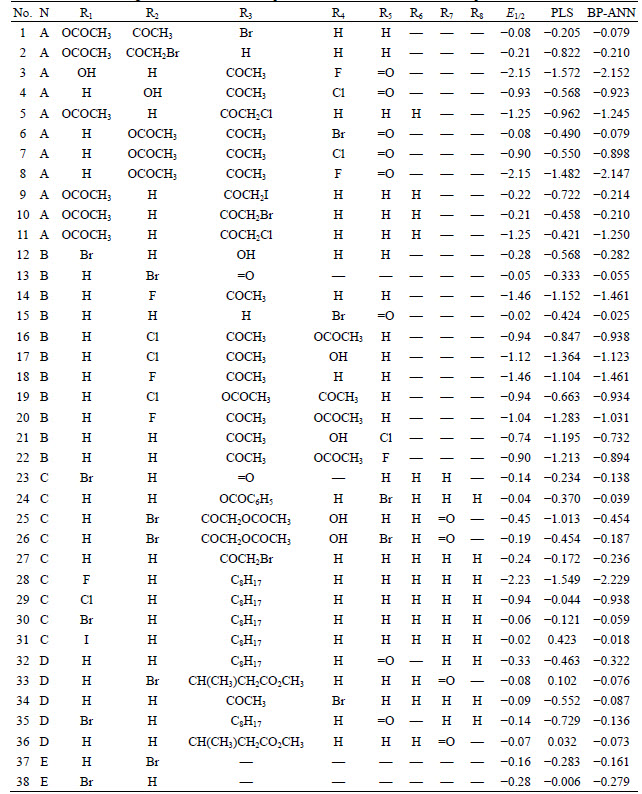
In this partial least square regression equation, N is the number of data pointes, R is correlation coefficient, Radj, S, Sprs, Sts, F and p are adjusted correlation coefficient, standard error of estimate, predicted residual sum of squares, total sum of squares, value of the Fisher statistic and the associated p value, respectively. R2 indicates that the model explains 58.51% of the variance for the experimental values of half-wave reduction potential by Eq. (3) using partial least square method. R2 is the measure of predictive potential for QSAR/QSPR model and it is considered that a model is satisfactory if R2>0.5 [32]. Accordingly, this model can be considered to possess high predictive ability. It can be seen clearly that data points in Table 3 and Fig. 4 are very scattered. The results above indicate that the partial least square approach, although conceptually sound, does not provide advantage over E1/2 since the R2 value for Eq. (3) is only 58.51%. A complexity nonlinear relationship exists between half-wave reduction potential for anabolic androgenic steroids and five structural descriptors. It is that Eq. (3) of this work is somewhat different from Eqs. (1) and (2) of HEMMATEENEJAD and YAZDANI [9]. This is due to the fact that samples in this work and Ref. [9] are different. Comparison between MLR and PLS models indicates that MLR yields models that are simpler and easier to interpret than PLS, because PLS performs regression on latent variables that do not have physical meaning [12]. On the other hand, methods such as PLS regression can handle the collinear descriptors and therefore better predictive models are obtained by PLS method. The results using PLS method are shown in Table 2. From the positive and negative symbols of the coefficients of the independent variables, one can evaluate the effects of each independent variable on the E1/2 values of the QSER. Among descriptors of Eq. (3), only MaxEN has negative effect on the E1/2, which means that the E1/2 value reduces with the increase of this descriptor. While the other four descriptors, HOMO, ��|q|, E14 and L3S have the positive effect on the E1/2 value. From the PLS weights in Eq. (3), it can be seen that how much a single variable contributes in each PLS component to the modeling of the half-wave reduction potential E1/2 [33]. The first PLS component is mainly related to the descriptor MaxEN. The absolute values of weights for these descriptors are larger than 0.6 and larger than the absolute of weights for the other descriptors. The result indicates the first principal component MaxEN condensed molecular size information of anabolic androgenic steroids molecules. Similarly, the second principal component is mainly related to the descriptors HOMO and ��|q|, and the third principal component is mainly related to the descriptors E14 and L3S. On the other hand, the descriptor influences are in agreement with the Zuman��s conclusions about the substituent effects on the E1/2 of the studies steroid [18]. As can be seen from Table 3, from F to I, reactions become easier and E1/2 goes to more positive values because the effect of electronic repulsion decreases with the size of halogen grew bigger [34-35]. Simultaneously, the selected molecular descriptors can preferably convey the influence of category, electronic and 3D structure character of molecules on the variation of E1/2.
Table 2 Correlation matrix of selected descriptors and multicollinearity diagnostic parameter
3.2 BP-ANN analysis
From Eq. (3), it can be seen that the model of PLS is not sufficiently accurate (R=0.765, S=0.448) and shows the factors influencing the half-wave reduction potential of anabolic androgenic steroids are complex and not all of them are in a linear correlation. So, the nonlinear prediction model is built by artificial neural network to further discuss the correlation between the molecular structure and the half-wave reduction potential based on the same descriptor set. Of all neural networks, back-propagation network is widely used which has several major advantages over multiple regression analysis in the recent decade [36-38]. An artificial neural network with back-propagation algorithm is constructed in this work. Our network has an input layer, a hidden layer and an output layer. The input layer does not process the information which only distributes the input vectors to the hidden layer. The input vectors are the set of principal components which are selected by correlation ranking procedure. The number of nodes in the hidden layer is optimized through learning procedure. Each neuron in one layer is inter-connected with all of its next layer��s neurons, but neurons on the same layer are not connected with each other, the structure of a typical three layer BP artificial neural network is shown in Fig. 5. The transfer function of logsig(x) and purelin(x) are applied in hidden layer and output layer neural network, respectively. It should be noted that the number of input nodes is 5, which is equal to the number of descriptors appearing in the PLS model, and the number of output nodes is 1. The training and predicting datasets including 38 and 3 compounds, respectively, are used to optimize the network performance.
Obtained results using BP-ANN method are shown in Table 3. The relationship between experimental half-wave reduction potentials and predicted half-wave reduction potential using BP-ANN method is modeled by
E1/2pre=(1.0004��0.0009)E1/2exp+(�C0.0015��0.0008)
N=38, R=0.999, S=0.0036 (4)
The results demonstrate that the model can predict the half-wave reduction potential for anabolic androgenic steroids satisfactorily. The plot of the predicted vs observed half-wave reduction potential is presented in Fig. 4, where the high degree of correlation for training set is evident.
3.3 Model validation
Validation of the models is the other major bottleneck in QSAR/QSPR. One of the most popular validation criteria is internal cross-validation. In order to assess the predictive ability and to check the statistical significance of the developed model, leave-one-out cross-validation (LOO-CV) and external validation (EV) procedures are used [5]. In such a procedure, a fraction of chemicals in the training set are excluded, and then their property is predicted by a new model developed from the remaining chemicals. The process has to be repeated until all chemicals in the training set are left out once. From this procedure, the predictive correlation is defined by coefficient (q) as
Table 3 Anabolic androgenic steroids substitution patterns and their half-wave reduction potentials
 (5)
(5)
where yi is the observed E1/2,  is the estimated E1/2 by the model and
  is the average E1/2 [39-40]. A quantitative model with a value of cross-validated q2>0.5 is normally considered to possess significant predictive ability. However, expressions that have significant internal consistency may not be applicable for the E1/2, which are never used in the generation of correlation. Nevertheless, GOLBRAIKH and TROPSHA [41] have recently demonstrated that high values of q2 appear to be a necessary but not sufficient condition for the model to have a high predictive power. Therefore, the predictive power of model is further confirmed by an external prediction set. It is predicted that the half-wave reduction potential of three novel anabolic androgenic steroids derivatives with good profile of AAR, which are not used to build the model itself. The structures of these three anabolic androgenic steroids are depicted in Fig. 6.
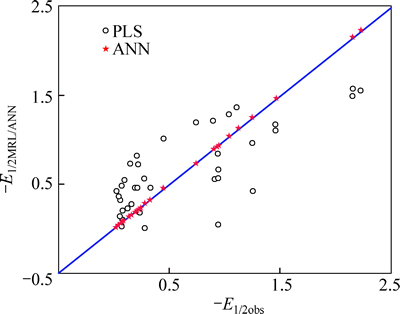
Fig. 4 Correlation of observed versus predicted E1/2 using PLS and BP-ANN
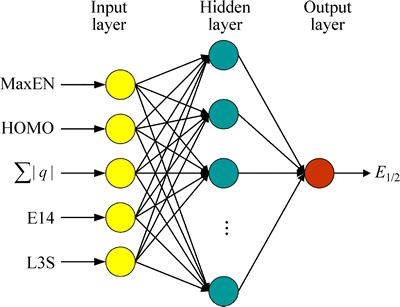
Fig. 5 Structure of a BP-ANN
The model is validated using the leave-one-out cross-validation, and the q and Scv are respectively determined to be 0.758 and 0.469, as compared to the correlation coefficient R=0.765 and standard error of estimate S=0.448, which are very close to the statistics of Eq. (3). The cross-validation indicates the good stability of the QSER model.
The statistical robustness and predictive power of the obtained model is assessed using an external test. Molecular descriptors for three new AASs are calculated according to the aforementioned method. Using Eq. (3) and BP-ANN method, the half-wave reduction potential of 3 anabolic androgenic steroids can be predicted, respectively. The results are listed in Fig. 7 and supplementary data table. Using BP-ANN produces even better good predictive ability than QSER approach such as PLS.
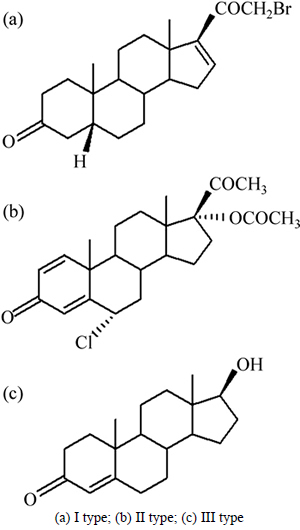
Fig. 6 Molecular structure of new anabolic androgenic steroids:
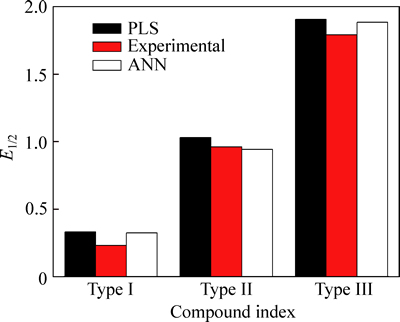
Fig. 7 Plots of observed versus predicted E1/2 of new anabolic androgenic steroids by PLS and BP-ANN
4 Conclusions
A quantitative structure-electrochemistry relationship (QSER) is derived to predict the half-wave reduction potential for a diverse set of 38 anabolic androgenic steroids. The model contains 5 descriptors which are calculated solely from the chemical structure of compounds. The model proposed could also provide some insight into what structural features are related to the half-wave reduction potential of anabolic androgenic steroids. Additionally, using BP-ANN produces even better nonlinear model with good predictive ability than QSER approach such PLS. Nonlinear relationship can describe accurately the relationship between the structural parameters and E1/2 of anabolic androgenic steroids.
References
[1] SCHWARZ J M, MCCARTHY M M. Steroid-induced sexual differentiation of the developing brain: Multiple pathways, one goal [J]. J Neurochem, 2008, 105(5): 1561-1572.
[2] ALVAREZ-GINARTE Y M, MARRERO-PONCE Y, RUIZ-  J A, GARCIA-DE LA VEGA J M, NOHEDA-MARIN P, CRESPO-OTERO R, TORRENS-ZARAGOZA F, - DOMENECH R. Applying pattern recognition methods plus quantum and physico-chemical molecular descriptors to analyze the anabolic activity of structurally diverse steroids [J]. J Comput Chem, 2008, 29: 317-333.
[3] LYNCH G S, SCHERTZER J D, RYALL J G. Therapeutic approaches for muscle wasting disorders [J]. Pharmacol Ther, 2007, 113: 461-487.
[4] MAZZARINO M, CRISTINA  M, DONATI F, de la TORRE X,
  F. Effects of propyphenazone and other non-steroidal anti-inflammatory agents on the synthetic and endogenous androgenic anabolic steroids urinary excretion and/or instrumental detection [J]. Anal Chim Acta, 2010, 657: 60-68.
[5] BOSSOLA M, PACELLI F, TORTORELLI A, DOGLIETTO G B. Cancer cachexia: It��s time for more clinical trials [J]. Ann Surg Oncol, 2006, 14: 276-285
[6] O'HAGAN D, RZEPA H S. Some influences of fluorine in bioorganic chemistry [J]. Chem Commun, 1997, 7: 645-652.
[7] SHAMSIPUR M, SIROUEINEJAD A, HEMMATEENEJAD B, ABBASPOURB A, SHARGHI H, ALIZADEH K, ARSHADI S. Cyclic voltammetric, computational, and quantitative structure- electrochemistry relationship studies of the reduction of several 9,10-anthraquinone derivatives [J]. J Electroanal Chem, 2007, 600: 345-358.
[8] KRIVENKO A G, KOTKIN A S, KURMAZ V A. Thermodynamic and kinetic characteristics of intermediates of electrode reactions: Determination by direct and combined electrochemical methods. Russ [J]. J Electrochem, 2005, 41: 122-136.
[9] HEMMATEENEJAD B, YAZDANI M. QSPR models for half-wave reduction potential of steroids: A comparative study between feature selection and feature extraction from subsets of or entire set of descriptors [J]. Anal Chim Acta, 2009, 634: 27-35.
[10] HEMMATEENEJAD B, SHAMSIPUR M. Quantitative structure- electrochemistry relationship study of some organic compounds using PC-ANN and PCR [J]. Internet Electron J Mol Des, 2004, 3: 316-334.
[11] NESMERAK K, NEMEC I, STICHA M, WAISSER K, PALAT K. Quantitative structure-property relationships of new benzoxazines and their electrooxidation as a model of metabolic degradation [J]. Electrochim Acta, 2005, 50: 1431-1437.
[12] GARKANI-NEJAD Z, RASHIDI-NODEH H. Comparison of conventional artificial neural network and wavelet neural network in modeling the half-wave potential of aldehydes and ketones [J]. Electrochim Acta, 2010, 55: 2597-2605.
[13] CHENG Z J, ZHANG Y T, FU W Z. QSAR study of carboxylic acid derivatives as HIV-1 Integrase inhibitors [J]. Eur J Med Chem, 2010, 45: 3970-3980.
[14] DAI Yi-min, LIU Hui, LI Xun, ZHU Zhi-ping, ZHANG Yue-fei, CAO Zhong, ZHU Li-xuan, ZHOU Yue. An novel group contribution-based method for estimation of flash points of ester compounds [J]. Chemom Intell Lab Syst, 2014, 136: 138-146.
[15] DAI Yi-min, ZHU Zhi-ping, CAO Zhong, ZHANG Yue-fei, ZENG Ju-lan, LI Xun. Prediction of boiling points of organic compounds by QSPR tools [J]. J Mol Graph Model, 2013, 44: 113-119.
[16] DAI Yi-min, HUANG Ke-long, LI Xun, CAO Zhong, ZHU Zhi-ping, YANG Dao-wu. Simulation of 13C NMR chemical shifts of carbinol carbon atoms using quantitative structure-spectrum relationships [J]. Journal of Central South University of Technology, 2011, 18: 323-330.
[17] DEAN J A. Lang��s Handbook of chemistry [M]. New York: McGraw-Hill, Inc, 2005: 137-164.
[18] ZUMAN Z. Substituent effects in organic polarography [M]. New York: Plenum Press, 1967: 128-130.
[19] MAURI A, CONSONNI V, PAVAN M, TODESCHINI R. Dragon software: An easy approach to molecular descriptor calculations [J]. Match, 2006, 56(2): 237-248.
[20] KATRITZKY A R, STOYANOVA-SLAVOVA I B, TAMM K, TAMN T, KARELSON M. Application of the QSPR Approach to the boiling points of Azeotropes [J]. The Journal of Physical Chemistry A, 2011, 115(15): 3475-3479.
[21] STEWART J J P. Optimization of parameters for semiempirical methods��II. Applications [J]. J Comput Chem, 1989, 10: 221-264.
[22] LUKOVITS I, SHABAN A,  E. Thiosemicarbazides and thiosemicarbazones: Non-linear quantitative structure-efficiency model of corrosion inhibition [J]. Electrochim Acta, 2005, 50: 4128-4133.
[23] MARRERO P Y. Linear indices of the ��molecular pseudograph��s atom adjacency matrix��: Definition, significance- interpretation and application to QSAR analysis of flavone derivatives as HIV-1 integrase inhibitors [J]. J Chem Inf Comput Sci, 2004, 44: 2010-2026.
[24] GARKANI-NEJAD Z, POSHTEH-SHIRANI M. Application of multivariate image analysis in QSPR study of 13C chemical shifts of naphthalene derivatives: A comparative study [J]. Talanta, 2010, 83: 225-232.
[25] ZHOU C Y, NIE C M, LI S, LI Z H. A novel semi-empirical topological descriptor Nt and application to study on QSPR/QSAR [J]. J Comput Chem, 2007, 28: 2413-2423.
[26] GUHA R, SERRA J R, JURS P C. Generation of QSAR sets with a self-organizing map [J]. J Mol Graph Model, 2004, 23: 1-14.
[27] WOLD S, RUHE A, WOLD H, DUNN W. The collinearity problem in linear regression, the partial least squares approach to generalized inverse SIAM [J]. J Sci Stat Comp, 1984, 5: 735-743.
[28] WOLD S. PLS for multivariate linear modeling [J]. Chemometric Methods in Molecular Design, 1995, 2: 195.
[29] AJMANI S, AGRAWAL A, KULKARNI S A. A comprehensive structure-activity analysis of protein kinase B-alpha (Akt1) inhibitors [J]. J Mol Graph Model, 2010, 28: 683-694.
[30] GOODARZI M, DUCHOWICZ P R, WU C H, FERNANDEZ F M, CASTRO E A. New hybrid genetic based support vector regression as QSAR approach for analyzing flavonoids-GABA(A) complexes [J]. J Chem Inf Model, 2009, 49: 1475-1485.
[31] GOODARZI M, FREITAS M P, WU C H, DUCHOWICZ P R. pKa modeling and prediction of a series of pH indicators through genetic algorithm-least square support vector regression [J]. Chemom Intell Lab Sys, 2010, 101: 102-109.
[32] ROY P P, ROY K. On some aspects of variable selection for partial least squares regression models [J]. QSAR Comb Sci, 2008, 27: 302-313.
[33] ZHU M J, GE F, ZHU R L, WANG X Y, ZHENG X Y. A DFT-based QSAR study of the toxicity of quaternary ammonium compounds on Chlorella vulgaris [J]. Chemosphere, 2010, 80: 46-52.
[34] ZHOU C Y, CHU X, NIE C M. Predicting thermodynamic properties with a novel semi-empirical topological descriptor and path numbers [J]. J Phys Chem B, 2007, 111: 10174-11079.
[35] CAO Chen-zhong. The substituent effect in organic chemistry [M]. Beijing: Science Press, 2003: 20-24. (in Chinese)
[36] GOLMOHAMMADI H, SAFDARI M. Quantitative structure�C property relationship prediction of gas-to-chlorofm partition coefficient using artificial neural network [J]. Microchim J, 2010, 95: 140-151.
[37] LIU G S, YU J G. QSAR analysis of soil sorption coefficients for polar organic chemicals: Substituted anilines and phenols [J]. Water Res, 2005, 39: 2048-2055.
[38]  M, KUZMANOVSKI I. Counter- propagation artificial neural networks as a tool for prediction of pKBH+ for series of amides [J]. Chemom Intell Lab Syst, 2010, 102: 123-129.
[39] WOLD S, SJ STRM M, ERIKSSON L. PLS-regression: A basic tool of chemometrics [J]. Chemometrics and Intelligent Laboratory Systems, 2001, 58(2): 109-130.
[40] GOLBRAIKH A, TROPSHA A. QSAR modeling using chirality descriptors derived from molecular topology [J]. J Comput Aided Mol Des, 2002, 16: 357-369.
[41] GOLBRAIKH A, TROPSHA A. Beware of q2! [J]. J Mol Graphic Model, 2002, 20: 269-276.
(Edited by FANG Jing-hua)
Foundation item: Project supported by the Postdoctoral Science Foundation of Central South University, China; Project(2015SK20823) supported by Science and Technology Project of Hunan Province, China; Project(15A001) supported by Scientific Research Fund of Hunan Provincial Education Department, China; Project(CX2015B372) supported by Hunan Provincial Innovation Foundation for Postgraduate, China; Project supported by Innovation Experiment Program for University Students of Changsha University of Science and Technology, China
Received date: 2015-06-10; Accepted date: 2015-12-10
Corresponding author: DAI Yi-min, Associate Professor, PhD; Tel: +86-731-85258733; E-mail: yimindai@sohu.com

