Effect of Zr on microstructure and properties of Cu–15Cr alloy
来源期刊:中南大学学报(英文版)2017年第12期
论文作者:毕莉明 田伟
文章页码:2757 - 2766
Key words:Cu–Cr–Zr alloy; in-situ composites; isothermal annealing; CuZr intermetallic compounds; mechanical properties
Abstract: In order to study the effect of Zr on the microstructure and isothermal annealing performance of Cu–Cr in situ composites, Cu–15Cr and Cu–15Cr–0.24Zr alloys were prepared by means of vacuum medium frequency induction melting technology. The two kinds of test alloys with deformation of 3.79 were subjected to isothermal annealing test. The effects of Zr on the as-cast microstructure, the isothermal annealing structure and the tensile fracture morphology of Cu–15Cr alloy were studied by means of scanning electron microscopy (SEM), energy dispersive spectroscopy (EDS) and transmission electron microscopy (TEM). The results show that the addition of Zr leads to the formation of homogeneous and fine CuZr intermetallic compounds, which suppresses the formation electron microscopy of eutectic Cr phase and makes the eutectic Cr content much lower than that of Cu–15Cr alloy. The recrystallization temperature of the Cu matrix is increased, and it is maintained at a fine equiaxed crystal at 400 °C. After isothermal annealing at 400 °C for 220 h, the tensile strength, electrical conductivity and elongation of the test alloy containing Zr were 720 MPa, 68% IACS and 6.7%, respectively; while the tensile strength, electrical conductivity and elongation of the test alloys without Zr were 488 MPa, 70% IACS and 12.4%, respectively.
Cite this article as: TIAN Wei, BI Li-ming. Effect of Zr on microstructure and properties of Cu–15Cr alloy [J]. Journal of Central South University, 2017, 24(12): 2757–2766. DOI:https://doi.org/10.1007/s11771-017-3689-0.
J. Cent. South Univ. (2017) 24: 2757-2766
DOI: https://doi.org/10.1007/s11771-017-3689-0

TIAN Wei(田伟)1, BI Li-ming(毕莉明)2
1. College of Science, University of Shanghai for Science and Technology, Shanghai 200093, China;
2. University of Shanghai for Science and Technology, Shanghai 200093, China
 Central South University Press and Springer-Verlag GmbH Germany,part of Springer Nature 2017
Abstract: In order to study the effect of Zr on the microstructure and isothermal annealing performance of Cu–Cr in situ composites, Cu–15Cr and Cu–15Cr–0.24Zr alloys were prepared by means of vacuum medium frequency induction melting technology. The two kinds of test alloys with deformation of 3.79 were subjected to isothermal annealing test. The effects of Zr on the as-cast microstructure, the isothermal annealing structure and the tensile fracture morphology of Cu–15Cr alloy were studied by means of scanning electron microscopy (SEM), energy dispersive spectroscopy (EDS) and transmission electron microscopy (TEM). The results show that the addition of Zr leads to the formation of homogeneous and fine CuZr intermetallic compounds, which suppresses the formation electron microscopy of eutectic Cr phase and makes the eutectic Cr content much lower than that of Cu–15Cr alloy. The recrystallization temperature of the Cu matrix is increased, and it is maintained at a fine equiaxed crystal at 400 °C. After isothermal annealing at 400 °C for 220 h, the tensile strength, electrical conductivity and elongation of the test alloy containing Zr were 720 MPa, 68% IACS and 6.7%, respectively; while the tensile strength, electrical conductivity and elongation of the test alloys without Zr were 488 MPa, 70% IACS and 12.4%, respectively.
Key words: Cu–Cr–Zr alloy; in-situ composites; isothermal annealing; CuZr intermetallic compounds; mechanical properties
1 Introduction
Cu–Cr system in-situ fiber reinforced composites is a kind of high strength and high electrical conductivity material with excellent comprehensive performance, whose tensile strength can reach more than 1000 MPa and electrical conductivity can reach 70% IACS [1–3]. Compared with Cu–Ag and Cu–Nb-based deformed in-situ fiber reinforced composites, it has a high cost performance and has a good prospect in the field of high- speed electrified locomotive contact wires and high- power vacuum circuit breaker [4–6]. Such materials in the application process, in addition to withstanding the instantaneous high temperature, and sometimes also at high temperatures to maintain long hours of work, therefore, for a long time in high temperature environment, whether the material is still able to maintain a stable performance is particularly important. In the study of Cu–12Ag isothermal annealing, LIU et al [7] found that the strength of the alloy can reach 700 MPa when annealing at 400 °C for 0.5 h, and the strength reduced to 500 MPa or less when annealing at 400 °C for 25 h. It can be seen that the effect of annealing time on material properties can not be ignored. It is a meaningful task to add a suitable third component to the alloy to maintain a stable overall performance for a long time at high temperatures. At present, the reported ternary alloying elements applied to Cu–Cr alloys are mainly Sn, Zr, Ag, etc. [8–10], but mainly related to the influence of these elements on tensile strength, electrical conductivity, anti-softening temperature, friction and wear properties of Cu–Cr alloy. For example, SKAI et al [8] studied the effect of Sn on the tensile strength and electrical conductivity of Cu–15Cr in-situ composites. It was found that, when added 0.1Sn, the tensile strength reached 1100 MPa and the electrical conductivity reached 70%IACS. ZHANG and CHEN [9] studied the relationship of Cu/Cr interface in Cu–15Cr–0.1Zr in-situ composites and found that the Cu/Cr interface maintained semi-coherent when the amount of drawing deformation was 6.43. LIU et al [10] studied the effect of directional solidification on the microstructure and mechanical properties of Cu–7Cr–0.1Ag in-situ composites. It was found that the tensile strength reached 1000 MPa and the conductivity reached 80%IACS.
In practice, these composite materials are required to have a long service time. Therefore, in order to prolong the service life of the material, it is necessary to further study the micro thermal stability of the material and its microcosmic performance. In this work, the effect of Zr on mechanical properties, electrical conductivity and microstructure in different states of Cu–15Cr alloy, after isothermal annealing, was studied. Moreover, the regularity of isothermal annealing was discussed.
2 Experimental materials and methods
Cu–15Cr (mass fraction,%, was used through this report) and Cu–15Cr–0.24Zr, two kinds of test alloys with a purity of more than 99.95% cathode electrolytic copper, purity of more than 99.5% of industrial pure Cr and sponge zirconium, were melted in a vacuum intermediate frequency induction furnace after the nominal composition was well matched. The cylindrical as-cast iron ingot mould was used for pouring, and its size was 83 mm in diameter and 180 mm in length. The alloy was melted in a magnesia crucible, and the pouring temperature after melting was from 1600 to 1650 °C.
In the test, the Cu–15Cr and Cu–15Cr–0.24Zr alloy ingots with a diameter of 83 mm were hot forged into bars with a diameter of 20 mm, and then they were heat treated at 1000 °C in a box-type resistance furnace for 1 h and then quenched in water. Subsequently, the test alloy after solution treatment was multi-pass cold drawn at room temperature into a diameter of 3 mm (strain of 3.79) wire. The strain is expressed as logarithm η=ln(A0/Af), where A0 is the cross-sectional area of the sample after hot forging, and Af is the cross-sectional area after drawing.The prepared samples with a diameter of 3 mm were subjected to a isothermal annealing test at 200, 400 and 550 °C for 1–300 h, respectively. The annealing was carried out in a tube furnace where N2 was a protective atmosphere and cooled in air. Then, the microstructure, mechanical properties and conductive properties of the samples in each stage were tested.
The microstructures of the test alloys were observed by FEI QANTA450 field emission scanning electron microscope (SEM). The composition of the test alloy was analyzed by an energy-dispersive spectrometer (EDS) with a scanning electron microscope. The Cu matrix in the test alloy was observed by Tecnai G2 F30 TEM (transmission electron microscope), and the acceleration voltage was 300 kV. The initial angle of the thinning is 8°. After the micropores were formed, the angle of the electron gun was adjusted to 4°, and the thinning was continued for 300 s. The tensile strength was tested on ZWICK Z50 KN precision universal testing machine. The resistance value of the test alloy was measured by ZY9987 digital micro-ohm test. The measurement accuracy was 0.02% and the test alloy length was selected as 200 mm. The corrosive solution was treated with a concentration of 63% HNO3 solution. The etched samples were cleaned with alcohol in ultrasonic waves.
3 Results and discussion
3.1 Effect of Zr on as-cast microstructure
Figure 1 shows the SEM images of Cu–15Cr and Cu–15Cr–0.24Zr as-cast alloys after corrosion. It can be seen from Fig. 1(a) that the microstructure of Cu–15Cr as-cast alloy consists of three phases: Cu matrix, dendritic Cr and eutectic Cr. It also can be seen from Fig. 1(b) that the microstructure in Cu–15Cr–0.24Zr as-cast alloy consists of four phases: Cu matrix, dendritic Cr, eutectic Cr, and acicular CuZr phase.
Compared with the eutectic Cr in Figs. 1(a) and (b), it can be found that the content of eutectic Cr is remarkably reduced when Zr is added, indicating that the addition of Zr greatly inhibits the formation of eutectic Cr. In the Cu–15Cr alloy, a large amount of eutectic Cr surrounds the dendrite Cr, while the eutectic Cr content in Cu–15Cr–0.24Zr alloy is less and is dispersed in the Cu matrix with the shape of stick. The phase indicated by the arrows in the enlarged area in Fig. 2(b) is distributed in the Cu matrix in a fine white needle shape with a length of about 4 um. In order to determine the composition of the phase, its EDS test was carried out.

Fig. 1 SEM images of test as-cast alloys with corrosion:
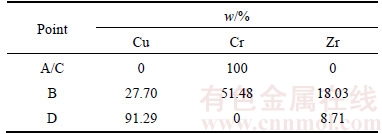
Table 1 shows the results of EDS analysis at positions A, B, C and D in Fig.1. It can be seen that there is a large amount of Cr in point B, while Cr is zero in point D. This Indicates that the Cr at point B is from the dendritic Cr, and most of the Cu at the point D is from the matrix Cu. it illustrates that the white fine phase consists of Cu and Zr, and is CuZr intermetallic compound.
Table 1 EDS test result
3.2 Effect of Zr on Cr fiber
Cu–15Cr and Cu–15Cr–0.24Zr alloy samples were drawn at room temperature to a diameter of 3 mm, and then were annealed at different temperatures for 220 h. Figure 2 shows the SEM images of the Cr fiber after the above process. As can be seen from Figs. 2(a) and (d), the Cr fibers did not change after isothermal annealing at 200 °C, and the edges of the Cr fibers were smooth and continuous. It can be seen from Figs. 2(b) and (e) that the Cr fibers in Cu–15Cr alloy are spheroidized at 400 °C, and the grain boundary morphology is clearly visible, and some grains are separated along the grain boundary. However, the Cr fibers in the Cu–15Cr–0.24Zr alloy did not change, and no difference was shown in Fig. 2(d). It can be seen from Figs. 2(c) and (f) that the edge of part of the Cr fiber in the Cu–15Cr alloy is violently spheroidized at 550 °C, and the inside of the coarse Cr fiber has a columnar trend along the grain boundary, and the smaller fibers have a tendency to break. At this point, the edges of the Cr fibers in Cu–15Cr–0.24Zr alloy also begin to spheroidize, and the thinner Cr fibers are broken and the internal grains of the Cr fibers are coarsened.
3.3 Effect of Zr on Cu matrix
Figure 3 shows the TEM images of Cu matrix after Cu–15Cr and Cu–15Cr–0.24Zr alloys annealed at 400 °C for 220 h. It can be seen from Fig. 3(a) that the Cu matrix in the Cu–15Cr alloy undergoes complete recrystallization, and the Cu grains are coarse and the grain size is greater than 500 μm, and the coarse precipitates are distributed in the Cu matrix. It can be seen from Fig. 3(b) that the Cu grains in the Cu–15Cr–0.24Zr alloy are small and uniform, and no coarse precipitates are found. It is indicated that the addition of Zr hinders the migration of Cu grain boundaries, and inhibits the growth of Cu grains and improves the recrystallization temperature of the matrix.

Fig. 2 Effect of Zr on microstructure of Cu–15Cr (a, b, c) and Cu–15Cr–0.24Zr (d, e, f) alloys when isothermal annealing:

Fig. 3 TEM images of Cu matrix after isothermal annealing at 400 °C for 220 h:
3.4 Effect of Zr on electrical conductivity
Figure 4 shows the effect of Zr on the electrical conductivity of Cu–15Cr alloy after isothermal annealing. The annealing temperature is extended from 1 h to 300 h at 200 °C, and the electrical conductivity of the two test alloys does not change. After 400 °C×1 h isothermal annealing, the electrical conductivity of test alloy without Zr was increased to 61%IACS, and the electrical conductivity of test alloy with Zr was increased to 50%IACS. The electrical conductivity gradually was increased with the increase of annealing time, and the electrical conductivity can reach a steady state when the annealing time is bigger than 100 h. After annealing for 300 h, the electrical conductivity of the two test alloys reached 70%IACS and 68%IACS, respectively. When the isothermal annealing temperature is 550 °C, the electrical conductivity increases fastest, and the electrical conductivity of test alloy without Zr has reached the maximum 75%IACS by annealing for 1 h. However, the electrical conductivity of test alloy with Zr is only increased to 64%IACS by annealing for 1 h, and the electrical conductivity reached the maximum 71%IACS by annealing for 60 h. When the annealing time is extended to 300 h, the electrical conductivity of the two test alloys is maintained at about 70%IACS.
3.5 Effect of Zr on mechanical properties
Figure 5 shows the influence of Zr on the tensile strength of Cu–15Cr alloy after isothermal annealing. Compared with Figs. 5(a) and (b), it can be seen that the addition of Zr increases the tensile strength of the alloy and the recrystallization temperature of the matrix Cu, which makes the matrix Cu still be in the recovery phase when the annealing temperature is 400 °C.
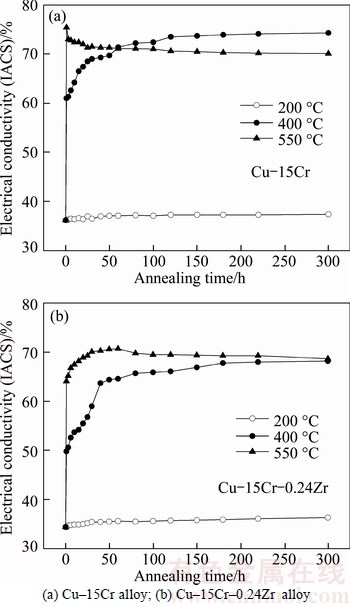
Fig. 4 Effect of isothermal annealing temperature and Zr on electrical conductivity:
It can be seen from Fig. 5(a) that the isothermal annealing at 200 °C has little effect on the tensile strength of Cu–15Cr alloy. The tensile strength is 710 MPa when the annealing time is less than 15 h, and the tensile strength decreases slightly and keeps at about 680 MPa when the annealing time is more than 15 h. The tensile strength decreases rapidly with the increase of annealing time when the isothermal annealing temperature is 400 °C, and the tensile strength will be reduced to 674 MPa after 1 h. After 400 °C×220 h, a relatively stable state was reached and the tensile strength was maintained at about 488 MPa. For 550 °C isothermal annealing, the tensile strength dropped rapidly to 553 MPa after 1 h. The tensile strength decreased to 489 MPa after 550 °C×3 h, and it decreased by about 200 MPa compared with that before annealing. After that, the tensile strength will decrease slowly with the increase of annealing time, and it will tend to stabilize after 50 h.
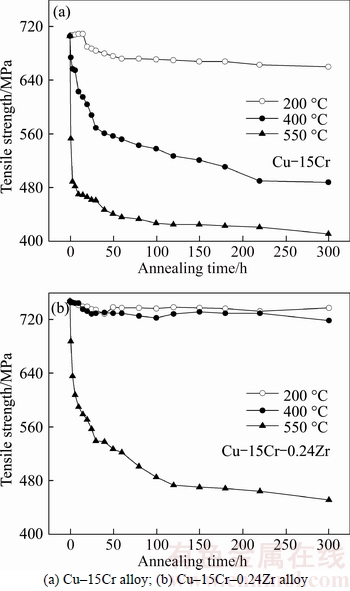
Fig. 5 Effect of isothermal annealing temperature and Zr on tensile strength:
It can be seen from Fig. 5(b) that the annealing time has little effect on the tensile strength of Cu–15Cr– 0.24Zr alloy when the isothermal annealing occurs at 200 and 400 °C. The tensile strength will be kept around 730 MPa by annealing for 220 h. For isothermal annealing at 550 °C, the tensile strength gradually decreases with the increase of annealing time, and the tensile strength decreased rapidly when the isothermal time was less than 6 h. The tensile strength will decrease to 451 MPa by annealing for 220 h.
Through the comparison and analysis of Figs. 4 and 5, it can be seen that the electrical conductivity and tensile strength of Cu–15Cr and Cu–15Cr–0.24Zr alloys are in a very stable stage when the isothermal annealing time is 220 h. Therefore, the effect of Zr on the stress–strain curve and fracture morphology of Cu–15Cr alloy was studied by using the experimental alloy with 220 h isothermal annealing as the research object.
Figure 6 shows the effect of Zr on the stress–strain curve of Cu–15Cr alloy after isothermal annealing. It can be seen from Fig. 6(a) that increasing the annealing temperature or prolonging the annealing time can reduce the strength of the material and increase the plasticity, but the amplitude of the influence is obviously different. When the isothermal annealing temperature is 200 °C, the annealing time has little effect on the plasticity of the material. In the case of non-annealing, the plasticity of the material is poor, at that time the elongation is 4.3%. After annealing for 180 h, the tensile strength decreased to 668 MPa and the elongation rate increased slightly, and the elongation rate at this time was 5.5%. For isothermal annealing at 400 °C, the plasticity of the material increased obviously with the increase of annealing time, and the elongation rate was 6.9% by annealing for 10 h, and the elongation rate increased to 12.4% by annealing for 220 h. The tensile strength is 489 MPa and the elongation rate is 11.7% after 450 °C× 3 h isothermal annealing. The elongation rate increased to 15.7% after 450 °C×220 h isothermal annealing, at this point, the tensile strength has been reduced to 421 MPa.
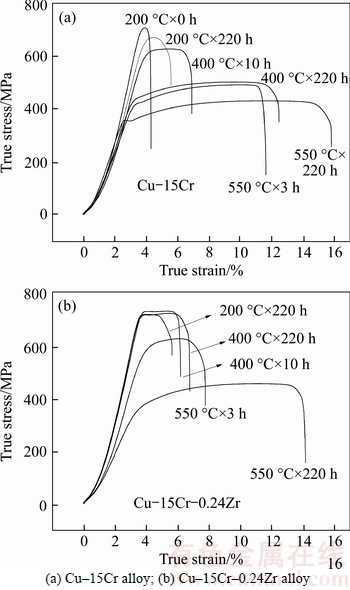
Fig. 6 Effect of isothermal annealing temperature and Zr on stress–strain curve:
It can be seen from Fig. 6(b) that the elongation rates are 4.9%, 6.7% and 14.1%, respectively, after annealing at 200, 400 and 550 °C for 220 h. For isothermal annealing at 200 and 400 °C, even if the annealing time is extended, the plasticity of the material has almost no change. For isothermal annealing at 550°C, the plasticity of the material increased significantly with the increase of annealing time, and the elongation rate was 7.7% by annealing for 3 h. The elongation rate increased about 2 times after 550 °C×220 h isothermal annealing. After 550 °C×220 h isothermal annealing, the elongation rate increased about 2 times; however, the tensile strength decreased significantly and it dropped from 748 MPa at non-annealing to 463 MPa at this time.
Compared with Figs. 6(a) and (b), it can be found that the addition of Zr reduces the plasticity of the alloy and significantly affects the plastic change trend of the alloy at 400 and 550 °C isothermal annealing, which makes the plasticity of the alloy at 400 °C isothermal annealing do not change and the elongation rate remains at about 6.7%. However, the elongation rate of the Cu–15Cr alloy after annealing for 220 h, has been increased to 12.4%.
3.6 Effect of Zr on fracture morphology
Figure 7 shows the SEM images of fracture morphology of Cu–15Cr and Cu–15Cr–0.24Zr alloy after isothermal annealing at 400 and 550 ° C for 220 h. It can be seen that under the two annealing temperatures, the tensile fracture of the two alloys is mainly composed of dimples, and the dimple density increases with the annealing temperature. It indicates that the fracture is a typical ductile fracture, and the plastic will increase with the rises of annealing temperature.
The particle phase (indicated by the arrow) can be found in the dimple, and the EDS analysis shows that the phase is Cr (see Figs. 7(c) and (f)). This indicates that the fracture of the alloy is mainly the aggregation fracture of micropores, where the micropores are separated from the matrix interface by the particle phase before the alloy fracture. Because the deformation modulus of Cr particle is much larger than that of the Cu matrix, under high strain conditions, Cr particle and the Cu matrix will be separated due to the plastic uncoordinated deformation, or the dislocation lines caused by the deformation of the alloy will form a plug or dislocation ring when they move to the particle phase, so that the stress here is highly concentrated. Under the above-mentioned causes, micropores are liable to occur near the particle phase. Once the micropores are formed, the dislocations around the micropores are rapidly pushed into the micropore by the repulsion force, and cause the dislocation source to release the new dislocation. So repeatedly, the micropores grow up, and this is the source of the crack in the alloy during the tensile process. When the micropores exceed the critical crack size, the crack spreads and the alloy breaks. The dimples of varying size or shape observed in fracture morphology are the result of microporous nucleation.
ARGON and SAFOGLU [11] concluded calculation that as long as the diameter of the second phase particles is greater than 10 nm, which can meet the critical elastic properties and critical interface stress requirements, so that particles are separated from the matrix. After adding Zr into Cu–15Cr alloy, the content of eutectic Cr decreased significantly (see Fig. 1), and the number of micropores formed decreased. Moreover, the probability of stress concentration increased and the plasticity decreased, and the dimple number decreased, which was consistent with the analysis result of the stress–strain curve in Fig. 6.
4 Discussion
4.1 Effect of Zr on as-cast microstructure and mechanical property
By Cu–Cr binary alloy phase diagram, in Cu–1.28Cr alloy at 1350 K the reaction L→eutectic(Cu+Cr) will occur, but to the Cu–15Cr hypereutectic alloy, the solidification phase and the eutectic phase are competing with each other during the solidification process. The temperature of the two-phase growth and the supercooled degree of the crystallization are different, and the lower supercooled phase will form nuclei first. The supercooled degrees of the first crystalline Cr phase and eutectic(Cu+Cr) phase are respectively Eqs. (1) and (2).
△TCr=GL/V+K1V1/2 (1)
 (2)
(2)
where GL is the temperature gradient; K1 and K2 are constant; and V is the growth rate.
In combination of Eqs. (1), (2) and Cu–Cr binary alloy phase diagram, the Cu–Cr eutectic phase of eutectic growth is greater than that of the primary Cr phase in a certain cooling rate. The melting point of the metal Cr is 2130 K and the pouring temperature of the test alloy is in the range of 1873 to 1923 K. It can be seen that the primary Cr phase has reached a large supercooled degree within the pouring temperature range. Therefore, the nucleation of the primary Cr phase is prior to the eutectic Cr phase.
In terms of concentration gradient, the eutectic Cr phase crystallization concentration was 1.28Cr (mass fraction, %), so the eutectic reaction can be carried out only when the eutectic initial supercooled degree and the suitable concentration are reached simultaneously. The primary Cr phase has both a small temperature gradient and a concentration gradient advantage, therefore, in both the Cu–15Cr alloy and the Cu–15Cr–0.24Zr alloy, the primary Cr phase (ie, the dendrite Cr phase) has a much larger volume fraction than the eutectic Cr phase.
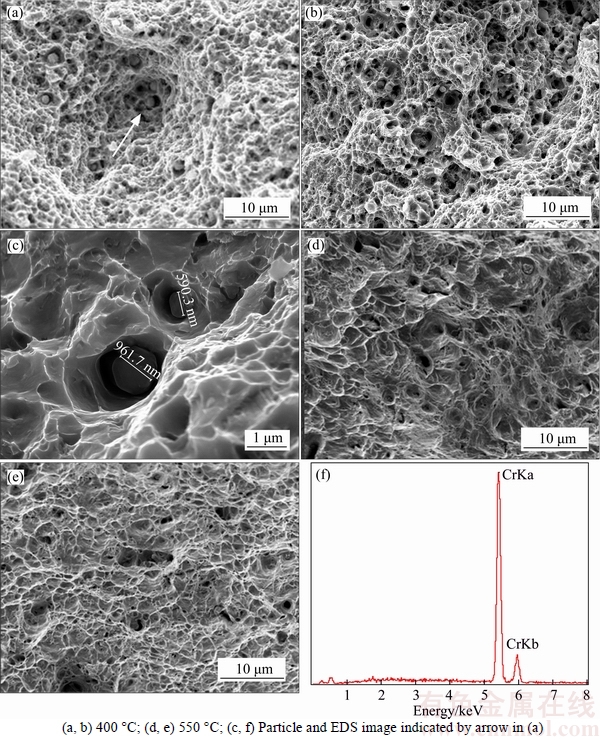
Fig. 7 SEM images of fracture morphology of Cu–15Cr (a, e) and Cu–15Cr–0.24Zr (b, d) alloys after 220 h isothermal annealing:
By comparing the as-cast microstructure of Cu–15Cr and Cu–15Cr–0.24 alloys in Fig. 2, we can find that the eutectic Cr phase in the as-cast microstructure of the Cu–15Cr alloy is more and smaller in size. The main reasons are as follows.
According to the regular solution model, the mixed Gibbs free energy of Cu–Cr–Zr ternary alloy [12, 13] (△Gmix) is:
△Gmix=RT(xCulnxCu+xCrlnxCr+xZrlnxZr)+EGm (3)
where xCu, xCr and xZr are the mole percentages of Cu, Cr and Zr, respectively; R is the gas constant; EGm is the excess △Gmix. EGm is expressed as
EGm=ΩCuCrxCuxCr+ΩCuZrxCuxZr+ΩCrZrxCrxZr+ΩCuCrZrxCuxCrxZr(4)
where ΩCuCrxCuxCr, ΩCuZrxCuxZr and ΩCrZrxCrxzr are △Gmix of Cu–Cr, Cu–Zr and Cr–Zr binary systems; ΩCuCrZrxCuxCrxZr is the excess △Gmi of Cu–Cr–Zr ternary system; ΩCuCr, ΩCuZr and ΩCuCrZr are the interaction parameters between Cu–Cr, Cu–Zr, Cr–Zr and Cu–Cr–Zr.
According to the research results of JACOB and FITZNER [14, 15], the interaction parameters of Cu–Cr, Cu–Zr and Cr–Zr binary systems can be expressed as:
 (5)
(5)

 (6)
(6)

 (7)
(7)
For Cu–15Cr–0.24Zr alloy, by calculation, we can get xCuxCr≈0.26983, xCuxZr≈0.00308, xCrxZr≈0.00042, xCuxCrxZr≈ 0.00059, therefore,ΩCuCrZrxCuxCrxZr ≈ 0.
The binary Cu–Cr phase diagram with metastable solvate region is calculated by Formulas (1) to (5), as shown in Fig. 8. The relation between Zr content and △Gmix in Cu–15Cr–xZr alloy system is calculated by combining Fig. 6 and Formulas (6) to (10), as shown in Fig. 9.
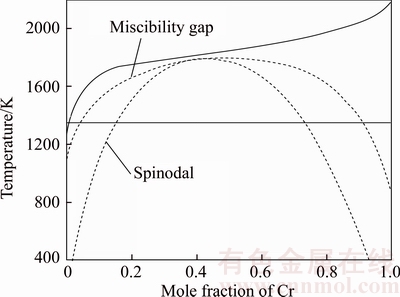
Fig. 8 Diagram with metastable miscibility of binary Cu–Cr alloy
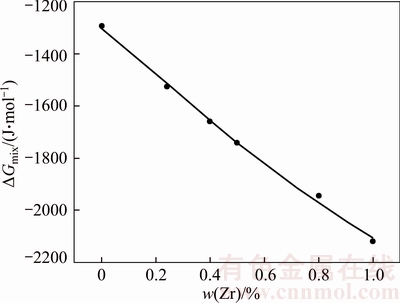
Fig. 9 Relationship between Zr content and △Gmix
It can be seen from the above calculation results that adding a certain amount of Zr to Cu–15Cr alloy reduces the △Gmix of the system, thus reducing the liquid separation temperature and reducing the dynamic nucleation driving force.
The nucleation driving force decreases with the dynamic equilibrium; the nucleation probability of the primary Cr phase increases; the liquid separation temperature decreases; and the growth of the primary Cr phase is accelerated. At the same Cr content, the volume increase of the primary Cr phase will inevitably lead to the decrease of the eutectic Cr phase content. These eutectic Cr phases are crushed into fine Cr particles during the delamination process, and can not form Cr fibers with enhanced behavior. These Cr particles crushed by eutectic Cr are similarly distributed Cu particles in the matrix, when subjected to external force, will become a stress concentration source. They will crack first, and then will reduce the tensile strength of the material. The morphological analysis of the fractures in Figs. 6(a) and (b) also shows that eutectic Cr is a stress concentration source of alloy fracture. Therefore, the tensile strength of Cu–15Cr–0.24Zr alloy is improved on the one hand due to the produce of a large number of uniform, small CuZr intermetallic compounds; on the other hand due to a significant reduction of eutectic Cr.
The tensile strength of Cu–15Cr alloy is mainly due to the enhancement of Cr fibers. Therefore, when the Cr fibers are recrystallized, spheroidized and broken, the tensile strength of the test alloys will be significantly reduced. In the test, the spheroidization and fracture of the Cr fibers in Figs. 2(b) and (c) are in good agreement with the sharp decrease in the tensile strength of the Cu–15Cr alloy in Fig. 5(a). The Cr fibers in Figs. 2(d) and (e) did not change, and the tensile strength of Cu–15Cr–0.24Zr alloy did not change significantly at 200 and 400 °C in Fig. 5(b). In Fig. 2(f), Cr fibers are spheroidized and coincide with the tensile strength of Cu–15Cr–0.24Zr alloy in Fig. 5(b).
4.2 Analysis of variation of Cr fiber
The disturbance model [16] was proposed in the analysis of the instability of the water column. It is considered that the cylindrical capillary is controlled by diffusion and is very unstable. In order to reach the steady state, the surface energy can develop to the minimum trend, which leads to the water column breaking into a series of spherical water beads. In the study of the high temperature stability of the fiber composites [17], the perturbation model was developed and the specific equations of the control perturbation were given
 (8)
(8)
where δ is the disturbance amplitude; τ is the heating time; ω is the spatial frequency of the disturbance; λ is the disturbance wavelength; r0 is the initial radius of the cylinder; B is the disturbance coefficient and can be expressed as
 (9)
(9)
where D1 is the atom diffusion coefficient of fiber at the fiber/matrix interface; γ1 is the fiber/matrix interface energy; v is the number of diffusion atoms v=Ω–2/3; Ω is the diffusion atom volume; KB is the Boltzmann constant; T is the thermodynamic temperature. The time required for fiber fracture can be calculated:
 (10)
(10)
Thus, the temperature T required to obtain the fiber fracture is:
 (11)
(11)
 (12)
(12)
Thus, Eq. (11) can be simplified as
 (13)
(13)
In Eq. (13), δ0 is the original sinusoidal disturbance at the fiber/matrix interface, taking the Barker’s vector magnitude.
Although it is not possible to calculate the specific destabilization time and temperature of the Cr fiber by the above formula, it can be deduced from Fig. 2 and Eqs. (10) and (12) that the smaller the diameter of the fiber, the shorter the time required to break the fiber. It also can be deduced that the fiber can be broken only if it reaches a certain temperature when the annealing time is certain and the final unstable Cr fiber will break into a series of Cr particles as long as the time is long enough. In this experiment, Cr fibers will break into a series of Cr particles, which is similar to the instability of water column in this model, and is also the result of the development of surface energy to a minimum trend. So, the instability of Cr fibers can be described by using the fiber instability perturbation equation.
After adding Zr to the Cu–15Cr alloy in Fig. 3, the recrystallization temperature of Cu matrix increased from 400 to 550 °C. It can be deduced that the spheroidization and fracture temperatures of Cr fibers in Figs. 2(c) and (f) increased from 400 to 550 °C are because the stability of Cu/Cr interface increases the diffusion energies of Cr atoms. Thus, with the same annealing time, the spheroidization of Cr fibers will require a higher annealing temperature.
4.3 Effect of Zr on electrical conductivity
The theory of metal electronics states that the electron wave will be scattered in the area where it is destroyed when the integrity of the crystal lattice is destroyed, which will produce resistance. Heterogeneous atoms, vacancies, dislocations, grain boundaries and phase boundaries will make the copper alloy resistivity increase, because the existence of these factors will destroy the ideal lattice in the crystal cyclical. In the study of Cu-based in-situ composites, VERHOEVEN et al [18] pointed out that the resistance of copper alloy is mainly composed of four scattering mechanisms: phonon scattering, impurity scattering, interfacial scattering and dislocation scattering.
 (14)
(14)
where ρtot, ρpho, ρimp, ρint and ρdis are the total resistance, the phonon scattering resistance, the impurity scattering resistance, the interface scattering resistance, and the dislocation scattering resistance, respectively.
As can be seen from Fig. 2, only a small amount of fine Cr fibers had a fracture tendency after 550 °C×220 h isothermal annealing. It can be seen that the Cu/Cr interface density does not change much, and the effect on the electrical conductivity is very limited. ρimp is impurity scattering and ρdis is dislocation scattering, and their changes will have a great influence on the electrical conductivity of Cu–15Cr alloy. The effect of ρimp and ρdis on the electrical conductivity of Cu–15Cr alloy during annealing is discussed.
For 200 °C isothermal annealing, the alloy is in the recovery stage, and only the vacancy and other points of the defect density slightly reduced. Therefore, the electrical conductivity slightly increased, but the overall change is not big. For 400 °C isothermal annealing, the crystallization of the Cu matrix began to occur, and the dislocation density of cold deformation gradually decreases. Moreover, the supersaturated Cr atoms dissolved in the Cu matrix continue to precipitate and the solute scattering resistance gradually decreases. With the decreasing of the dislocation density and the continuous precipitation of Cr atoms, the electrical conductivity increases rapidly in a short time. In the later period of isothermal annealing, the electrical conductivity is almost no longer increased with the prolonging of annealing time, because the dislocation density does not change when the matrix is completely recrystallized, and the Cr atoms in the matrix have reached the equilibrium point and no further precipitation. For 550 °C isothermal annealing, compared with 400 °C isothermal annealing, in the same annealing time, the electrical conductivity increases to the maximum at a faster rate and the electrical conductivity is higher. This is because at higher annealing temperature, the precipitation rate of the solid-soluble Cr atoms is accelerated, the time to reach the equilibrium concentration is shortened greatly, and the dislocation density is reduced more violently. In the later period of isothermal annealing, the conductivity is reduced and it is consistent with that at 400 °C isothermal annealing. This may be due to the fracture of some fine Cr fibers, the increase of Cu/Cr interface, and the micro-dissolution of the precipitated Cr atoms, resulting in a slight decrease in conductivity.
In contrast to Figs. 4(a) and (b), it can be found that, by adding Zr, the electrical conductivity of the test alloy decreases slightly, but the effect is not significant. This is because the addition of Zr is small, and it can be seen from the influence curve in Ref. [19] that the dissolution of 0.24% Zr and 0.24% Cr in the copper matrix is comparable. At the same time, it is known from Refs. [19, 20] that most Zr and Cu form CuZr compounds. So, it can be deduced that only a small amount of Zr is dissolved in the copper matrix, and the solid solution capacity of the copper matrix is a certain. Solid solution of the Zr will inevitably reduce the ability of solid solution of Cr; therefore, the addition of trace amounts of Zr on the electrical conductivity of the material has little effect.
5 Conclusions
After adding 0.24Zr to Cu–15Cr alloy, it has a great influence on its as-cast microstructure, the microstructure of the isothermal annealing after the heavy deformation, the fracture morphology and mechanical properties, which is mainly manifested in the following aspects:
1) A sheet-like fine CuZr compound phase is formed. The formation of eutectic Cr phase is inhibited, so that the content of eutectic Cr is much lower than that of Cu–15Cr alloy.
2) The recrystallization temperature of the Cu matrix is increased, and it remained with small equiaxed grains after isothermalannealing at 400 °C for 220 h.
3) The number of micropores in the fracture is significantly reduced, resulting in a decrease in the number of dimples. The probability of stress concentration increases and the plasticity decreases.
4) The comprehensive performance of the alloy after isothermal annealing is significantly improved; the tensile strength, electrical conductivity and elongation rate are maintained at 720 MPa, 70% IACS and 6.7%, respectively, after isothermal annealing at 400 °C for 220 h.
References
[1] BI Li-ming, LIU ping, CHEN Xiao-hong, LIU Xin-kuan, MA Feng-cang, LI Wei. Analysis of phase in Cu–15wt.%Cr–0.24wt.% Zr alloy [J]. The Chinese Journal of Nonferrous Metals. 2013, 23(5): 1342–1348. (in Chinese)
[2] BI Li-ming, LIU Ping, CHEN Xiao-hong, LIU Xin-kuan, MA Feng-cang, LI Wei. Effect of alloying and intermediate annealing on microstructure and properties of Cu-Cr deformation processed in situ composites [J]. Rare Metal and Engineering, 2013, 42(5): 1085–1090. (in Chinese)
[3] DENG Jian-qi, ZHANG Xiu-qiang, SHANG Shu-zhen, LIU Fu, ZHAO Zu-xin, YE Yi-fu. Effect of Zr addition on the microstructure and properties of Cu–10Cr in situ composites [J]. Materials and Design, 2009, 30: 4444–4449.
[4] SANDIM H R Z, SANDIM M J R, BEMARDI H H. Annealing effects on the microstructure and texture of a multifilamentary Cu–Nb composite wire [J]. Scripta Materialia, 2004, 51: 1099–1104.
[5] LIU Jia-bin, MENG Liang. Phase orientation, interface structure and properties of aged Cu–6wt.%Ag [J]. Journal of Materials Science, 2008, 43: 2006–2011.
[6] WANG Meng-han, HUANG Long, CHEN Ming-liang, WANG Yan-li. Processing map and hot working mechanisms of Cu-Ag alloy in hot compression process [J]. Journal of Central South University of Technology, 2015, 22(3): 821-828.
[7] LIU Jia-bin, MENG Liang, ZHANG Lei. Effect of annealing processes on microstructure, mechanical properties and conductivity of Cu–12%Ag alloy composite-reinforced by ribers [J]. Rare Metal Materials and Engineering, 2005, 34(9): 1460–1464. (in Chinese)
[8] SKAI S, SUZUKI H G. Effect of Sn addition on the mechanical and electrical properties of Cu15%Cr in-situ composites [J]. Materials Transactions, 2012, 44(2): 232–238.
[9] ZHANG Q L, CHEN X H. Microstructure of interfaces in a Cu–15Cr–0.1Zr in situ composite [J]. Superlattices and Microstructure, 2014, 75: 54–58.
[10] LIU Ke-ming, JIANG Zheng-yi, ZHAO Jing-wei, Zou Jin, CHEN Zhi-bao. Effect of directional solidification rate on the microstructure and properties of deformation-processed Cu–7Cr–0.1Ag in situ composites [J]. Journal of Alloys and Compounds, 2014, 612: 221–226.
[11] ARGON A S, IM J, SAFOGLU R. Cavity formation from in elusions in ductile fracture [J]. Metallurgical and Materials Transactions A, 1975, 6: 825–831.
[12] HUANG F X, MA J S, NING H L, GENG Z T, LU C, GUO S M.. Analysis of phases in a Cu–Cr–Zr alloy [J]. Scripta Materialia, 2003, 48: 97–102.
[13] ZENG J K, HAMALINEN M. A theoretical study of the phase equilibria in the Cu–Cr–Zr system [J]. Journal of Alloys and Compounds, 1995, 220: 53–61.
[14] JACOB K T, FITZNER K. The estimation of the thermodynamic properties soft ternary alloys from binary data using the shortest distance composition path [J]. Thermoehimiea Acta, 1977, 18: 197–206.
[15] ZENG K J,  M, LUKAS H L. A new thermodynamic description of the Cu–Zr system journal of phase equilibria [J]. Journal of Phase Equilibria, 1994, 15: 577–586.
[16] SHARMA G, RAMANUAN R V, TIWARI G P. Instability mechanisms in lamellar microstructures [J]. Acta Materialia, 2000, 48: 875–889.
[17] CLINE H E. Shape instabilities of eutectic composites at elevated temperatures [J]. Acta Metallurgica, 1971, 19: 481–490.
[18] VERHOEVEN J D, DOWNING H L, GIBSON E D. The resistivity and microstructure of heavily drawn Cu–Nb alloys [J]. Journal of Applied Physics, 1989, 65: 1293–1301.
[19] WEN Jiu-ba. Metal materials [M]. Beijing: China Machine Press, 2011. (in Chinese)
[20] WU Yi-feng, WANG Ming-pu, LI Zhou, XIA Fu-zhong, XIA Cheng-dong, LEI Qian, YU Hong-chun. Effects of pre-aging treatment on subsequent artificial aging characteristics of Al-3.95Cu-(1.32Mg)-0.52Mn-0.11Zr alloys [J], Journal of Central South University of Technology, 2015, 22(1): 1-7.
(Edited by YANG Hua)
Cite this article as: TIAN Wei, BI Li-ming. Effect of Zr on microstructure and properties of Cu–15Cr alloy [J]. Journal of Central South University, 2017, 24(12): 2757–2766. DOI:https://doi.org/10.1007/s11771-017-3689-0.
Foundation item: Project(10874118) supported by the National Natural Science Foundation of China; Project(109061) supported by the key Project of the Ministry of Education of China
Received date: 2017-08-10; Accepted date: 2017-12-10
Corresponding author: BI Li-ming, PhD, Lecturer; Tel: +86–21–55781550; E-mail: lmbi0106@163.com

