Trans. Nonferrous Met. Soc. China 25(2015) 3204-3211
Effect of welding current on morphology and microstructure of Al alloy T-joint in double-pulsed MIG welding
Jie YI, Shu-fen CAO, Luo-xing LI, Peng-cheng GUO, Kai-yong LIU
State Key Laboratory of Advanced Design and Manufacturing for Vehicle Body, Hunan University, Changsha 410082, China
Received 23 January 2015; accepted 22 June 2015
Abstract: The effect of current on the morphology of Al alloy T-joint in double-pulsed metal inert gas (DP-MIG) welding process was investigated by simulation and experiment. A three-dimensional finite element model and the DP-MIG heat source of double-ellipsoidal volumetric model were developed to simulate the temperature and stress fields under different welding conditions. The macro-morphology and microstructure of welding joints at the corresponding currents were observed in the experiment. The results show that the best condition is at an average current of 90 A and current difference of 40 A, when the maximum temperature is 200 ��C higher than the fusion points, with the temperature difference of about 100 ��C and stress change of 10 MPa between thermal pulse and thermal base. Under these conditions, Al alloy T-joint with proper fusion condition has smooth fish-scale welding appearance and finer microstructure. Furthermore, the thermal curves and stress distribution in the experiment are consistent with those in the simulation, verifying the precision of the welding simulation.
Key words: double-pulsed MIG welding; Al alloy T-joint; welding current; stress
1 Introduction
With the excellent properties of low density, high yielding-to-tensile ratio, and good corrosion resistance, Al alloy has been widely used in the automobile industry to energy conservation and emission reduction. However, poor welding performances of Al alloy, such as strong oxidizing ability, large thermal conductivity and expansion, are likely to give rise to many defects in the Al alloy welding joint, such as incomplete fusion, porosity and cracking [1]. Moreover, the Al alloy used in a car��s body structure is focused on sheets with 2-3 mm in thickness and extrusions, which greatly reduces the stability during the welding process of Al alloy and worsens the welding joint quality. Pulsed metal inert gas (P-MIG) welding, as an efficient and high-quality welding method of Al alloy, provides excellent controllability of droplet transfer. In P-MIG, droplet spray metal transfer can be achieved when the average current is lower than the critical current and the mode of one droplet transfer per pulse can be obtained for maintaining stability during the welding process [2].
Double-pulsed metal inert gas (DP-MIG) welding was developed as a variation form of P-MIG, in which a low frequency pulse is superimposed into a single high- frequency pulse. The principle of DP-MIG is shown in Fig. 1 and the welding current is altered between the thermal pulse and the thermal base in the cycle of low- frequency pulse, which induces the changes of temperature and stress of the weld pool. As a consequence, it could result in the typical rippling appearance and the strong stirring effect of the weld pool [3,4]. A proper setup of welding parameters (welding currents, arc voltage, etc.) is an important factor to guarantee that the welding process runs smoothly and to obtain acceptable joint quality. Welding currents as main parameters in DP-MIG, including the average current and the current difference between thermal pulse and thermal base, have significant influence on the temperature and stress of weld pool during the welding process, which would affect the quality of the welding joint further.
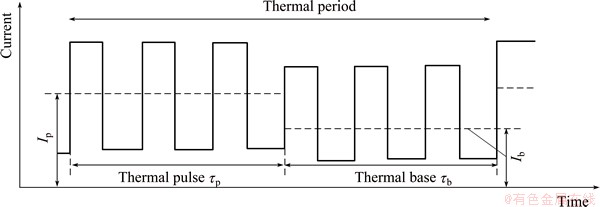
Fig. 1 Principle of DP-MIG welding
However, much attention about DP-MIG is mainly paid to the arc behavior, drop transition, and joint properties [5,6]. Limited studies reveal the effect of DP-MIG on the Al alloy T-joint by discussing the temperature and stress of weld pool at different currents. In this work, the method of finite element analysis was adopted to simulate the process of DP-MIG, and the temperature and stress fields at different currents can be obtained by calculation. In addition, the formation and microstructure of welding joint at the corresponding current were observed by experiment. Current difference can be obtained in combination with the results of simulation and experiment. In addition, the results of simulation were compared with the measurements during the actual experiment of time�Ctemperature curves and stress distribution to determine the calculation accuracy.
2 Experimental
2.1 Materials and welding parameters
The base material was 6061-T6 Al alloy sheet with a thickness of 2 mm and the filler wire adopted was ER5356 Al-Mg alloy with a diameter of 1.2 mm. The dimensions of the web and the flange were 200 mm �� 50 mm and 200 mm �� 80 mm, respectively. Welding operation was fully done by an automatic MIG welder at the self-made fixture. The welding power source used was DP400 developed by OTC to provide DP-MIG.
To maintain the stability of the welding process, the mode of one droplet transfer per pulse was obtained by adjusting the high-frequency pulse parameters, as shown in Fig. 2 [7]. The thermal frequency and the welding travel speed were set as 4 Hz and 60 cm/min, respectively. The welding process throughout this work was shielded by pure argon at air flow rate of 20 L/min. The effect of average current (80, 90 and 100 A) was determined by comparing the fusion condition and the formation of welding joints. The current differences between thermal pulse and thermal base at 20, 40 and 60 A were determined under the optimum average current, respectively. After welding, the properties of the T-joint formed at three current differences were observed. The transverse sections taken from the joint beads were ground, polished and etched for the macrophotograph and microstructure analysis.
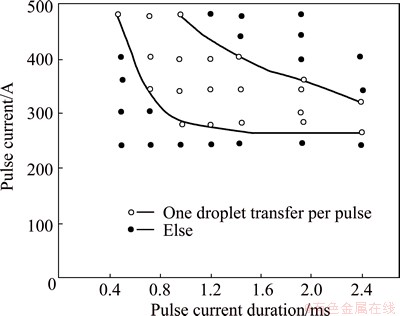
Fig. 2 Relationship between droplet transfer and welding current
2.2 Experimental verification
To confirm the accuracy of the finite element model, both the calculated temperature and the stress fields were verified in the experiment. The time�C temperature curves at specific positions of web near the fusion zone were recorded by K-type thermocouples. Meanwhile, the distribution of the flange residual stress was measured using the blind hole method. The layout of the points that measured is shown in Fig. 3, where the thermocouples were installed at Pints A, B and C and six strain gauges with 1 mm in length were located on the bottom surface of the flange from 1 to 6. To ensure the reproducibility of findings, the measurements were done three times and the mean value was recorded.
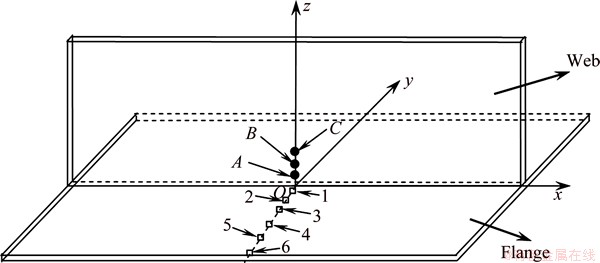
Fig. 3 Schematic diagram of temperature and stress distribution of measuring points
3 Finite element analysis
The 3D mesh model of T-joint was established to simulate the DP-MIG process using the commercial software ABAQUS. As shown in Fig. 4, the model is mostly made up of eight-node brick elements and contains a total of 40200 nodes associated with 28000 elements. A very fine mesh size with an average value of 1 mm is used around the fusion zone. The mesh size gradually increases with increasing the distance from the fusion boundary to guarantee the simulation accuracy and efficiency at the same time. The material suffers from a thermal cycle during the welding process, so the temperature-dependent physical and mechanical properties of the 6061-T6 Al alloy are assigned to the 3D simulation model [8].
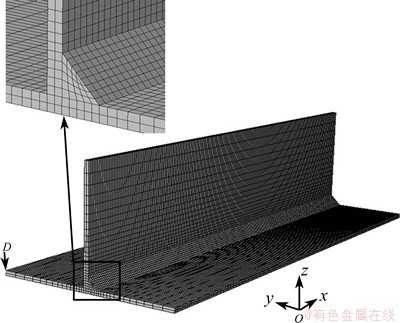
Fig. 4 3D finite element model of T-joint
A sequentially coupled thermo-mechanical analysis approach was adopted in this simulation, where the thermal analysis was performed firstly followed by the mechanical analysis, because the thermal field has a strong influence on the stress field but with little inverse influence [9].
3.1 Heat source and thermal analysis
The choice of heat source model plays a decisive role in the precision of the welding temperature field. The double-ellipsoidal volumetric model proposed by DENG [10] was adopted and the heat source distribution was divided into front and rear ellipsoidals, which can be expressed as follows:

 (1)
(1)
 (2)
(2)
where x, y and z are the coordinates of the double- ellipsoidal volumetric model aligned with the welded T-joint, constants af, ar, b and c are the heat source parameters that can be adjusted to obtain the desired weld pool geometry according to the welding condition, ff and fr are the parameters that give a fraction of heat deposited in the front and rear parts, respectively. For the MIG welding process, ff and fr are assumed to be 1.4 and 0.6, respectively. In addition, Q is the heat input of the welding heat source which can be expressed as:
Q=��UI (3)
where U is the arc voltage, I is the welding current and �� is the thermal efficiency that is assumed to be 80% for the MIG welding.
During the process of DP-MIG, the heat input Q is controlled both by high- and low-frequency pulse. As the high frequency reaches up to 250 Hz, resulting in the quick alternation of peak current and base current, the heat input dominated by the high frequency can be described with an average value. Therefore, the heat input Q of DP-MIG can be simplified as the change between thermal pulse and thermal base in the cycle of low-frequency pulse.
The upper face of the web and the bottom face of the flange are in contact with the stainless fixture, so a large amount of heat energy is lost because of the thermal contact resistance at the interface of the web and flange, which can be coupled into the effect of heat convection by setting a large convection coefficient as 400 W/(K��m2) [11]. Therefore, the boundary conditions for all heat exchange can be grouped into heat convection and radiation [12] to simplify the simulation process with the temperature-dependent heat transfer convection coefficient on the remaining surfaces, as shown in Fig. 5 [13]. To consider the thermal effects of weld pool solidification, a value of 3.9��105 J/kg was set as the latent heat between the solidus temperature (585 ��C) and liquids temperature (659 ��C).
3.2 Mechanical analysis
Mechanical analysis was carried out using the structural element C3D8R to obtain the stress field of the T-joint. The temperature field calculated in the thermal analysis was used as a predefined field. The displacement boundary condition of node D (shown in Fig. 4) with all freedom constrained was applied to the analysis model to avoid rigid movement of the T-joint during simulation. Moreover, the sliding effect due to expansion and contraction between the T-joint and fixture was taken into account by setting the representative friction coefficient value of 0.57 [14].
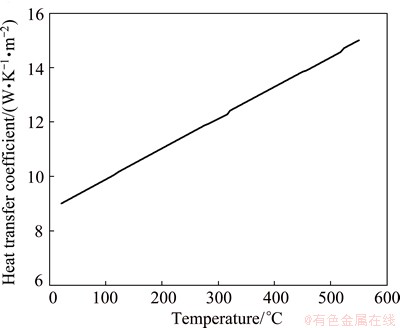
Fig. 5 Relationship between heat transfer coefficient of Al alloy and temperature
In addition, the technique of element birth and death [15] was adopted to simulate the weld filler variation with time in the T-joint fillet welds. The elements of weld filler were preset into the 3D model first and then killed by multiplying the matrix of heat transfer and stiffness with a severe reduction factor. Afterwards, the corresponding elements were reactivated to return the original values with welding process and to simulate the welding wire filling.
4 Results and discussion
4.1 Effect of average current I on morphology and microstructure of T-joint
Average current I as a main parameter in the welding process affects the heat input Q directly, which would further determine the temperature distribution and fusion condition of the welding joint. Figures 6(a), (b) and (c) show the temperature fields and the transverse section of weld pools at average currents of 80, 90 and 100 A, respectively. The corresponding bead width and depth of the T-joints are presented in Table 1. It can be seen that both the temperature and the dimension of weld pools correspondingly increase with the increase of average currents. As the average current increases, the arc heating area of the workpiece is enlarged and the arc force is enhanced, which results in the increase of bead width and depth of T-joints, respectively [16]. In addition, the isotherm corresponding to the melting of the base metal at the DP-MIG current of 90 A is compared with the weld pool shape obtained by the experiment with the same parameters, as shown in Fig. 7, verifying the accuracy of the result by simulation.
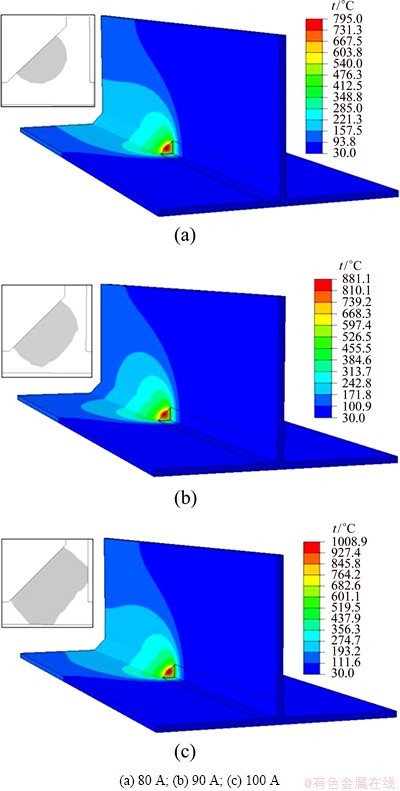
Fig. 6 Temperature distribution and weld pool dimensions at different average currents
Table 1 Bead width and depth at three different average currents
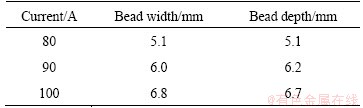
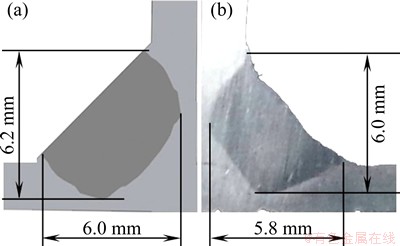
Fig. 7 Simulation (a) and experiment (b) comparison of bead width and depth at average current of 90 A
Combined with the formation of welding joints at various average currents, as shown in Fig. 8, the weld pool dimension at an average current of 90 A is the best when the maximum temperature of the weld pool is almost 200 ��C which is higher than its melting point. The defects occur at other average currents, caused by either excessive or insufficient heat input. When the average current maintains at 80 A, the welding joint is deteriorated and discontinued because of its poor arc stiffness. In addition, the formation of joint between the web and flange is poor with incomplete fusion defects. At the average current of 100 A, the highest temperature of the weld pool is almost 350 ��C which is higher than the melting point, which leads to some collapse. The microstructures of welds are greatly affected by the average currents. Generally, the kinetic energy for growing microstructures increases with increasing the applied current, as shown in Fig. 9. To ensure that the weld fusion case is acceptable, the welding current must be reduced as much as possible.
In conclusion, the optimum average current is 90 A with good formation of T-joint and uniform microstructure.
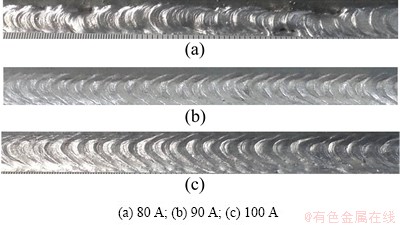
Fig. 8 Welding joints formation at different average currents
4.2 Effect of welding current difference ��I on morphology and microstructure of T-joint
The temperature and stress of weld pools change with the cycle of low-frequency pulse that changes from low frequency to high frequency during the process of DP-MIG. This phenomenon favors the formation of typical rippling appearance on the welding joint, as well as enhances the flow of weld pools to produce a more uniform and finer microstructure [17]. Therefore, the current difference between the thermal pulse and the thermal base possibly plays an important role in DP-MIG. In the present work, the current differences of 20, 40 and 60 A at the optimum average current of 90 A were simulated to investigate the effect of current difference. Figure 10 shows the maximum temperature evolution of the weld pool within a low frequency cycle. Figure 11 exhibits the stress of the transverse section vertical to the weld line during the period of thermal pulse and thermal base at three current differences.
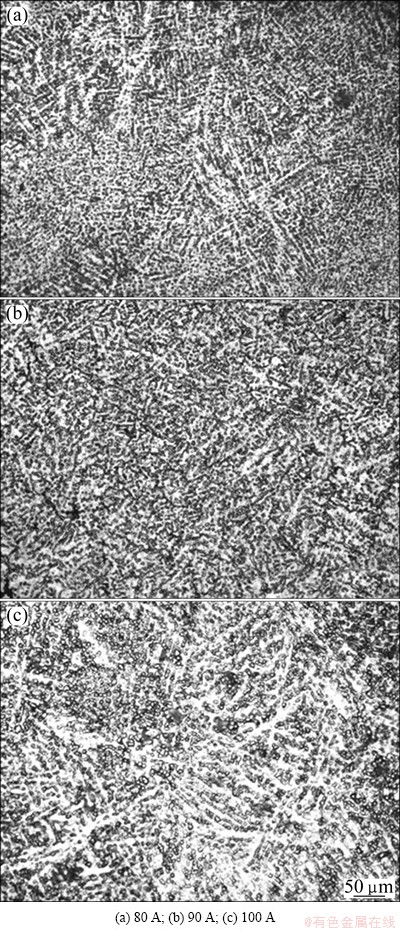
Fig. 9 Microstructures of welding joints at different currents
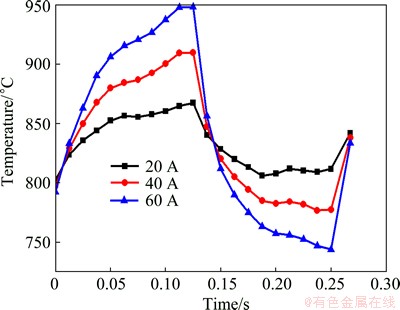
Fig. 10 Maximum temperature evolution of weld pool in low frequency cycle
Clearly, both the maximum temperature and stress of the weld pool are higher in thermal pulse stage as a result of larger amount of heat input and arc force in contrast with those in the thermal base. Furthermore, the differences of temperature and stress between the two stages become larger with the increment of current differences.
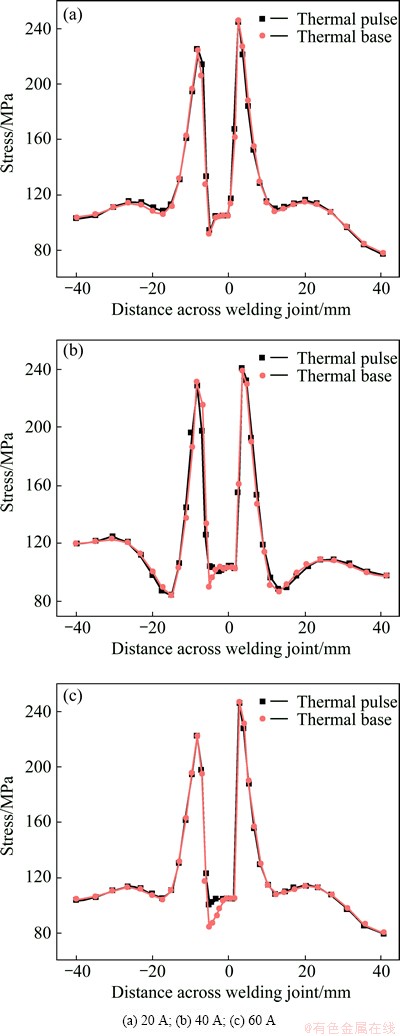
Fig. 11 Weld pool stress between thermal pulse and thermal base at different current differences
As previously reported, the temperature difference during thermal pulse and thermal base directly influences the appearance and quality of welding joints. The appearances of the welding joints at three current differences are shown in Fig. 12. A clear and smooth fish-scale-like appearance of welding joint is achieved at the current difference of 40 A, whereas at the remaining current differences, the welding joints are sparse and resemble rigid fish scales. The surface of welding joint at the current difference of 60 A is porous, mainly caused by its larger temperature difference of about 200 ��C (Fig. 12). The excessive temperature difference leads to a fast and large temperature decrease from thermal pulse to thermal base, resulting in quick reduction in the gas solubility and rapid solidification, both of which obstruct the gas release action and lead to gas deposited in the weld pool [18].
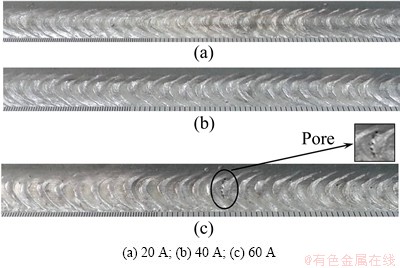
Fig. 12 Formation of welding joints at different current differences
The stress difference of weld pools between the thermal pulse and thermal base during welding not only improves the uniformity of alloy element distribution, but also disturbs the coarse columnar grains into small grains by the stirring effect on the weld pools, both of which influence the micro-morphology of the welding joint and promote the heterogeneous nucleation in the solidification process of weld pools [19]. Generally, the higher the stress difference is, the more uniform and finer the microstructure attained on the welding joint is. The microstructure at the current difference of 20 A with the smallest stress difference is made up of coarse branch crystals (Fig. 13(a)). When the current difference increases to 40 A, the microstructure of the weld pool becomes more uniform and finer, possibly due to increasing the stress difference to 10 MPa. However, the microstructure at the current difference of 40 A is close to that at the current difference of 60 A, although the stress difference increases from 10 to 20 MPa.
From the results of simulation and experiment, the welding joint at current difference of 40 A with the temperature difference of 100 ��C and stress difference of 10 MPa between thermal pulse and thermal base gains the best joint quality, with smooth fish-scale appearance and uniform microstructure.
4.3 Simulation verification
The simulated results of temperature-time curves and longitudinal residual stress distribution were verified by comparison with experiment using the optimum average current of 90 A and current difference of 40 A, as shown in Fig. 14. Points A, B and C are shown in Fig. 3. The result of simulation agrees well with the experimental data, but the residual stress measured by experiment, especially away from the fusion zone, is generally higher than the simulation value, which can be mainly attributed to the inevitable stress caused in the processing technology [20]. Nevertheless, the overall comparison results are good enough to verify the precision of temperature and stress fields obtained by finite element simulation in DP-MIG.
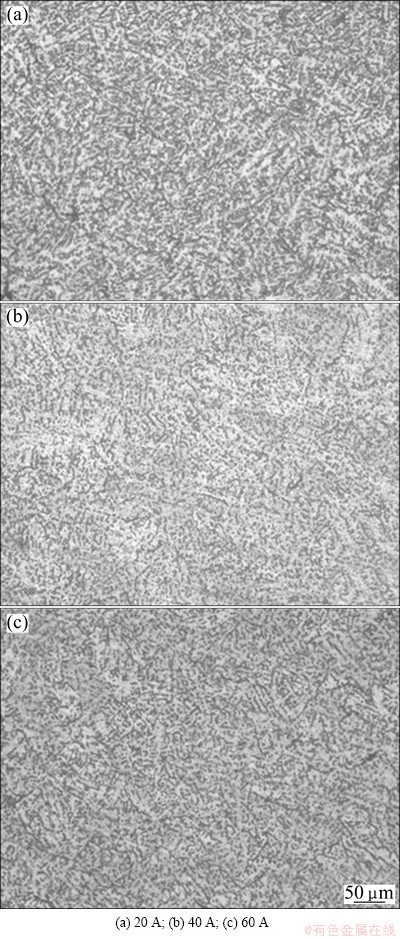
Fig. 13 Microstructures of welding joints at different current differences
5 Conclusions
1) The welding bead width and depth of the T-joint increase with increasing the average current. According to the results of simulation and experiment, the formation and quality of welding joint obtained at the average current of 90 A is the best due to its proper fusion condition.
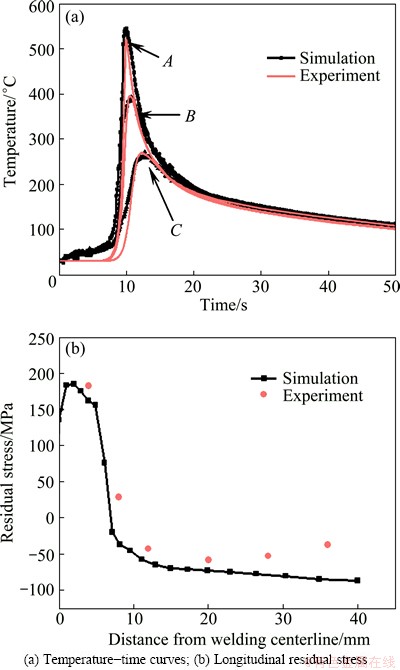
Fig. 14 Comparison of experiment measurements and simulation results
2) As the current difference increases, the differences of weld pool temperature and stress between thermal pulse and thermal base increase accordingly. At the current difference of 40 A with temperature difference of 100 ��C and stress difference of 10 MPa, a high-quality welding joint with a smooth fish-scale appearance and uniform microstructure is obtained.
3) The simulated results of temperature-time curves and residual stress distribution are in good agreement with the experimental measurements.
References
[1] HUANG H Y. Effects of activating flux on the welded joint characteristics in gas metal arc welding [J]. Materials and Design, 2010, 31(5): 2488-2495.
[2] PIRES I, QUINTINO L, MIRANDA R M. Analysis of the influence of shielding gas mixtures on the gas metal arc welding metal transfer modes and fume formation rate [J]. Materials and Design, 2007, 28(5): 1623-1631.
[3] MENDES D, SILVA C L. Evaluation of the thermal pulsation technique in aluminum welding [D]. Minas Gerais, Brazil: Portuguese Federal University of Uberlandia, 2003.
[4] SILVA C L M, SCOTTI A. Performance assessment of the varestraint tests for determining solidification cracking susceptibility when using welding processes with filler metal [J]. Measurement Science and Technology, 2004, 15(10): 2215-2223.
[5] SILVA C L M, SCOTTI A. The influence of double pulse on porosity formation in aluminum GMAW [J]. Journal of Materials Processing Technology, 2006, 171: 366-372.
[6] LIU A, TANG X, LU F. Study on welding process and prosperities of AA5754 Al-alloy welded by double pulsed gas metal arc welding [J]. Materials and Design, 2013, 50: 149-155.
[7] TONG H J, TOMOYUKE U. Features of low frequency modulated type pulsed MIG welding process [J]. Welding and Joining, 2001, 11: 33-35.
[8] MORAITIS G A, LABEAS G N. Residual stress and distortion calculation of laser beam welding for aluminum lap joints [J]. Journal of Materials Processing Technology, 2008, 198(1): 260-269.
[9] YAN D Y, WU A P, SILVANUS J, SHI Q Y. Predicting residual distortion of aluminum alloy stiffened sheet after friction stir welding by numerical simulation [J]. Materials and Design, 2011, 32: 2284-2291.
[10] DENG D, MURAKAWA H. Numerical simulation of temperature field and residual stress in multi-pass welds in stainless steel pipe and comparison with experimental measurements [J]. Computational Materials Science, 2006, 37(3): 269-277.
[11] ZHANG Jian-qiang, ZHANG Guo-dong, ZHAO Hai-yan, YUE Hong-jie, ZHANG Hai-quan, LU An-li. 3D-FEM numerical simulation of welding stress in thin aluminum alloy plate [J]. Transactions of Nonferrous Metals Society of China, 2007, 28(6): 5-9.
[12] SHANMUGAM N S, BUVANASHEKARAN G, SANKARANARAYANASAMY K, KUMAR S R. A transient finite element simulation of the temperature and bead profiles of T-joint laser welds [J]. Materials and Design, 2010, 31: 4528-4542.
[13] BIKASS S, ANDERSSON B, PILIPENKO A, LANGTANGEN H P. Simulation of initial cooling rate effect on the extrudate distortion in the aluminum extrusion process [J]. Applied Thermal Engineering, 2012, 40: 326-336.
[14] CHEN M, JIANG Y, WU C. Effect of welding current waveforms on metal transfer and weld geometry in controlled short circuiting transfer GMAW [J]. Journal of Mechanical Engineering, 2014, 50(4): 87-91.
[15] JIANG W C, GONG J M, TANG J Q, CHEN H, TU S T. 3-D finite element analysis of the effect of welding residual stress on dydrogen diffusion in dydrogen contained environment [J]. Acta Metallurgica Sinica, 2007, 5(20): 347-354.
[16] ZAIN M, NELIAS D, JULLIEN J F, DELOISON D. Prediction of laser beam welding-induced distortions and residual stresses by numerical simulation for aeronautic application [J]. Journal of Materials Processing Technology, 2009, 209: 2907-2917.
[17] CAO Shu-fen, CHEN Tie-ping, YI Jie, GUO Peng-cheng, LI Luo-xing. Simulation of temperature, stress and deformation during double pulsed MIG welding of aluminum alloy [J]. Transactions of Nonferrous Metals Society of China, 2014, 24(7): 1685-1692.
[18] CHEN Y, MIAO Y, LI L, WU L. Joint performance of laser-TIG double-side welded 5A06 aluminum alloy [J]. Transactions of Nonferrous Metals Society of China, 2009, 19(1): 26-31.
[19] YANG C G, GUO X M, HONG Z F, QIAN B N. Effect of electromagnetical stirring on the structure and mechanical properties of weld metal of 2219Al-Cu alloy [J]. Acta Metallurgica Sinica, 2005, 41(10): 1077-1081. (in Chinese)
[20] FU Ding-fa, ZHOU Chang-qing, LI Can, WANG Guan, LI Luo-xing. Effect of welding sequence on residual stress in thin-walled octagonal pipe�Cplate structure [J]. Transactions of Nonferrous Metals Society of China, 2014, 24(3): 657-664.
���ӵ�����˫����MIG�����Ͻ�T�ͽ�ͷ��ò������֯��Ӱ��
�� �ܣ�����ң������ǣ������̣�������
���ϴ�ѧ ���������Ƚ������������ص�ʵ���ң���ɳ 410082
ժ Ҫ��ͨ��ģ���ʵ���о�������T�ͽ�ͷ���Ͻ�˫����������屣��(MIG)����Ӱ�졣ͨ��������ά����Ԫģ�ͺ�˫����ģ����ģ�ⲻͬ���������µ��¶ȳ���Ӧ���������⣬��ͨ��ʵ�����Ӧ�����ºϽ�ĺ�ۺ�����ò���й۲졣������������ź�������Ϊƽ������Ϊ90 A����ǿ�����������ֵΪ40 A����ʱ�۳�����¶ȱ��۵��200 ��C����ǿ����κ���������¶Ȳ��Ӧ����ֵ�ֱ�Ϊ100 ��C��10 MPaʱ�����������ۺϽϺõ����Ͻ�T�ͽ�ͷ����ƽ����������״��������õ�����֯�����⣬ʵ���ģ��õ����¶����ߺ�Ӧ���ֲ������ǺϽϺã���֤�˺���ģ���ȷ�ԡ�
�ؼ��ʣ�˫����MIG�������Ͻ�T�ͽ�ͷ�����ӵ�����Ӧ��
(Edited by Mu-lan QIN)
Foundation item: Project (51475156) supported by the National Natural Science Foundation of China
Corresponding author: Luo-xing LI; Tel: +86-731-88821571; E-mail: llxly2000@163.com
DOI: 10.1016/S1003-6326(15)63953-X

