Trans. Nonferrous Met. Soc. China 22(2012) s261-s267
Residual stress field induced by shot peening based on random-shots for 7075 aluminum alloy
SHENG Xiang-fei1, XIA Qin-xiang1, CHENG Xiu-quan2, LIN Lie-shu2
1. School of Mechanical and Automotive Engineering, South China University of Technology, Guangzhou 510640, China;
2. Department of Aircraft Maintenance Engineering, Guangzhou Civil Aviation College, Guangzhou 510403, China
Received 28 August 2012; accepted 25 October 2012
Abstract: High-strength 7075-T651 aluminum alloy was selected as the research object, and the random-shots FE model was developed; the influences of shots number and spatial location on residual stress field (RSF) were discussed; the influence of analysis step time (AST) on the stability of RSF was analyzed, and the influences of coverage rate and surface roughness of component on the distribution of RSF were investigated. The results indicate that the generated RSF is seriously affected by subsequent shots number and location; RSF tends to be stable when AST adds to 0.075 ms for 45 shots FE model, and the AST values of 15, 25, 65 and 85 shots FE model are 0.065, 0.0683, 0.0817 and 0.0883 ms respectively. For shot peening with different coverage rates, ��srs and ��mcrs increase with the variation of shots number from 15 to 65, then decrease when shots number is 85, variation of Zm is not obvious, Z0 increases with the increment of shots number. For shot peening of component with different surface roughness Ra, variation of ��srs has no obvious regularity, and ��mcrs, Zm and Z0 decrease with the increment of Ra.
Key words: 7075 aluminum alloy; shot peening; random-shots FE model; residual stress field
1 Introduction
Shot peening process is accomplished by bombarding the surface of a metallic component with shots stream at a high velocity, each shot acts as a tiny peening hammer, and then an indentation surrounded by a plastic region is created during this impact. The plastic deformation produced by shot peening leads to a residual stress profile through the depth of the component. This residual stress profile is compressive on the top surface and tensile in the depth of the component in order to ensure inner stress equilibrium [1,2], and the fatigue strength of the peened component will be dramatically improved under the working of residual compressive stress. Shot peening as one of mechanical surface treatment methods has been widely used in aircraft industry [3,4].
RSF induced by shot peening is one of the major strengthening mechanisms of the peened component, and it works mainly depending on the residual compressive stress layer which can stop and postpone the initiation and propagation of the crack [5]. BENEDETTI et al [6] reported that, due to the surface compressive residual stress, the crack initiation site may move from the surface to the interior of the sample or even into the tensile residual stress region beneath the surface hardened layer. MAJZOOBI et al [7] investigated the effect of shot peening and deep rolling on fretting fatigue life of 7075-T6, aluminum alloy and found that for low cycle fatigue, shot peening is superior to deep rolling, which can increase the fretting fatigue life by 300% for the tested specimens.
With the rapid development of the finite element (FE) method and computing power, various shot peening FE models for research of RSF were developed. MEGUID et al [8] developed a periodic symmetry cell with a square contact surface, by which the effects of peening intensity can be predicted and coverage upon the RSF and the plastic zone development for different classes of materials can be mechanically induced. MAJZOOBI et al [9] developed multiple shots impact FE model (4, 6, 8, 9, 13, 25) with regular array, and investigated the effects of velocity and peening coverage on RSF. TAEHYUNG et al [10] presented a 3D multi-impact FE model for evaluation of peening residual stress, and the equi-biaxial stress was successfully extracted from the simulation of diverse single-cycle and multi-cycle impacts. Nevertheless, these FE models are different from the real shot peening process because of the randomicity of the shots.
Coverage rate is defined as the ratio of the area covered by peening indentations to the total treated surface area. In general, coverage rate is difficult to discriminate as 100% coverage, thus, 98% surface coverage is usually considered full coverage [11]. At present, most of studies about coverage rate are based on visual inspection and theoretical model. KIRK [12] discussed the theory of coverage rate for random indentations, and obtained a simplified formula shown as Eq. (1). MIAO et al [11] proposed a method based on numerical simulation for calculating coverage rate. Nevertheless, for visual inspection, a greater artificial deviation is existing; for Eq.(1), the determination of R is difficult; for the method proposed by MIAO, the influence of unpeened area (with larger equivalent strain) on the calculation results of coverage rate is ignored.
 (1)
(1)
where Cth(t) is the theoretical calculated coverage rate,  is the average radius of the indentations, R is the rate of creation of impact (number of impacts per unit area per unit time) and t is the peening time.
In this work, the random-shots FE model which is closer to shot peening process is used to investigate the distribution of RSF, and a method by combining python program with numerical simulation is used for calculating coverage rate. Due to the fact that the stress (which is vertical to the depth direction) plays a leading role in improving the fatigue strength, all the stress values studied in this work refer to the stress along x-direction ��x (positive sign means tensile stress; negative sign means compressive stress).
2 3D random-shots FE model
During the shot peening process, numerous shots impact component surface at random locations. In order to simulate these randomly distributed shots, a 3D random-shots FE model is generated by using python program combined with Abaqus/Explicit. Figures 1 and 2 show the program implementation frame and 3D random-shots FE model.

Fig. 1 Program implementation frame
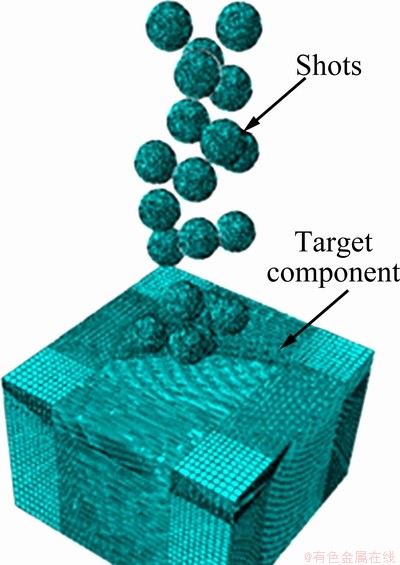
Fig. 2 3D random-shots FE model
2.1 Geometrical model
The dimensions of target component of the model are 1.5 mm��1.5 mm��1 mm. D=0.2 mm is the diameter of shot. The type of element is 8_node reduced integration element C3D8R. HAN et al [13] reported that the mesh size of the region which produces large plastic deformation should be smaller than 1/10 of the shot diameter. Thereby, the mesh of the region which directly contacts with shots is refined, element size is 0.0154 mm, and mesh size of the region far from the impact region is relatively bigger, and the total number of elements is 176400. Penalty contact algorithm is used to describe the relationship between shots and component, and friction coefficient is 0.03. In this model, the type of shots is glass bead, which is regarded as rigid body during numerical simulation process.
2.2 Material model
Material physic properties of shots and component are shown in Table 1. Component material is high- strength 7075-T651 aluminum alloy, and Johnson- Cook constitutive model (Eq. (2)) which considers the effect of strain hardening, strain rate hardening and temperature on stress-strain relation is used, due to the fact that severe plastic deformation occurs on surface layer of material in shot peening process [14].
 (2)
(2)
where �� is the von Mises flow stress; A is the yield stress at reference temperature and reference strain rate; B is the coefficient of strain hardening; n is the strain hardening exponent; �� is the equivalent plastic strain;  is the dimensionless strain rate for
  =1.0 s-1; T*=
 is the homologous temperature. The Johnson-Cook model constants of high-strength 7075-T651 aluminum alloy are listed in Table 2, which were obtained by a split Hopkinson bar experiment.
Table 1 Mechanic properties of shots and component

Table 2 Material constants of Johnson-Cook model

3 3D random-shots FE model validation
To verify the reliability of FEM in this work, a series of numerical simulations were carried out according to the experimental condition in Ref. [15]. The material of target component used in Ref. [15] was TC18 titanium alloy, the type of shot was glass bead, shot diameter was 0.2 mm, shot peening strength was 0.2 N, and coverage rate of surface was approximately 200%. The simulational and experimental results of the characteristic parameters of RSF along the depth direction are listed in Table 3. It shows that simulational results have good agreement with experimental results.
Table 3 Comparison of simulation and experimental results

4 Results and discussion
A typical profile of residual stress along the depth induced by shot peening is shown in Fig. 3. It has four main characteristic parameters: 1) ��srs is surface residual stress; 2) ��mcrs is the maximum compressive residual stress; 3) Z0 is depth at which residual stress becomes zero and after which residual stress is tensile; 4) Zm is distance from surface, where the compressive residual stress is maximum.

Fig. 3 Typical profile of RSF induced by shot peening
4.1 Influence of shots number and location on RSF
In Fig. 4(a), the variation trend of RSF of point P located at indentation center along depth direction is described (shot diameter is 0.2 mm, impact velocity is 175 m/s, impact angle is 90��). Curve I indicates the RSF induced by impact of single shot (as shown in Fig. 4(b)), curve II indicates the RSF induced by impact of three shots distributed along z direction (as shown in Fig. 4(c)), and curve III indicates the RSF induced by impact of seven shots distributed on the surface of component (xOy plane) (as shown in Fig. 4(d)). For three shots FE model, ��srs and Z0 increase, ��mcrs decreases, and variation of Zm is not obvious, compared with single shot; for seven shots FE model, ��srs and ��mcrs decrease seriously, Zm and Z0 increase, compared with the above two cases.
The variations of ��srs, ��mcrs, Zm and Z0 in above three cases can be explained as follows: the process of shots impacting target component can be comprehended as energy conversion from shots to component (the kinetic energy of shots converts to the elastic and plastic deformation energy of the materials located in surface layer of component) and from component to shots (the elastic energy of component converts to the kinetic energy of shots). For case 2, the severer plastic deformation is produced in surface layer, and the larger strain gradient is formed along depth direction, therefore, the ��srs can increase. In addition, three overlying energy-waves lead to the increment of total energy which works on the same location, the depth affected by shots increases accordingly. However, ��mcrs and Zm are affected by repeating stress-waves and stress relaxation, and are competitive with each other. For case 3, deformed materials in region A after impact of single shot located at the first layer have the movement trend along +z direction under the extrusion working from the stress waves induced by impact of six shots located at the second layer, which can lead to stress redistribution and relaxation of ��srs and ��mcrs induced by impact of single shot located at the first layer. The materials located at region B have the movement trend along �Cz direction, which can lead to the increment of Zm and Z0, as shown in Fig. 5.
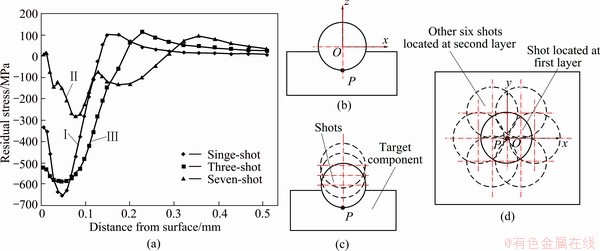
Fig. 4 Variation trend of residual stress under impact of different shots number (a) and location (b), (c) and (d)
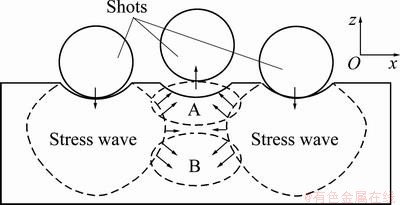
Fig. 5 Stress wave transmission
4.2 Influence of analysis step time (AST) on RSF stability
During the numerical simulation of shot peening, the main problem with the use of explicit techniques is that the analysis is purely dynamic, once the shot rebound separated from the plate and the plastic deformation phenomena have ended, the stress in the plate will oscillate around an average value. For AST, if which is smaller than reasonable value, due to the elastic recover of the materials far from the indentation, RSF fluctuates at high amplitude. On the contrary, if which is larger than reasonable value, computation efficiency will be affected significantly. In this work, 45 shots random FE model (shot diameter is 0.2 mm, impact velocity is 175 m/s, impact angle is 90��) was used to investigate the variation of surface residual stress after shots impact and far away from target component surface. Figure 6 shows that the surface residual stress fluctuates when AST increases from 0.025 ms to 0.15 ms; however, the fluctuation tends to be gentle when AST increases from 0.075 ms to 0.15 ms, the stress increment ����=27 MPa is less than 10% of the stress value at point C when the time doubles. Therefore, AST=0.075 ms can be considered reasonable value for 45 shots FE model. In addition, due to the contact time of shots and component is approximately 0.015 ms, thereby, the stable time of surface residual stress is 0.06 ms (0.075-0.015 ms). Based on this result, the AST values of 15, 25, 65 and 85 shots FE model are 0.065, 0.0683, 0.0817 and 0.0883 ms, respectively.
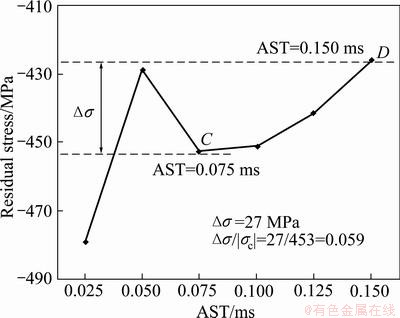
Fig. 6 Variation trend of average value of surface residual stress ��srs for 45 shots-random FE model

Fig. 7 Equivalent strain and z-directional displacement along Path 1
4.3 Influence of coverage rate on RSF
For simplifying the calculation of coverage rate, the assumption of circular indentations with constant size after each shot impact in random-shots FE model was used. Figure 7(a) shows z-directional displacement after single shot impact (shot diameter is 0.2 mm, velocity is 175 m/s, and the impact angle is 90��), three regions with different z-directional displacements are formed: the materials located in region E move along +z direction under the combined working between shot and the materials around indentation, the materials located in region F move along -z direction, due to the direct impact of shot, and point G with null displacement is transition region (+displacement converts to -displacement). And the diameter of circle which passes point G can be considered the diameter of indentation (D1) formed by random-shots. Figure 7(c) shows that D1 is 0.133 mm (0.193-0.06 mm), and the equivalent strain of point G is 0.38. For the random-shots FE model, the dimensions of peened area are 0.4 mm��0.4 mm, and the required number of shots with 100% coverage can be obtained by using the coverage rate calculation program developed by author, and the results are shown in Table 4.
Table 4 Coverage rate calculated by using python program
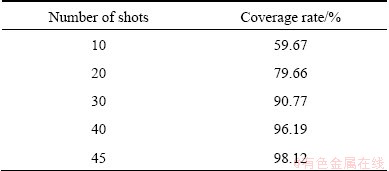
Figure 8 shows the equivalent strain distribution of the surface nodes located in peened area after 45 shots impact, and data of 546 nodes are extracted, and the number of the nodes n with equivalent strain is larger than the point G, is 545, and the ratio of n to 546 is 99.8%. Therefore, it indicates that the full coverage has obtained after 45 shots impact, and has a good agreement with the result obtained by python program.
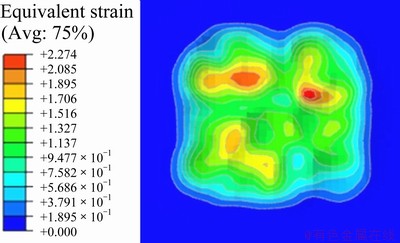
Fig. 8 Equivalent strain produced by 45 shots FE model
Figure 9(a) shows the variation trend of residual stress (average value of the residual stress on path 375) along the thickness direction for 15, 25, 45, 65, 85 shots (shot diameter is 0.2 mm, shot velocity is 175 m/s and impact angle is 90��). In Fig. 9(a), ��srs and ��mcrs increase with the increment of shots number from 15 to 65, and there is change of larger amplification when the coverage rate reaches full coverage, here, a better RSF has been obtained, subsequently, the variation tends to be gentle, ��srs and ��mcrs decrease when shots number adds to 85; variation of zm is not obvious; Z0 increases with the increment of shots number.
During the shot peening process, shots stream impacts the surface layer of component constantly, and leads to the cyclic elastic-plastic deformation of surface materials. In the initial stage of shot peening, the surface material of component is periodically softened or hardened, and part of materials softened may be hardened again with the increment of coverage rate (or peening time), while the hardening of the surface materials is gradually stable, especially, when peening time reaches saturation (or 100% coverage), where, ��srs and ��mcrs increase. However, if the coverage rate keeps growing, the surface roughness of peened area increases, which can lead to the increment of stress concentration factor, as shown in Fig. 9(b). When the number of shots reaches 85, tensile stress appears on the surface of component.
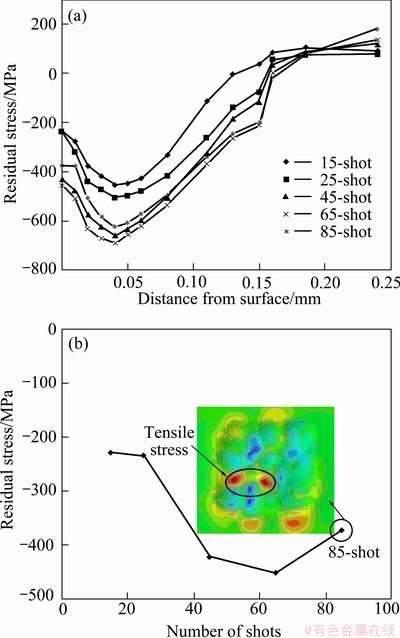
Fig. 9 Variation trend of residual stress along thickness direction for different shots number
4.4 Influence of surface roughness of component on RSF
In this work, the influence of different surface roughness of component before shot peening on RSF was investigated (shots number is 65, shot diameter is 0.2 mm, velocity is 175 m/s and impact angle is 90��), and the geometric model of four different surface roughnesses (Ra=0, 1, 2, 3 ��m) was built by using Object-ARX (as shown in Fig. 10).
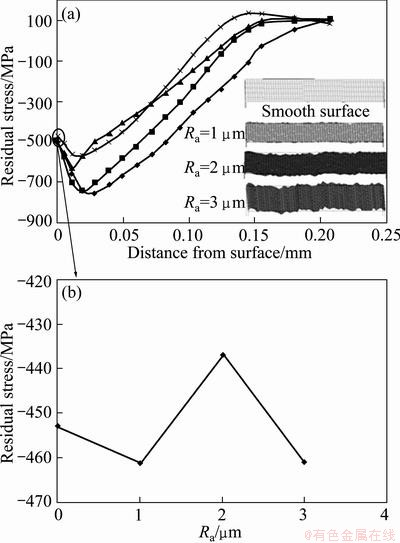
Fig. 10 Variation trend of residual stress along thickness direction for different surface roughnesses of component
Figure 10 shows the variation trend of average value of the residual stress on path 375 along thickness direction. The results show that the variation of ��srs has no obvious regularity, ��mcrs, Zm and Z0 increase with the decrement of surface roughness of component.
For ideal smooth surface, the Ra of peened area after shot peening increases. For the surface with Ra=1, part of convex materials is flattened by the impact of shots (as shown in Fig. 11), and the Ra of peened area may decrease, even smaller than that of the peened area of smooth surface. For the surface with Ra=2, the influence of original surface roughness on peened area roughness is superior to flattening, and ��srs decreases compared with the case of Ra=1. For the surface with Ra=3, larger elastic and plastic deformation occur on the surface of the component due to the larger convex material (region H) (as shown in Fig. 11), while larger surface roughness can induce larger stress concentration factor as reported by [16]. Hence, the ��srs is affected by two factors which are competitive with each other, here, the influence of larger elastic and plastic deformation on ��srs is superior to larger stress concentration factor.

Fig. 11 Shot peening process with larger surface roughness
5 Conclusions
1) The random-shots FE model was successfully developed, and has a higher reliability for shot peening numerical simulation of metallic materials.
2) Shots number and location have significant influences on the distribution of RSF. Hence, the single or multi shots (with regular arrange) FE model has limitations to simulate the real shot peening process.
3) For the 45 random-shots FE model, the RSF tends to be stable when AST adds to 0.075 ms, and the AST values of 15, 25, 65 and 85 shots FE model are 0.065, 0.0683, 0.0817 and 0.0883 ms, respectively.
4) For different coverage rates, ��srs and ��mcrs increase with the variation of shots number from 15 to 65, then decrease when shots number is 85; variation of Zm is not obvious; Z0 increases with the increment of shots number.
5) For different surface roughnesses of component Ra, variation of ��srs has no obvious regularity, ��mcrs, Zm and Z0 decrease with the increment of Ra.
References
[1] MEGUID S A, SHAGAL G, STRANART J C, DALY J. Three-dimensional dynamic finite element analysis of shot-peening induced residual stresses [J]. Finite Elements in Analysis and Design, 1999, l31: 179-191.
[2] HOU L F, WEI Y H, LIU B S, XU B S. Microstructure evolution of AZ91D induced by high energy shot peening [J]. Transactions of Nonferrous Metals Society of China, 2008, 18: 1053-1057.
[3] ZHANG Hong-wei, ZHANG Yi-du, WU Qiong. Numerical simulations of shot-peening process and impact effect [J]. Acta Metallurgica Sinica, 2010, 46(1): 111-117. (in Chinese)
[4]  Z, JANEZ G. Surface integrity of shot peened aluminum alloy 7075-T651 [J]. Journal of Mechnical Engineering, 2011, 57(5): 379-384.
[5] LIU Wen-cai, DONG Jie, ZHANG Ping, ZHAI Chun, DING Wen-jiang. Influence of shot peening on high cycle fatigue properties of ZK60 magnesium alloy [J]. The Chinese Journal of Nonferrous Metals, 2009, 19(10): 1733-1740. (in Chinese)
[6] BENEDETTI M, FONTANARI V, SCARDI P, RICARDO C L A, BANDINI M. Reverse bending fatigue of shot peened 7075-T651 aluminum alloy: The role of residual stress relaxation [J]. International Journal of Fatigue, 2009, 31: 1225-1236.
[7] MAJZOOBI G H, AZADIKHAH K, NEMATI J. The effects of deep rolling and shot peening on fretting fatigue resistance of aluminum- 7075-T6 [J]. Materials Science and Engineering A, 2009, 516: 235-247.
[8] MEGUID S A, SHAGAL G, STRANART J C. 3D FE analysis of peening of strain-rate sensitive materials using multiple impact model [J]. International Journal of Impact Engineering, 2002, 27: 119-134.
[9] MAJZOOBI G H, AZIZI R, ALAVI N A. A three-dimensional simulation of shot peening process using multiple shot impacts [J]. Journal of Materials Processing Technology, 2005, 164-165: 1226-1234.
[10] TAEHYUNG K, HYUNGYIL L, JUNG S, LEE J H. A 3D FE model with plastic shot for evaluation of equi-biaxial peening residual stress due to multi-impacts [J]. Surface and Coatings Technology, 2012, 206: 3125-3136.
[11] MIAO H Y, LAROSE S, PERRON C,  M. On the potential applications of a 3D random finite element model for the simulation of shot peening [J]. Advances in Engineering Software, 2009, 40: 1023-1038.
[12] KIRK D. Theoretical principles of shot peening coverage [J]. Shot Peener, 2005, 19(2): 24-26.
[13] HAN K, OWEN D R J, PERIC D. Combined finite/discrete element and explicit/implicit simulations of peen forming process [J]. Engineering Computations, 2002, 19(1): 92-118.
[14] QUAN G Z, LIU K W, ZHOU J, CHEN B. Dynamic softening behaviors of 7075 aluminum alloy [J]. Transactions of Nonferrous Metals Society of China, 2009, 19: 537-541.
[15] GAO Yu-kun. Residual compressive stress field in TC18 ultra-high strength titanium alloy by shot peening [J]. Rare Metal Materials and Engineering, 2004, 33(7): 1209-1212.
[16] YAN Wu-zhu, ZHANG Gang, WEN Shi-feng, LIU Jun, YUE Zhu-feng. Effect of surface roughness on evolution of residual stress field induced by shot peening [J]. Materials Science and Technology, 2010, 18(4): 523-527. (in Chinese).
������������7075���Ͻ�����IJ���Ӧ����
ʢ���1, ������1, ����ȫ2, ������2
1. ����������ѧ ��е����������ѧԺ������ 510640��
2. ������ְҵ����ѧԺ �ɻ�ά����ϵ, ���� 510403
ժ Ҫ�������������ģ�ͣ��о��˲�ͬ������Ŀ��λ�á�������ʱ�䡢�����ʼ��вı���ֲڶȶ�7075-T651��ǿ�����Ͻ�����ǿ��������IJ���Ӧ������Ӱ�졣�����������ͬ������Ŀ��λ�öԲ���Ӧ����������Ӱ�죻����45���������ģ�ͣ���������ʱ��Ϊ0.075 msʱ������Ӧ�����ﵽ�ȶ�״̬������15��25��65��85���������ģ�ͣ��ȶ�������ʱ��ֱ�Ϊ0.065��0.0683��0.0817��0.0883 ms����������Ŀ��15���ӵ�65ʱ����srs�ͦ�mcrs�浯����Ŀ����������ӣ���������Ŀ�������ӵ�85ʱ����srs�ͦ�mcrs���ּ�������Zm���ŵ�����Ŀ�����Ӳ�δ���ֳ����Եı仯��Z0���ŵ�����Ŀ��������������ӣ���srs���Űвı���ֲڶȵı仯δ���ֳ����Եı仯���ɣ���mcrs��Zm ��Z0���ű���ֲڶȵ���������ϼ�С��
�ؼ��ʣ�7075���Ͻ�����ǿ�����������ģ�ͣ�����Ӧ����
(Edited by YANG Hua)
Foundation item: Project (61179051) supported by Collaborative Fund of National Natural Science Foundation of China and Civil Aviation Administration of China
Corresponding author: XIA Qin-xiang; Tel: +86-13902233118; E-mail: meqxxia@scut.edu.cn
DOI: 10.1016/S1003-6326(12)61717-8

