具有均匀和双峰晶粒尺寸分布的电沉积镍的腐蚀行为
来源期刊:中国有色金属学报(英文版)2019年第2期
论文作者:杨峰 张晓峰 杨虹 刘亦农 郝世杰 崔立山
文章页码:424 - 436
关键词:腐蚀行为;电沉积镍;双峰晶粒;孪晶;晶粒尺寸
Key words:corrosion behavior; electrodeposited Ni; bimodal grain; twin; grain size
摘 要:研究具有均匀和双峰晶粒分布电沉积镍的腐蚀行为。利用SEM、EBSD、TEM和XRD研究样品的显微组织,利用动电位测试法和电化学阻抗谱研究样品的腐蚀行为。结果表明:电沉积纳米晶镍具有(100)和(111)织构。纳米晶镍经不同温度热处理后,可得到具有不同晶粒尺寸分布的样品。晶粒尺寸对样品腐蚀行为的影响依赖于环境钝化能力。当钝化膜在样品表面形成时,耐蚀性随晶粒尺寸的减小而增强;相反,当样品表面无钝化膜形成时,耐蚀性随晶粒尺寸减小而降低。具有双峰晶粒尺寸分布样品的腐蚀行为遵循混合法则。
Abstract: The corrosion behavior of electrodeposited Ni with normal and bimodal grain size distribution was investigated. The microstructure of samples was researched by SEM, EBSD, TEM and XRD. The corrosion behavior was studied by potentiodynamic tests and electrochemical impedance. Nanocrystalline Ni with (100) and (111) textures was prepared by an electrodeposition method. The Ni samples with different grain size distributions and twins were then obtained by heat treatment of nanocrystalline Ni at different temperatures. The effect of grain size on corrosion behavior of the sample depends on the ability of the environment to passivate. In the case where passive film forms on the sample surface, the corrosion resistance of the sample increases with decreasing grain size. Conversely, the corrosion resistance decreases with decreasing grain size when there is no passivation. The corrosion behavior of samples with bimodal grain size distribution obeys the rule of mixture.
Trans. Nonferrous Met. Soc. China 29(2019) 424-436
Feng YANG1,2, Xiao-feng ZHANG1,2, Hong YANG3, Yi-nong LIU3, Shi-jie HAO1,2, Li-shan CUI1,2
1. State Key Laboratory of Heavy Oil Processing, China University of Petroleum-Beijing, Beijing 102249, China;
2. Beijing Key Laboratory of Failure, Corrosion and Protection of Oil/Gas Facility Materials, China University of Petroleum-Beijing, Beijing 102249, China;
3. School of Mechanical and Chemical Engineering, The University of Western Australia, Perth, WA 6009, Australia
Received 23 February 2018; accepted 11 October 2018
Abstract: The corrosion behavior of electrodeposited Ni with normal and bimodal grain size distribution was investigated. The microstructure of samples was researched by SEM, EBSD, TEM and XRD. The corrosion behavior was studied by potentiodynamic tests and electrochemical impedance. Nanocrystalline Ni with (100) and (111) textures was prepared by an electrodeposition method. The Ni samples with different grain size distributions and twins were then obtained by heat treatment of nanocrystalline Ni at different temperatures. The effect of grain size on corrosion behavior of the sample depends on the ability of the environment to passivate. In the case where passive film forms on the sample surface, the corrosion resistance of the sample increases with decreasing grain size. Conversely, the corrosion resistance decreases with decreasing grain size when there is no passivation. The corrosion behavior of samples with bimodal grain size distribution obeys the rule of mixture.
Key words: corrosion behavior; electrodeposited Ni; bimodal grain; twin; grain size
1 Introduction
Electrodeposition method as a typical processing route is used to produce nanocrystalline metallic materials with unprecedented mechanical strength [1-4]. Electrodeposited nanocrystalline Ni has been well studied [5-14], especially on the grain growth behavior during post heat treatment. Generally speaking, heat treatment of nanocrystalline Ni at different temperatures can result in samples with a wide range of grain size distributions from tens of nanometers to tens of microns. Of particular interest is the bimodal grain size distribution observed in a sample subjected to a specific heat treatment regime, in which very large grains (~5-50 μm) form in an otherwise uniform matrix of small grain size of ~500 nm.
The effect of grain size on the corrosion behavior of many nanocrystalline metallic materials has been extensively studied and reported in literatures [15-17]. For example, the corrosion resistance of nanocrystalline Zn in NaOH solution was found to be about 60% higher than that of the coarse grain Zn [18]. A Hall-Petch type relationship between corrosion resistance and grain size was reported for Al in NaCl solution [19], Ni in NaOH solution [20] and nanocrystalline Fe in NaOH solution [21-23]. LUO et al [24] investigated the effect of grain size on corrosion of bulk nanocrystalline copper in NaOH solution. Results showed that grain size variation has little effect on the overall corrosion resistance of copper samples because of duplex passive films. QIN et al [25] found that depending upon the ability of the environment to passivate, materials could experience an increased or decreased corrosion resistance with grain refinement.
The influence of uniform grain size on corrosion behavior is generally concerned. A bimodal grain size microstructure is understood to optimize strength and ductility, thus allowing the development of nanocrystalline materials for structural applications. However, in comparison to the mechanical properties of this kind of materials, the corrosion properties are less understood.
On the other hand, recent studies [26,27] showed that the Ni with a grain size of 50 nm possessed higher corrosion resistance than that with a grain size of 10 nm. This seemly abnormal behavior may be related to the existence of nanoscale twins in the Ni samples and the lower concentration of acceptor in the passive films. The corrosion resistance of the coating linearly changed with the density of twins. It is necessary to research the corrosion behavior of Ni with bimodal microstructure and twin.
In this study, nanocrystalline Ni samples were prepared by an electrodeposition method and sub- sequently the Ni samples with different grain sizes (200 nm-40 μm) and annealed twins were obtained via post heat treatment at different temperatures. The microstructure and grain boundary characteristics of the resulted samples were studied in detail. The corrosion behavior of these Ni samples was investigated in three different solutions (NaOH, NaCl and H2SO4) using potentiodynamic polarization and impedance measure- ment techniques.
2 Experimental
The nanocrystalline Ni sample with a thickness of 0.5 mm was prepared by the electrodepositon method in an electrolyte containing nickel sulfate (0.91 mol/L), nickel chloride (0.19 mol/L), boric acid (0.49 mol/L) and saccharin (3 g/L) as described in Ref. [28]. The direct current was used and the current density is 10 A/dm2. The as-deposited sample is designated as sample A, or A for short. The total impurity content amounts are 319×10-6 S and 38×10-6 C, respectively, as measured by the infrared absorption technique. After deposition, the samples were annealed at 573, 773 and 973 K for 2 h, respectively, and these heat-treated samples were designated as samples B, C and D accordingly, or B, C, and D for short. The crystalline structure of the samples was characterized using a Bruker D8 Focus X-ray diffractometer (XRD). The microstructures of the as-deposited and heat-treated samples were examined using a Leica optical microscope, a FEI Quanta 200F field emission scanning electron microscope (SEM) equipped with an electron backscattered diffraction (EBSD) system, and/or a JEM 2100 transmission electron microscope (TEM). For the EBSD measurement, mechanical polishing with colloidal silica was carried out to remove the residual stress layer for each sample, and the grain orientation map was obtained at a mapping step of 0.1 μm. To ensure the statistical evaluation, approximately 200 grains were analyzed per specimen.
Electrochemical testing was carried out at 25 °C in a classical three-electrode cell using an electrochemistry work station (CHI760E, Chenhua Instrument Ltd., Shanghai, China). The Ni working electrode was made by embedding Ni disk in epoxy resin in a glass tube, polished to the final 0.5 μm alumina powder and then ultrasonically cleaned. The final prepared Ni electrode has an exposed area of 0.785 cm2. The auxiliary and reference electrodes were Pt foil and Ag/AgCl electrode filled with 6 mol/L KOH solution, respectively. The potentiodynamic tests were performed in 10 wt.% NaOH, 3 wt.% NaCl and 0.5 wt.% H2SO4 aqueous solutions at room temperature, respectively. The scanning rates were 10 mV/s for all potentiodynamic tests. The corrosion potential and corrosion current density were then calculated from the intersections of the cathodic and anodic Tafel curves extrapolated from the anodic and cathodic polarization curves. Measurements of electrochemical impedance (EIS) were conducted at the open circuit potential after immersion of a sample into the respective solution for 30 min. The EIS measurement was conducted at an applied potential of 10 mV and a frequency range from 0.01 Hz to 100 kHz.
3 Results
3.1 Microstructure characterization
Figure 1 shows the X-ray diffraction (XRD) pattern of sample A. It can be seen that all observed peaks can be indexed and matched well to the standard diffraction peaks of FCC-Ni, confirming the formation of pure metallic Ni sample. The as-deposited sample also displays a strong (100) texture, which is in good agreement with our previous study [29]. Figures 2(a) and (b) present the bright field and the dark field images of sample A, respectively, revealing the nanocrystalline nature of the as-deposited sample. The inset in Fig. 2(a) shows the corresponding selected area electron diffraction pattern (SADP). The grain size distribution of sample A obtained from image analysis of the dark filed micrograph is shown in Fig. 2(c). It is shown that greater than 60% of nano-grains are in the size range of 20-40 nm in the as-deposited Ni sample.
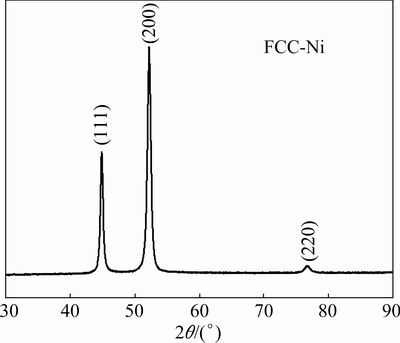
Fig. 1 XRD pattern of sample A
Figure 3(a) shows the SEM image of sample B heat-treated at 573 K. Figure 3(b) shows the EBSD orientation map of sample B, with the inset showing the color coding of orientations. Figure 3(c) shows the grain size distribution of sample B calculated from the EBSD orientation map. Greater than 60% of grains in the sample are of sizes between 200 and 600 nm, in the ultrafine grain range. Figure 3(d) shows the band contrast image with twin boundaries highlighted in yellow, revealing a large population of twins formed in the sample after annealing at 573 K. Ni is a FCC metal, and annealing twins are easy to form during heat treatment because the twin boundary energy is much lower than random high-angle boundary energy. The formation of annealing twins is a very favorable mechanism for reducing the overall grain boundary energy during grain growth [30]. Figures 4(a) and (b) show the (100) and (111) pole figures, respectively, revealing weak (100) and strong (111) textures in sample B.
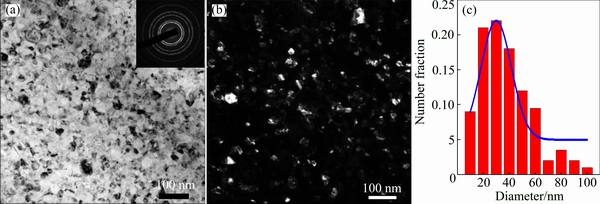
Fig. 2 Bright field TEM image with inset showing corresponding SADP (a), dark field TEM image (b), and grain size distribution (c) of sample A
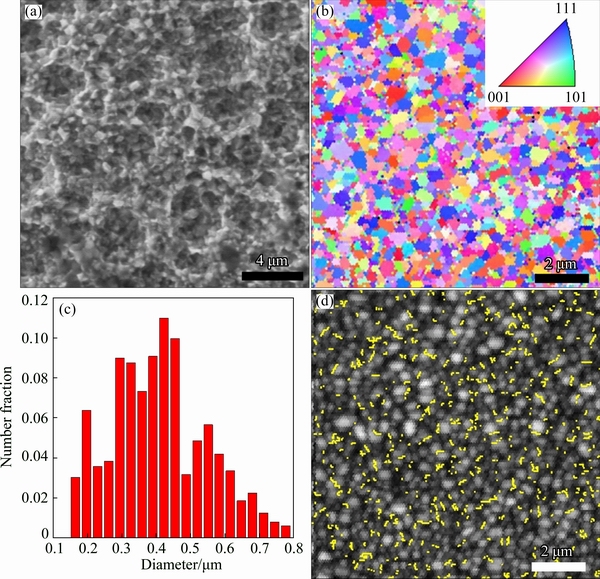
Fig. 3 SEM image (a), EBSD orientation map (inset is color coding of orientations) (b), grain size distribution (c) and band contrast image with twin boundaries highlighted in yellow (d) of sample B
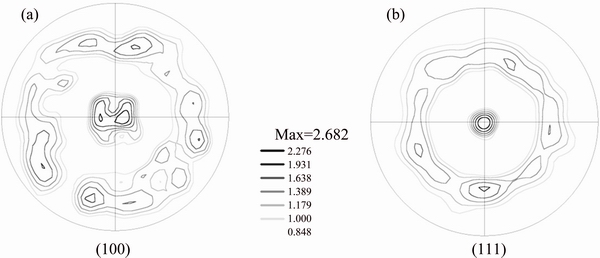
Fig. 4 (100) (a) and (111) (b) pole figures of sample B
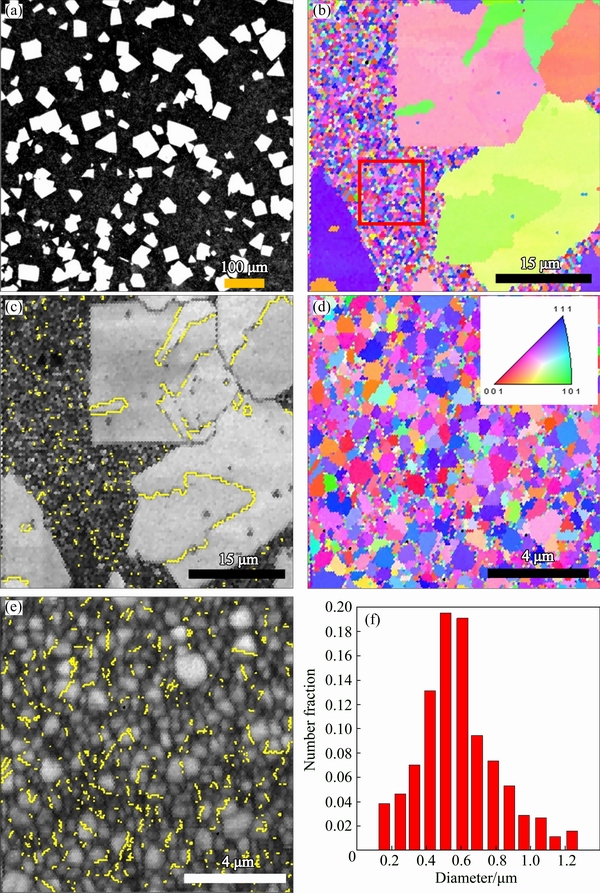
Fig. 5 Optical micrograph (a), EBSD orientation map (b), corresponding band contrast image with twin boundaries highlighted in yellow (c) of sample C; and EBSD orientation map (d), corresponding band contrast image with twin boundaries (e) and grain size distribution (f) of rectangular area marked in (b)
Figure 5(a) shows a typical optical micrograph of sample C, showing a significant population of very large grains of rectangular and triangular profiles. Figure 5(b) shows the EBSD orientation map of the sample and reveals immediately the bimodal grain structure in the sample, where very large grains (~5-50 μm) are distributed in a matrix of much smaller grains of only submicron sizes. The volume fraction of coarse grains is about 35%. Similar bimodal morphology was previously reported [9]. Figure 5(c) shows the band contrast image corresponding to Fig. 5(b) with twin boundaries highlighted in yellow. The large planar grains exhibit a twin orientation relationship upon eventual contact. Figures 5(d-f) show the EBSD orientation map, the corresponding band contrast image, and the grain size distribution, respectively. Figures 6(a) and (b) show the (100) and (111) pole figures of smaller grains in the red square area marked in Fig. 5(b). The results again demonstrate that small grain region of sample C also contains high population of twins, and the grains have the strong (111) texture. The grain size distribution of smaller grains is mostly populated in the range of 200-600 nm.
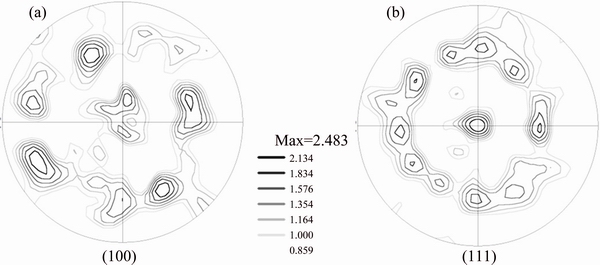
Fig. 6 (100) (a) and (111) (b) pole figures of sample C
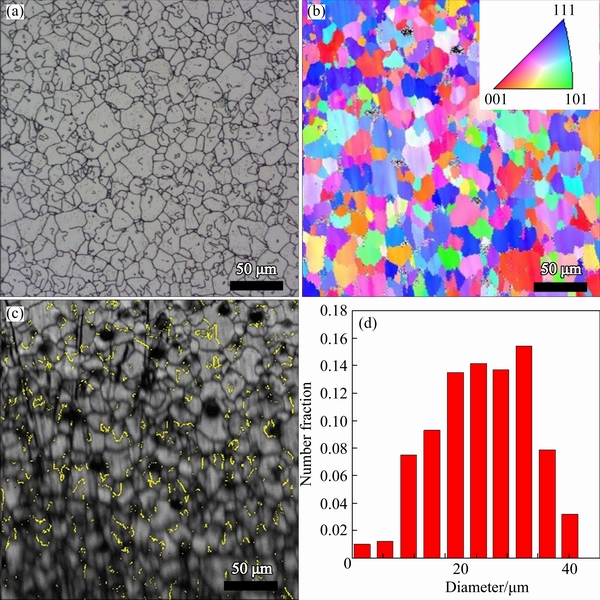
Fig. 7 Optical micrograph (a), EBSD orientation map (b), corresponding band contrast image with twin boundaries (c) and grain size distribution (d) of sample D
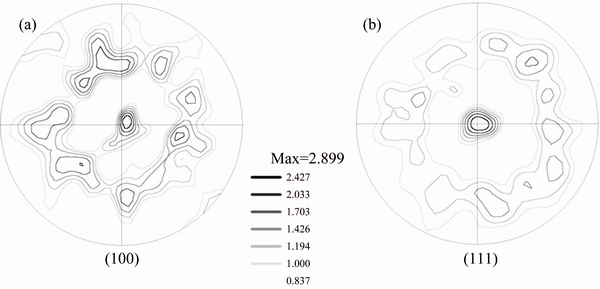
Fig. 8 (100) (a) and (111) (b) pole figures of sample D
Similarly, Fig. 7 shows the optical image, EBSD orientation map, corresponding band contrast image, and grain size distribution of sample D, respectively. Figures 8(a) and (b) show the (100) and (111) pole figures of sample D, respectively. It is observed that at this high heat treatment temperature, differential grain growth has been surpassed and the resulted sample again consists of relatively uniform grain sizes in the range of 5-40 μm. It is again observed that the strong (111) texture is observed, and in addition, high populations of twins exist in the heat-treated sample.
Overall, the heat treatment of the as-deposited nanocrystalline Ni sample has resulted in the Ni samples with different grain size distributions and twins. While increased heat treatment temperature results in increased grain sizes, the original (100) texture is changed into (111) texture in all heat-treated samples and all of them also contain large populations of twins. A lot of twins are formed in samples after heat treatment at different temperatures. Some results [31] suggest that twinning has its own kinetics and can take place independently of grain growth. Once a certain value of twins is established it is not changed by grain growth. We prepared the samples with different grain size distributions and twins, which can be further used to study the corrosion behavior.
3.2 Corrosion behavior of samples in NaOH solution
Figure 9 shows the potentiodynamic polarization curves for as-deposited sample A and heat-treated Ni samples B, C and D in 10 wt.% NaOH solution, respectively. It is immediately apparent that all samples show a typical active-passive-transpassive corrosion behavior, which is related to the formation of Ni(OH)2 passive film according to the previous reports [20,32]. The corresponding electrochemical parameters extracted from the polarization curves are summarized in Table 1. The corrosion potential shifts negatively from -0.35 to -0.55 V and the corrosion current density increases from 0.46 to 3.85 μA/cm2 for samples from A to D. These results indicate that the corrosion resistance of the sample decreases with increasing grain size, which is consistent with reported work [12].
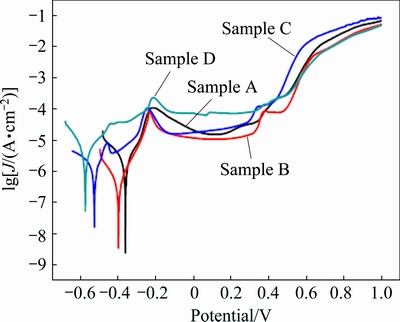
Fig. 9 Potentiodynamic polarization curves for samples A, B, C and D in 10 wt.% NaOH solution at sweep scan rate of 10 mV/s
Table 1 Corrosion potential (φcorr), corrosion current density (Jcorr), passive current density (Jpass) and passive range (△φ) of samples A, B, C and D measured in 10 wt.% NaOH solution
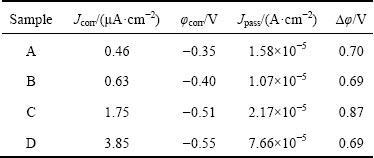
However, the passive behavior is slightly different with that reported in Ref. [12]. The passivation behavior of sample A is similar to that of nanocrystalline grains reported in literatures [25]. Samples B with ultrafine grains and D with microcrystalline grains show obviously passive behavior. No obvious passive behavior occurred for microcrystalline Ni with a grain size of 3 μm and ultrafine Ni with a grain size of 250 nm in Ref. [12]. In our results, the passive current density (10.7 μA/cm2) of sample B with ultrafine grain is lower than that (15.8 μA/cm2) of sample A with a grain size of 30 nm. This indicates that sample B has a high density of nucleation sites for passive films, which leads to high fraction of passive layers, and thus a lower passive current density. In addition, there are two passivation zones in the potentiodynamic polarization curve of sample C, which has the largest passive range (0.87 V). This is related to the microstructures of sample C with bimodal grain size distribution.
Figure 10 shows the Nyquist impedance plots of samples A, B, C and D in 10 wt.% NaOH solution, respectively. At higher frequencies, the Nyquist impedance plot exhibits a semicircle for all samples studied. A Warburg tail is observed at lower frequencies, indicating a diffusion-dominated process. There should exist a Warburg diffusion element reasonably describing the diffusion effect of ions. In addition, the formation of passive film should provide the impedance at the electrolyte/passive film interface. The reactions can be modeled as a double-layer capacitor in parallel with a charge-transfer resistor. The equivalent circuit model describing the observed behavior is shown in the inset of Fig. 10. In the model, Rs, Rct, CPE and W represent the solution resistance, charge-transfer resistance, double- layer capacitance and Warburg diffusion impedance, respectively. The diameter of the semicircle at higher frequencies is reduced sharply with increasing the grain size from samples A to D, indicating that the charge- transfer resistance is reduced with increasing the grain size. The impedance results indicate that the corrosion mechanism is controlled not only by the charge transfer step but also by the diffusion process of the corresponding ions.
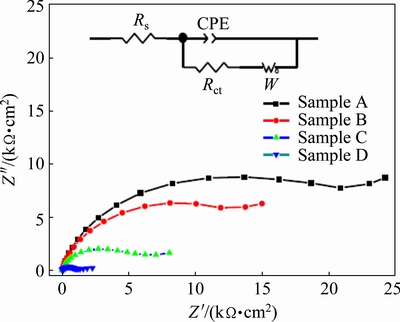
Fig. 10 Nyquist impedance plots of samples A, B, C and D in 10 wt.% NaOH solution (Inset showing equivalent circuit model for corrosion behavior of samples)
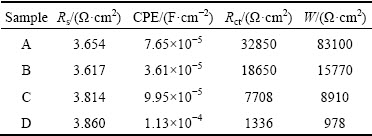
The calculated equivalent circuit parameters are listed in Table 2. Obviously, Rct decreases with increasing the grain size. The decrease of CPE indicates the smoother and more protective nature of passive film is formed on Ni deposits [33]. It is interesting that the CPE of sample B is the smallest, which indicates that the passive film on sample B is the smoothest and most compact. This result is also consistent with that of low passivation current density obtained from the potentio- dynamic measurement for sample B.
Table 2 Equivalent circuit parameters determined by modeling impedance spectra of samples A, B, C and D in 10 wt.% NaOH solution
3.3 Corrosion behavior in NaCl solution
Figure 11 shows the potentiodynamic polarization curves for samples A, B, C and D in 3 wt.% NaCl solution, and the corresponding electrochemical parameters are listed in Table 3. It is also apparent that all samples show a typical active-passive-transpassive corrosion behavior. Similar to that observed in NaOH solution, the corrosion potential of the samples shifts negatively from -0.20 to -0.47 V and the corrosion current density increases from 1.01 to 5.61 μA/cm2 with increasing the grain size in the sample. The corrosion resistance decreases with increasing the grain size.
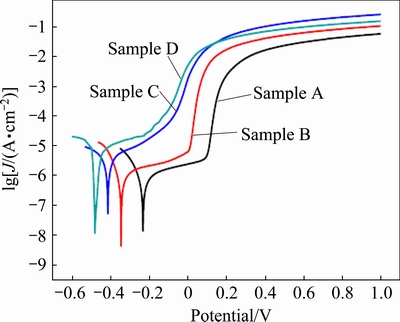
Fig. 11 Potentiodynamic polarization curves for samples A, B, C and D in 3 wt.% NaCl solution at sweep scan rate of 10 mV/s
Figure 12 shows the Nyquist impedance plots for samples A, B, C and D in 3 wt.% NaCl solution. The Nyquist plots of all the Ni samples show only one capacitive loop in the same frequency range as those in NaOH solution. The equivalent-circuit model for the corrosion behavior of Ni samples in NaCl solution is shown in the inset of Fig. 12. The calculated Rs, Rct and CPE values are listed in Table 4. Clearly, in NaCl solution, Rct increases with decreasing the grain size. In other words, the corrosion resistance increases with decreasing the grain size of the sample. The lower CPE value observed for the sample of smaller grain size indicates smoother and more protective nature of the passive film formed on surface of samples. The corrosion resistance increases with decreasing the grain size in NaCl solution.
Table 3 Corrosion potential (φcorr) and corrosion current density (Jcorr) of samples A, B, C and D measured in 3 wt.% NaCl solution
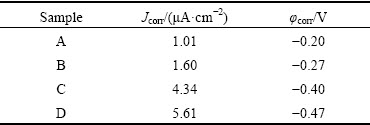
Table 4 Equivalent circuit parameters determined by modeling impedance spectra of samples A, B, C and D in 3 wt.% NaCl solution
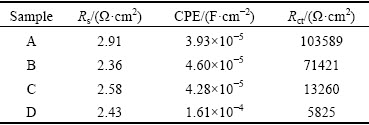
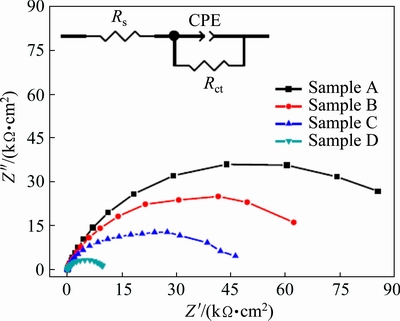
Fig. 12 Nyquist impedance plots of samples A, B, C and D in 3 wt.% NaCl solution (Inset showing equivalent circuit model for corrosion behavior of samples)
3.4 Corrosion behavior in H2SO4 solution
Figure 13 shows the potentiodynamic polarization curves for samples A, B, C and D in 0.5 wt.% H2SO4 solution, with the corresponding electrochemical parameters listed in Table 5. The corrosion behavior is quite different from that in NaOH or NaCl solution as there is no passivation phenomenon. The φcorr shifts positively from -0.39 to -0.15 V, whilst the Jcorr decreases from 31.18 to 15.80 μA/cm2 with increasing the grain size in the sample. It is clear that the smaller the grain size is in the sample, the more the grain boundaries are and the lower the corrosion resistance is, without passivation. This will increase the electrochemical reactivity and accelerate the corrosion of Ni [34].
Table 5 Corrosion potential (φcorr) and corrosion current density (Jcorr) of samples A, B, C and D measured in 0.5 wt.% H2SO4 solution
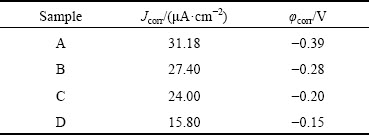
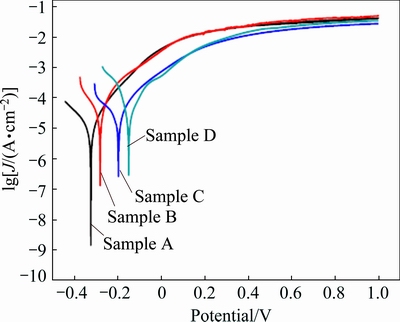
Fig. 13 Potentiodynamic polarization curves for samples A, B, C and D in 0.5 wt.% H2SO4 solution
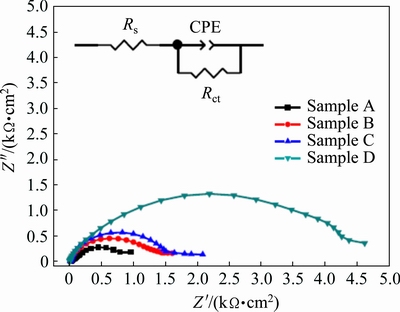
Fig. 14 Nyquist impedance plots of samples A, B, C and D in 0.5 wt.% H2SO4 solution (Inset showing equivalent circuit model for corrosion behavior of samples)
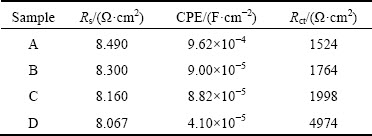
Figure 14 shows the Nyquist impedance plots for samples A, B, C and D, and the equivalent circuit model (the insert) in 0.5 wt.% H2SO4 solution. The calculated Rs, Rct and CPE values are listed in Table 6. Evidently, unlike in the NaOH or NaCl solution, the Rct, thus the corrosion resistance, decreases with decreasing the grain size in the H2SO4 solution.
Table 6 Equivalent circuit parameters determined by modeling impedance spectra of samples A, B, C and D in 0.5 wt.% H2SO4 solution
3.5 Corroded surface
Figure 15 shows the SEM surface morphologies of samples A, B, C and D after potentiodynamic polarization test in 10 wt.% NaOH solution. All sample surfaces are smooth with only a few of scattered pits.
These are consistent with the results in Section 3.2, which indicate that the compact Ni(OH)2 passive film can form readily and thus protect the surface of Ni samples in NaOH solution.
Figure 16 shows the SEM micrographs of the samples after potentiodynamic polarization test in 3 wt.% NaCl solution. The surface morphologies of different samples are obviously different. The circular corrosion pits are evenly distributed on the surfaces of samples A and B with the average pit size of ~150 μm for sample A and ~300 μm for sample B. No corrosion pits are observed on samples C and D. Instead, cubic crystals with grain sizes of 10-25 μm are observed on the surface of sample C. It is a typical galvanic corrosion, i.e. bimetallic corrosion. When the passive film on the surface of sample C is destroyed, we suppose that the corrosion potential of coarse grain region is higher than that of submicron grain. The corrosion occurs preferentially in the submicron grain region of sample C, leaving cubic crystals. In sample D, an intergranular corrosion occurs, leaving the grain shape.
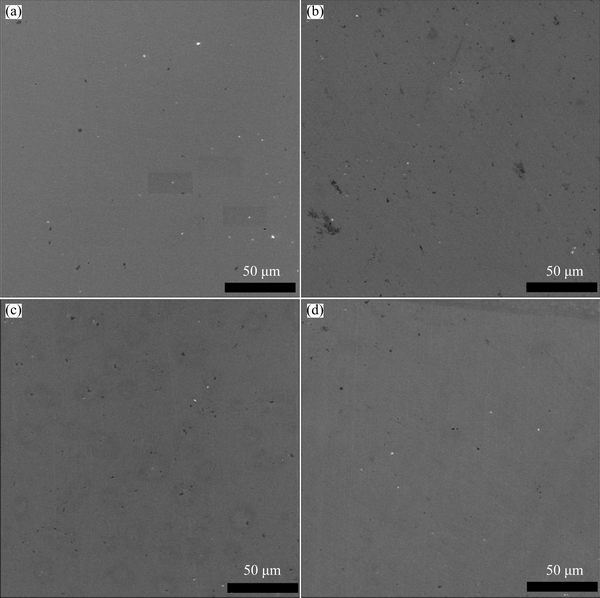
Fig. 15 SEM surface micrographs of samples A (a), B (b), C (c) and D (d) after potentiodynamic polarization test in 10 wt.% NaOH solution
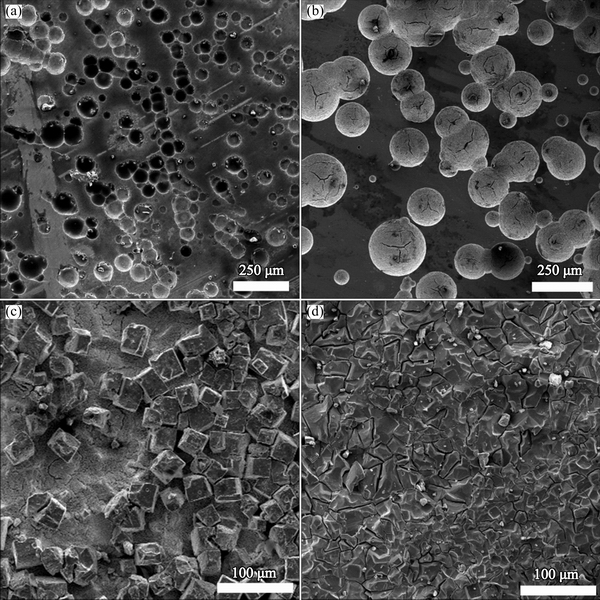
Fig. 16 SEM surface micrographs of samples A (a), B (b), C (c) and D (d) after potentiodynamic polarization test in 3 wt.% NaCl solution
Figure 17 shows the surface morphologies of the samples after the potentiodynamic test in 0.5 wt.% H2SO4 solution. The corrosion of samples is very serious. No passive film is formed on the surface of any sample, which is coincident with the results in Section 3.4. Especially, the corrosion morphology of sample C is similar to that in NaCl solution. In sample D, it is also an intergranular corrosion, leaving the grain shape.
4 Discussion
This study has shown that the effect of grain size on the corrosion behavior of the Ni sample is highly dependent on the ability of the environment to passivate. In NaOH and NaCl solutions, passive Ni(OH)2 and NiO protective films are formed on the surface of Ni samples [20,25], respectively. Smaller grain size in the sample is believed to be beneficial to supporting the formation of passive Ni(OH)2 film of higher integrity [12]. Thus, higher corrosion resistance is found for the Ni sample with smaller grain size. On the contrary, when passivation does not occur in H2SO4 solution, the Ni sample with smaller grain size clearly displays a lower corrosion resistance. Simply, in this case, the smaller the grain is, the higher the volume fraction of imperfect grain boundaries is, and the lower the corrosion resistance is as expected.
The passive current density of sample B with a grain size of 300 nm is lower than that of sample A with a grain size of 30 nm. The CPE of sample B is lower than that of other samples, and a lower CPE is usually associated with a more protective film [18]. This result is also consistent with the passive current density of sample B. It is indicated that the coverage of the passive film is more complete on sample B surface. In Ref. [12], the nanocrystalline Ni has the lowest passive current density compared with the Ni with submicron and micron grains. It is interesting that the passive current density of samples in NaOH solution is a little different from that in the references. By comparing the microstructure of sample A, a large number of twins exist in sample B. There are a few papers about the effect of nanotwins on passive films. The corrosion current density of nanotwins Cu is much lower than that of the other types of Cu samples [35]. Nanotwins Ni can greatly influence the film thickness and the diffusion coefficient of point defect [36,37]. The presence of nanotwins can form a more integrated passive film and improve corrosion resistance compared with other samples.
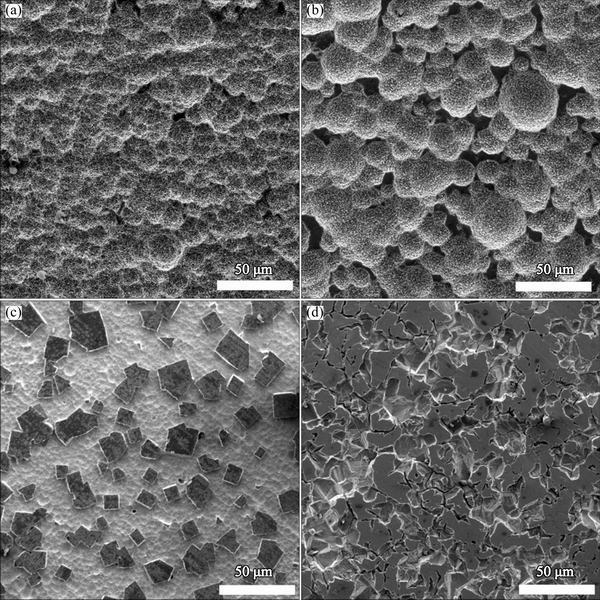
Fig. 17 SEM surface micrographs of samples A (a), B (b), C (c) and D (d) after potentiodynamic polarization test in 0.5 wt.% H2SO4 solution
In our study, we noted that the twins in the samples are not on nanoscale but on submicron/micron scale. The submicron/micron scale twin density is less than nanotwin density, which may be the reason for the fact that submicron twins are less effective than nanotwins in improving the corrosion resistance, but it is beneficial to the formation of dense and smooth passive film. In addition, the corrosion behavior of samples in NaCl solution is similar to results reported in Ref. [16]. This shows that the twin structure does not play a role such as in NaOH solution. Some studies indicated the oxide passive film formed on the surface of samples in NaCl solution [20,25], while the hydroxide passive film formed on the surface in NaOH solution [25,38]. The hydroxide passive film is difficult to dissolve, and the oxide passive film in NaCl solution is just opposite. The passive film formed in NaCl solution is thin and easy to dissolve. The twin structure has little effect on corrosion behavior at submicron/micron scale, but is still beneficial to the formation of dense and smooth passive film.
The corrosion potential and corrosion current density of sample C with bimodal grain size are between those of sample B with submicron grain (200-600 nm) and sample D with coarse grain (5-40 μm) in all solutions, as shown in Fig. 18. The corrosion behavior of sample with bimodal grain size distribution seems to obey a corrosion rule of mixture. The total corrosion potential and corrosion current density are expressed as a function of the volume fractions of the components constituting the microstructure.
φcorr=φcorr1V1+φcorr2V2 (1)
Jcorr=Jcorr1V1+Jcorr2V2 (2)
where φcorr is the corrosion potential of sample with bimodal grain size distribution, φcorr1 and φcorr2 are the corrosion potentials of coarse grain and submicron grain samples, respectively; V1 and V2 are the volume fractions of coarse grain and submicron grain samples, respectively, which were determined from the SEM image of sample C; Jcorr is the corrosion current density of sample with bimodal grain size distribution, Jcorr1 and Jcorr2 are the corrosion current densities of coarse grain and submicron grain samples, respectively. In sample with bimodal grain size distribution, the corrosion potential (φcorr1 and φcorr2) and the corrosion current density (Jcorr1 and Jcorr2) are established. The φcorr and Jcorr depend on the volume fractions of submicron grain and coarse grain. For a bimodal microstructure, the corrosion resistance in a non-passivating environment is enhanced when the volume fraction of the coarse grains is increased and vice versa in a passivating environment. GOLLAPUDI [39] studied the effect of grain size distribution on corrosion behavior by using relationships derived for corrosion current and grain size distribution. The results showed that the grain size distribution can assume an important role in the corrosion behavior of materials. For the same grain size, a broader grain size distribution is more corrosion resistant than a narrow grain size distribution in a non-passivating environment. The reverse behavior is predicted in a passivating environment. The authors predicted a corrosion rule of mixtures, and our studies supported the prediction of corrosion rule of mixture.
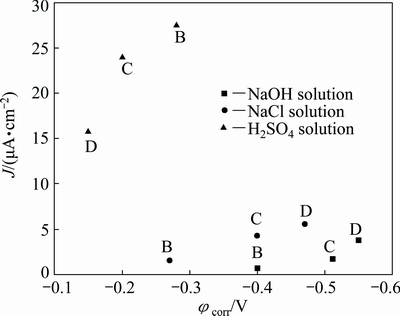
Fig. 18 Relationship between corrosion current density and corrosion potential of samples B, C and D in different solutions
5 Conclusions
(1) The Ni samples with different grain size distributions and twins can be obtained by controlling heat treatment at different temperatures. The original (100) texture was changed into (111) texture in all heat-treated samples.
(2) The effect of the grain size on the corrosion behavior depends upon the ability of the environment to passivate the material. When passive film is formed, the corrosion resistance increases with decreasing the grain size. In contrast, the corrosion resistance decreases with decreasing the grain size when no passivation film is formed.
(3) The corrosion behavior of the sample with bimodal grain size obeys the rule of mixture.
References
[1] WU Xiao-lei, YUAN Fu-ping, YANG Mu-xin, JIANG Ping, ZHANG Chuan-xin, CHEN Liu, WEI Yue-guang, MA Evan. Nanodomained nickel unite nanocrystal strength with coarse-grain ductility [J]. Sci Rep, 2015, 5: 11728.
[2] LI H Q, CHOO H, REN Y, SALEH T A, LIENERT U, LIAW P K, EBRAHIMI F. Strain-dependent deformation behavior in nanocrystalline metals [J]. Phys Rev Lett, 2008, 101: 015502.
[3] LI H Q, EBRAHIMI F. An investigation of thermal stability and microhardness of electrodeposited nanocrystalline nickel-21%iron alloys [J]. Acta Mater, 2003, 51: 3905-3913.
[4] ZAMANI M, AMADEH A, LARI BAGHAL S M. Effect of Co content on electrodeposition mechanism and mechanical properties of electrodeposited Ni-Co alloy [J]. Transactions of Nonferrous Metals Society of China, 2016, 26: 484-491.
[5] PRASAD M J N V, SUWAS S, CHOKSHI A H. Microstructural evolution and mechanical characteristics in nanocrystalline nickel with a bimodal grain-size distribution [J]. Mater Sci Eng A, 2009, 503: 86-91.
[6] KLEMENT U, DA SILVA M. Individual grain orientations and texture development of nanocrystalline electrodeposits showing abnormal grain growth [J]. J Alloys Compd, 2007, 434-435: 714-717.
[7] HIBBARD G D, RADMILOVIC V, AUST K T, ERB U. Grain boundary migration during abnormal grain growth in nanocrystalline Ni [J]. Mater Sci Eng A, 2008, 494: 232-238.
[8] HIBBARD G D, MCCREA J L, PALUMBO G, AUST K T, ERB U. An initial analysis of mechanisms leading to late stage abnormal grain growth in nanocrystalline Ni [J]. Scripta Mater, 2002, 47: 83-87.
[9] CHENG L, HIBBARD G D. Abnormal grain growth via the migration of planar growth interfaces [J]. Mater Sci Eng A, 2008, 492: 128-133.
[10] HIBBARD G D, AUST K T, ERB U. On interfacial velocities during abnormal grain growth at ultra-high driving forces [J]. J Mater Sci, 2008, 43: 6441-6452.
[11] NASIRPOURI F, SANAEIAN M R, SAMARDAK A S, SUKOVATITSINA E V, OGNEV A V, CHEBOTKEVICH L A, HOSSEINI M G, ABDOLMALEKI M. An investigation on the effect of surface morphology and crystalline texture on corrosion behavior, structural and magnetic properties of electrodeposited nanocrystalline nickel films [J]. Appl Surf Sci, 2014, 292: 795-805.
[12] EL-SHERIK A M, ERB U, PALUMBO G, AUST K T. Deviations from Hall-Petch behaviour in as-prepared nanocrystalline nickel [J]. Scripta Metallurgica et Materialia, 1992, 27: 1185-1188.
[13] ERB U, AUST K T, PALUMBO G. Electrodeposited nanocrystalline materials in nanostructured materials [M]. New York: Noyes Publ/ William Andrew Publ, 2002.
[14] ERB U, PALUMBO G, MCCREA J L. Processing of bulk nanocrystalline metals and alloys by electrodeposition, in nano- structured metals and alloys [M]. Cambridge: Woodhead Publ, 2011.
[15] ROFAGHA R, LANGER R, EL-SHERIK A M, ERB U, PALUMBO G, AUST K T. The corrosion behaviour of nanocrystalline nickel [J]. Scripta Metallurgica et Materialia, 1991, 25: 2867-2872.
[16] RALSTON K D, BIRBILIS N. Effect of grain size on corrosion: A review [J]. Corrosion, 2010, 66: 075005-075013.
[17] ERB U. Uhlig’s corrosion handbook [M]. 3rd ed. New Jersey: Wiley, 2011.
[18] YOUSSEF K M S, KOCH C C, FEDKIW P S. Improved corrosion behavior of nanocrystalline zinc produced by pulse-current electrodeposition [J]. Corros Sci, 2004, 46: 51-64.
[19] RALSTON K D, FABIJANIC D, BIRBILIS N. Effect of grain size on corrosion of high purity aluminium [J]. Electrochim Acta, 2011, 56: 1729-1736.
[20] WANG Li-ping, ZHANG Jun-yan, GAO Yan, XUE Qun-ji, HU Li-tian, XU Tao. Grain size effect in corrosion behavior of electrodeposited nanocrystalline Ni coatings in alkaline solution [J]. Scripta Mater, 2006, 55: 657-660.
[21] AFSHARI V, DEHGHANIAN C. Effects of grain size on the electrochemical corrosion behaviour of electrodeposited nano- crystalline Fe coatings in alkaline solution [J]. Corros Sci, 2009, 51: 1844-1849.
[22] WANG S G, SHEN C B, LONG K, ZHANG T, WANG F H, ZHANG Z D. The electrochemical corrosion of bulk nanocrystalline ingot iron in acidic sulfate solution [J]. J Phys Chem B, 2006, 110: 377-382.
[23] VIJAY KUMAR D, AYYAGARI S, PRASAD M J N V. Mechanical characteristics and electrochemical behaviour of electrodeposited nanocrystalline iron and iron-nickel alloy [J]. Mater Chem Phys, 2017, 201: 26-34.
[24] LUO Wei, XU Yi-min, WANG Qi-ming, SHI Pei-zhen, YAN Mi. Effect of grain size on corrosion of nanocrystalline copper in NaOH solution [J]. Corros Sci, 2010, 52: 3509-3513.
[25] QIN Li-yuan, LIAN Jian-she, JIANG Qing. Effect of grain size on corrosion behavior of electrodeposited bulk nanocrystalline Ni [J]. Transactions of Nonferrous Metals Society of China, 2010, 20: 82-89.
[26] MENG Guo-zhe, LI Yang, SHAO Ya-wei, ZHANG Tao, WANG Yan-qiu, WANG Fu-hui, CHENG Xue-qun, DONG Chao-fang, LI Xiao-gang. Effect of microstructures on corrosion behavior of nickel coatings (II): Competitive effect of grain size and twins density on corrosion behavior [J]. J Mater Sci Technol, 2016, 32: 465-469.
[27] MENG Guo-zhe, LI Yang, SHAO Ya-wei, ZHANG Tao, WANG Yan-qiu, WANG Fu-hui, CHENG Xue-qun, DONG Chao-fang, LI Xiao-gang. Effect of microstructures on corrosion behavior of nickel coatings (I): Abnormal grain size effect on corrosion behavior [J]. J Mater Sci Technol, 2015, 31: 1186-1192.
[28] YANG Feng, TIAN Wen-huai, NAKANO H, TSUJI H, OUE S, FUKUSHIMA H. Effect of current density and organic additives on the texture and hardness of Ni electrodeposited from sulfamate and Watt’s solutions [J]. Mater Trans, 2010, 51: 948-956.
[29] YANG Feng, LI Chun-hua, CHENG Sheng-wei, WANG Lei, TIAN Wen-huai. Deformation behavior of explosive detonation in electroformed nickel liner of shaped charge with nano-sized grains [J]. Transactions of Nonferrous Metals Society of China, 2010, 20: 1397-1402.
[30] BHATTACHARJEE P P, SINHA S K, UPADHYAYA A. Effect of sintering temperature on grain boundary character distribution in pure nickel [J]. Scripta Mater, 2007, 56: 13-16.
[31] RANDLE V, RIOS P R, HU Y. Grain growth and twinning in nickel [J]. Scripta Mater, 2008, 58: 130-133.
[32] BADAWY W A, ISMAIL K M, FATHI A M. Effect of Ni content on the corrosion behavior of Cu-Ni alloys in neutral chloride solutions [J]. Electrochim Acta, 2005, 50: 3603-3608.
[33] ABAYARATHNA D, HALE E B, O'KEEFE T J, WANG Y M, RADOVIC D. Effects of sample orientation on the corrosion of zinc in ammonium sulfate and sodium hydroxide solutions [J]. Corros Sci, 1991, 32: 755-768.
[34] MISHRA R, BALASUBRAMANIAM R. Effect of nanocrystalline grain size on the electrochemical and corrosion behavior of nickel [J]. Corros Sci, 2004, 46: 3019-3029.
[35] ZHAO Y, CHENG I C, KASSNER M E, HODGE A M. The effect of nanotwins on the corrosion behavior of copper [J]. Acta Mater, 2014, 67: 181-188.
[36] MENG Guo-zhe, SHAO Ya-wei, ZHANG Tao, ZHANG Yi, WANG Fu-hui. Synthesis and corrosion property of pure Ni with a high density of nanoscale twins [J]. Electrochim Acta, 2008, 53: 5923-5926.
[37] MENG Guo-zhe, SUN Fei-long, SHAO Ya-wei, ZHANG Tao, WANG Fu-hui, DONG Chao-fang, LI Xiao-gang. Influence of nano-scale twins (NT) structure on passive film formed on nickel [J]. Electrochim Acta, 2010, 55: 2575-2581.
[38] MOSAVAT S H, SHARIAT M H, BAHROLOLOOM M E. Study of corrosion performance of electrodeposited nanocrystalline Zn-Ni alloy coatings [J]. Corros Sci, 2012, 59: 81-87.
[39] GOLLAPUDI S. Grain size distribution effects on the corrosion behaviour of materials [J]. Corros Sci, 2012, 62: 90-94.
杨 峰1,2,张晓峰1,2,杨 虹3,刘亦农3,郝世杰1,2,崔立山1,2
1. 中国石油大学(北京) 重质油国家重点实验室,北京 102249;
2. 中国石油大学(北京) 油气装备材料失效与腐蚀防护北京市重点实验室,北京 102249;
3. School of Mechanical and Chemical Engineering, The University of Western Australia, Perth, WA 6009, Australia
摘 要:研究具有均匀和双峰晶粒分布电沉积镍的腐蚀行为。利用SEM、EBSD、TEM和XRD研究样品的显微组织,利用动电位测试法和电化学阻抗谱研究样品的腐蚀行为。结果表明:电沉积纳米晶镍具有(100)和(111)织构。纳米晶镍经不同温度热处理后,可得到具有不同晶粒尺寸分布的样品。晶粒尺寸对样品腐蚀行为的影响依赖于环境钝化能力。当钝化膜在样品表面形成时,耐蚀性随晶粒尺寸的减小而增强;相反,当样品表面无钝化膜形成时,耐蚀性随晶粒尺寸减小而降低。具有双峰晶粒尺寸分布样品的腐蚀行为遵循混合法则。
关键词:腐蚀行为;电沉积镍;双峰晶粒;孪晶;晶粒尺寸
(Edited by Wei-ping CHEN)
Foundation item: Projects (51571211, 51731010, 51471028) supported by the National Natural Science Foundation of China; Project (DP160105066) supported by Australian Research Council
Corresponding author: Feng YANG, Tel: +86-10-89733385, E-mail: andor_20@sina.com; Li-shan CUI, Tel: +86-10-89731158, E-mail: lscui@cup.edu.cn
DOI: 10.1016/S1003-6326(19)64952-6

