
Exfoliation corrosion of T6- and T8-aged AlxCuyLiz alloy
LI Hong-ying(李红英)1, 2, TANG Yi(唐 宜)1, ZENG Zai-de(曾再得)1, ZHENG Feng(郑 峰)1, 2
1. School of Materials Science and Engineering, Central South University, Changsha 410083, China;
2. Key Laboratory of Nonferrous Metal Materials Science and Engineering, Ministry of Education,
Central South University, Changsha 410083, China
Received 3 September 2007; accepted 14 December 2008
Abstract: The exfoliation corrosion behavior of a novel Al-Li alloy treated by T6- and T8-peak ageing was studied by electrochemical impedance spectroscopy(EIS) technique. The surface morphology of corroded samples was examined by scanning electron microscope(SEM). The microstructure of un-corroded samples was observed by transmission electron microscope(TEM). At early stage of immersion in EXCO, EIS plots of the two differently processed samples are composed of a capacitive arc in the high frequency range and an inductive loop in the low frequency range. Inductive loop disappears with the increasing of immersion time and two capacitive arcs appear. T6-treated alloy has higher exfoliation susceptibility than T8-treated one, suggested by different exfoliation starting time, which is 23 h and 27 h respectively. T1 phase and equilibrium precipitate at the grain boundary of T6-treated alloy are larger in amount and size than those of T8-treated alloy. This is the main reason for the higher exfoliation susceptibility of T6-treated alloy.
Key words: exfoliation corrosion; Al-Cu-Li alloy; ageing treatment; intergranular precipitates
1 Introduction
Al-Li alloys are valued in airplane application because of their excellent properties, such as low density, high strength and large elastic modulus. In the near future, they will be widely applied in airplane structures. However, they are susceptible to localized corrosion in moist environment. So it is important to investigate their corrosion behavior for their application [1]. The existing researches about the corrosion behavior of Al-Li alloys are mainly concentrated on pit corrosion, stress corrosion and intergranular corrosion, while the exfoliation corrosion(EFC) was less studied[2]. Considering the strong negative effect resulted from EFC[3-5], investigating the EFC behavior of Al-Li alloys is quite meaningful.
There are several methods to quantitatively study the EFC behavior of aluminum alloys, including EIS technique, corrosion product force measuring and electrical resistance testing[6]. Recently, ZHAO and FRANKEL[7] suggested a method named ESH technique to quantitatively study the exfoliation corrosion. In those methods, EIS has been widely used in the study of localized corrosion processes for a variety of systems since the end of 1980s[8]. In the 1990s, researchers began to use EIS technique in determining EFC of aluminum alloy[6]. CONDE et al[9] adopted EIS technique in electrochemical modeling of 8090 Al-Li alloy’s EFC behavior, and found that the EIS of exfoliation-attacked electrode was composed of two capacitive arcs. Similar research has also been done in 2091 Al-Li alloy[8]. Recently, LI et al[10] investigated the effect of different aging treatments on an Al-2.8%Cu- 1.5%Li-0.3%Mg-0.3%Zn-0.3%Mn-0.15%Zr alloy’s EFC activity.
The dependability of EIS method lies on the fact that obtained Nyquist plots could be a reflection of corrosion progress. In general, when the immersion time increases to some extent, two capacitive impedances with different time constant appear, indicating the occurrence of EFC. Thus, the susceptibility of EFC in alloy can be quantitatively represented by the appearance and duration of the two capacitive impedance arcs [9-10].
The purpose of this work is to study the exfoliation corrosion behavior of T6- and T8-peak aged new Al-Cu- Li alloy by EIS method, trying to find the relationship between corrosion behaviors and ageing condition. This study is valuable for the practical use of the alloy and it can also make sense to exfoliation corrosion research of other aluminum alloys.
2 Experimental
Testing samples were taken from a newly developed Al-Cu-Li alloy containing small amounts of Mg, Zn, Mn and Zr. The samples were processed as follows: forged slap (20 mm in thickness)→annealing (470 ℃, 2 h)→hot rolling to 12 mm in thickness→annealing (450 ℃, 1.5 h) →hot rolling to 5 mm in thickness→annealing (450 ℃, 2 h) and cooling to room temperature in furnace→cold rolling to 2 mm in thickness→solution treatment (520 ℃, 2 h and cold water quenching)→T6 (165 ℃, 50 h) or T8 (135 ℃, 50 h, with 6% pre-deformation) peak ageing treatments. A schematic flow chart for the processing is shown in Fig.1.
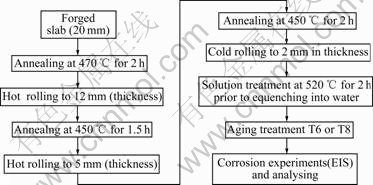
Fig.1 Flow chart of sample processing
Exposed surface of sample (2 cm×3 cm) for corrosion was ground, polished, degreased, rinsed and dried in turn. The corrosion-isolated surface was sealed with epikote. Corrosion experiment was performed according to EXCO test of ASTM G34―79. The tem- perature of EXCO (4.0 mol/L NaCl + 0.5 mol/L KNO3 + 0.1 mol/L HNO3, pH=0.4) solution was maintained at (25±2) ℃. The samples were immersed in the solution for 96 h with the ratio of exposed surface to the solution volume maintained at 25 mL/cm2. Three electrode systems with Pt as the auxiliary electrode and saturated calomel electrode as the reference electrode were used. EIS measurement was conducted in a CHI660A electrochemical workstation at open-circuit potential under the since-wave current with a frequency from 20 kHz to 0.01 Hz. The signal voltage is 10 mV. According to equivalent circuit based on exposed surface, EIS result was simulated via Z-view software. The corroded surface was examined by SEM (KYKY-2800). The samples without attack of corrosion were observed by TEM (Tecnai G220).
3 Results and discussion
3.1 Morphologies of corroded surfaces
Fig.2 shows surface morphologies of samples when immersion time increases to 7 h. Great amount of corrosion spots distribute on the exposed surface. Some corrosion spots have grown into pits. Obviously, the pit corrosion of T6-treated sample is more serious than that of T8-treated sample. It is favorable to EFC afterward.
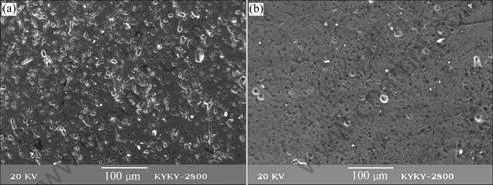
Fig.2 Surface morphologies of samples with immersion time of 7 h: (a) T6-treated; (b) T8-treated
Fig.3 shows side surface morphologies of samples with immersion time of 96 h. The morphologies exhibit typical corrosion features of EFC with corrosion path running parallel with the exposed surface. Fig.3 suggests that the depth of corrosion and width of corrosion path in T6-treated sample exceed those of T8-treated one, implying greater extent of EFC for T6-treated sample.
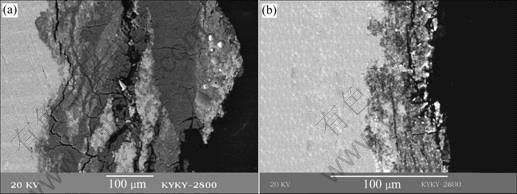
Fig.3 Side surface morphologies of sample with immersion time of 96 h: (a) T6-treated; (b) T8-treated
3.2 EIS features of T6- and T8-treated samples
The Nyquist plots of the samples immersed no more than 1 h consist of a compressed capacitive impedance at high frequency and an inductive arc at low frequency, as presented in Fig.4. It can be seen that the radius of the capacitive arc decreases with increasing the immersion time for both the T6-treated and T8-treated samples. This phenomenon is due to the fact that the weakening of protective oxide film on surface during immersion reduces the reaction resistance. There is no acknowledged explanation about the inductive arc at low frequency. KEDAM et al[12] indicated that it resulted from the weakening of protective effectiveness of oxide film due to the anodic dissolution. CAO et al[11] suggested that inductive resistance could be produced in inducing period of pit corrosion of oxide film. As soon as the pits are perforated, inductive resistance disappears. Abandoning the debate, what can be sure is that the features and evolving regularities concluded from EIS plots of Fig.4 have close relationship with the change of oxide film on alloy surface.
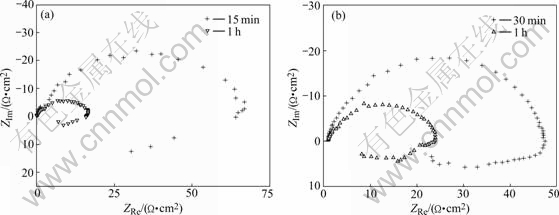
Fig.4 Nyquist plots of testing samples immersed in EXCO solution for no more than 1 h: (a) T6-treated; (b) T8-treated
According to observation, EFC occurs at the 23rd hour for T6-treated alloy and the 27th hour for T8-treated one, indicating the higher EFC susceptibility of the T6-treated alloy. Corresponding EIS plots are given in Fig.5. Plots of testing samples immersed in EXCO solution for 81 h and 96 h are also given. The exfoliation-attacked surface consists of two parts. One is the original alloy surface, and the other is the new surface exposed in the EXCO solution due to corrosion. These two kinds of surface have different response to frequency. The capacitive impedance arc at high-medium frequency is associated with the original alloy surface and that at low-medium frequency is derived from the new (or corroded) interface[8, 11]. These features are reflected in the plots of Fig.5.
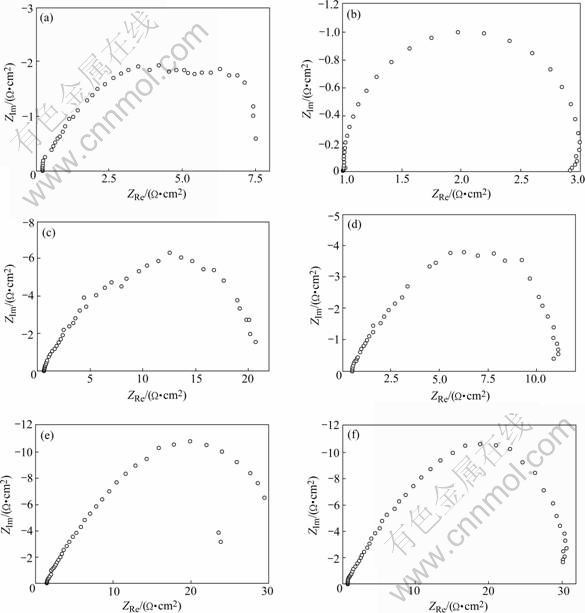
Fig.5 Nyquist plots of tested samples after exfoliation: (a) T6, 23 h; (b) T8, 27 h; (c) T6, 81 h; (d) T8, 81 h; (e) T6, 96 h; (f) T8, 96 h
Based on the structure of corroded surface after exfoliation, an equivalent circuit was proposed and presented in Fig.6.
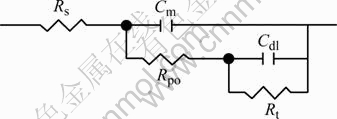
Fig.6 Equivalent circuit for corroded surface structure
In the circuit, RS is the solution resistance. Pore and charge-transfer resistances are defined as Rpo and Rt, respectively. The capacitance of original surface is described as Cm, while the capacitance corresponding with the newly formed interface is represented by Cdl. To better simulate the EIS data, the capacitances are replaced by a constant-phase element(CPE) defined by[13-14]
ZCPE=Z0/(jω)α (1)
where Z0 is a constant, ω is the angular frequency, j=  and α corresponds to the nature of circuit. For ideal capacitance, α=1; for resistance, α=0; for inductance, α=-1; and for Warburg impendence, α=-0.5.
According to EIS data and the equivalent circuit, some fitted circuit constants are listed in Table 1.
Table 1 Some fitted constants of circuit for T6- and T8-treated samples with exfoliation
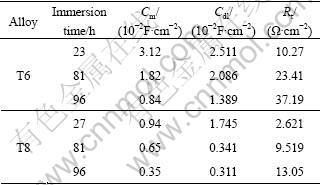
The value of Cm decreases with immersion time.This reflects the area reduction of original surface. Cdl also trends downwards, which should be an indication of thickening of corrosion product on the newly formed surface. Rt rises with the development of exfoliation due to the accumulation of corrosion products on surface plus the consumption of secondary phases. Additionally, Rt in T6-treated sample is much larger than that in T8-treated one, meaning greater accumulation amount of corrosion products. It is consistent with the morphology observation and also indicates greater extent of EFC of T6-treated alloy than that of T8-treated alloy.
3.3 Microstructure analyzing
From the surface morphologies in Figs.2 and 3 and different observed starting time of exfoliation, together with simulation result of EIS data, it is determinate that the T6-treated sample has higher susceptibility of EFC when being exposed in same EXCO solution than T8-treated sample.
It is generally thought that EFC is developed from intergranular attack[14]. During corrosion process, the corrosion product accumulates at the grain boundaries, resulting in a wedging force and finally lifts the alloy surface. The corrosion product force is strongly dependent on the susceptibility of the grain boundaries to intergranular corrosion, as controlled by the composition and distribution of the age-hardening precipitates[15].
T1(Al2CuLi) phase is considered as one of the most effective strengthening phases in Al-Cu-Li alloy[16]. It is inclined to precipitate at grain boundary, sub-grain boundary and dislocation. T1 phase has very high electrochemical activity to cause intergranular corrosion [13]. Pre-deformation in T8-treated sample produces great amount of dislocations within grains, playing the role of nucleating point for T1 phase. As a result, T1 phase in T8-treated alloy precipitates finely and uniformly both within grains and at grain boundary (Fig.7(b)). On the contrary, T6-treated sample has much fewer dislocations within grains to serve as nucleating point. Therefore, T1 phase in T6-treated sample is larger in size and it is preferably to precipitate at grain boundaries (Fig.7(a)), which promotes the happening and expanding of intergranular corrosion.
In Fig.7, some coarse precipitates at grain boundary (marked by horizontal arrows) can be seen, with large size in T6-treated sample and small size in T8-treated sample. Judged by morphology, they are not able to be the needle-like T1 phase. However, it was found that the equilibrium precipitate existing at the grain boundaries of an Al-Cu-Li alloy AF/C458 (Al-2.8%Cu-1.5%Li- 0.6%Zn-0.3%Mg-0.3%Mn-0.07%Zr) is T2(Al6CuLi3) and R(Al5CuLi3)[17]. LI et al[10] also considered that the similar precipitate in an Al-Cu-Li alloy (Al-2.8%Cu- 1.5%Li-0.3%Mg-0.3%Zn-0.3%Mn-0.15%Zr) was T2(Al6CuLi3) or R(Al5CuLi3). This studied alloy has similar composition with the two above. Thus coarse precipitates at grain boundary may also be T2(Al6CuLi3) or R(Al5CuLi3). According to potentiodynamic scanning curves of simulated T2 and Al in 3.5% sodium chloride solution tested by LI et al[10], it can be concluded that T2 precipitate is more sensitive to corrosion than Al and will be preferentially dissolved. The composition of R phase is close to that of T2, so they should have similar electrochemical behavior. Therefore, the coarser precipitates at grain boundary of T6-treated sample accelerate its intergranular corrosion process too.
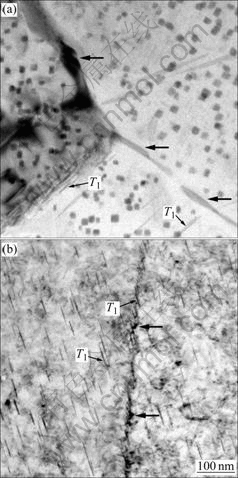
Fig.7 Bright field TEM images of grain boundary area of samples: (a) T6-treated; (b) T8-treated
In summary, both the T1 and equilibrium precipitates at the grain boundary in T6-treated sample are larger in amount and size than those in T8-treated sample. These phases are favorable to intergranular corrosion, thus, more corrosion product on grain boundaries is produced in T6-treated sample, which leads to stronger lifting force to the surface to cause exfoliation. This explains why the T6-treated alloy has higher exfoliation susceptibility than T8-treated one.
4 Conclusions
1) At early stage of immersion in EXCO, EIS plots of the two differently processed specimens are composed of a capacitive arc in the high frequency range and an inductive loop in the low frequency range. When exfoliation corrosion occurs, two capacitive arcs in different frequency ranges appear.
2) T6-treated alloy has higher exfoliation susceptibility than T8-treated one. This is because T1 and equilibrium precipitates at the grain boundary of T6-treated alloy are larger in amount and size than those of T8-treated one. Thus, more corrosion product is produced and stronger lifting force is supplied to the occurrence of exfoliation.
Acknowledgements
The authors would like to thank the National Laboratory of New Metallic Materials of China for financial support. Thanks are expressed to Professor ZHOU Shan-chu for experimental assistance and Dr. ZHANG Hong and Dr. LI Shi-chen for TEM analysis.
References
[1] LI Jin-feng, ZHENG Zi-qiao, REN Wen-da, CHEN Wen-jing, ZHAO Xu-shan, LI Shi-chen. Simulation on function mechanism of T1(Al2CuLi) precipitate in localized corrosion of Al-Cu-Li alloys [J]. Trans Nonferrous Met Soc China, 2006, 16(6): 1268-1273.
[2] LI Jin-feng, ZHANG Zhao, ZHANG Jian-qing, CAO Chu-nan. Review of research on corrosion behavior of Al-Li alloys [J]. Journal of Chinese Society for Corrosion and Protection, 2003, 23(5): 316-320. (in Chinese)
[3] CHUBB J P, MORAD T A, HOCKENHULL B S, BRISTOW J W. The effect of exfoliation corrosion on the fracture and fatigue behavior of 7178-T6 aluminum [J]. International Journal of Fatigue, 1995, 11(1): 49-54.
[4] PETROYIANNISA P V, KERMANIDISA A T, AKIDB T, RODOPOULOSB C A, PANTELAKIS S G. Analysis of the effects of exfoliation corrosion on the fatigue behaviour of the 2024-T351 aluminium alloy using the fatigue damage map [J]. International Journal of Fatigue, 2005, 27(7): 817-827.
[5] LIAO M, BELLINGER N C, KOMOROWSKI J P. Modeling the effects of prior exfoliation corrosion on fatigue life of aircraft wing skins [J]. International Journal of Fatigue, 2003, 25(9/11): 1059-1067.
[6] LI Jin-feng, CAO Fa-he, ZHANG Zhao, CHENG Ying-liang, ZHANG Jian-qing, CAO Chu-nan. Review on exfoliation susceptibility of aluminum alloys and quantitative measurement method [J]. Journal of Chinese Society for Corrosion and Protection, 2004, 24(1): 55-64. (in Chinese)
[7] ZHAO X Y, FRANKEL G S. Quantitative study of exfoliation corrosion: Exfoliation of slices in humidity technique [J]. Corrosion Science, 2007, 49(2): 920-938.
[8] CONDE A, de DAMBORENEA J. Evaluation of exfoliation susceptibility by means of the electrochemical impedance spectroscopy [J]. Corrosion Science, 2000, 42(8): 1363-1377.
[9] CONDE A, de DAMBORENEA J. Electrochemical modeling of exfoliation corrosion behaviour of 8090 alloy [J]. Electrochimica Acta, 1998, 42(8): 849-860.
[10] LI J F, ZHENG Z Q, LI S C, REN W D, CHEN W J. Exfoliation corrosion and electrochemical impedance spectroscopy of an Al-Li alloy in EXCO [J]. Materials and Corrosion, 2007, 58(4): 273-279.
[11] CAO Chu-nan, WANG Jia, LIN Hai-chao. Effect of Cl- on the impedance of passive-film-covered electrodes [J]. Journal of Chinese Society of Corrosion and Protection, 1989, 9(4): 261-270. (in Chinese)
[12] KEDDAM M, KUNTZ C, TAKENOUTI H, ZUILID S D. Exfoliation corrosion of aluminum alloys examined by electrode impedance [J]. Electrochimica Acta, 1997, 42(1): 87-97.
[13] LI Jing-feng, ZHENG Zi-qiao, REN Wen-da. Function mechanism of secondary phase on localized corrosion of Al alloy [J]. Materials Review, 2005, 19(2): 81-83. (in Chinese)
[14] KELLY D J, ROBINSON M J. Influence of heat treatment and grain shape on exfoliation corrosion of Al-Li alloy 8090 [J]. Corrosion, 1993, 49(10): 787-795.
[15] MCNAUGHTAN D, WORSFOLD M, ROBINSON M J. Corrosion product force measurements in the study of exfoliation and stress corrosion cracking in high strength aluminium alloys [J]. Corrosion Science, 2003, 45(10): 2377-2389.
[16] DAI Sheng-long, HAN Ya-fang, YAN Ming-gao. A new high strength and high tolerance-resistance Al-Li alloy [J]. Trans Nonferrous Met Soc China, 2006, 16(z3): 1649-1654.
[17] BUCHHEIT R G, MATHUR D, GOUMA P I. Grain boundary corrosion and stress corrosion cracking studies of Al-Li-Cu alloy AF/C458 [EB/OL]. http://www.mse.eng.ohio-state.edu/~bruedigam/ RGB06.pdf, undated.
Corresponding author: LI Hong-ying; Tel: +86-731-8836328; E-mail: lhying@mail.csu.edu.cn
(Edited by LI Xiang-qun)

