Impact of cold indoor thermal environmental conditions on human thermal response
来源期刊:中南大学学报(英文版)2011年第4期
论文作者:刘红 谭青 李百战 谈美兰 马小磊
文章页码:1285 - 1292
Key words:indoor thermal environment; thermal comfort; thermal sensation; skin temperature; human thermal response
Abstract:
To explore the thermal responses under the non-thermal equilibrium cold environmental conditions, a laboratory study was conducted in climate chamber. The local skin temperatures and thermal sensation of 20 subjects were recorded at 10 min intervals for 90 min under air temperatures of 7.4, 9.1, 11 and 15 °C. The results show that both local skin temperatures and mean skin temperature decrease not only with the drop of ambient air temperature but also with the exposure time. Local thermal sensation and overall the thermal sensation have the similar temperature-varying and time-varying characteristics. Predicted mean vote (PMV) model cannot correctly predict the thermal sensation under non-thermal equilibrium cold environment. The correlation between local thermal sensation and local skin temperatures shows that thermal sensation is closely related to skin temperature. Skin temperature is an effective indicator of thermal sensation. A linear relationship model between overall thermal sensation and mean skin temperature, considering both ambient temperature and exposure time, was established in the non-thermal equilibrium cold environment, which makes the evaluation of thermal sensation more objective.
J. Cent. South Univ. Technol. (2011) 18: 1285-1292
DOI: 10.1007/s11771-011-0834-z![]()
LIU Hong(刘红)1, 2, TAN Qing(谭青)1, 2, LI Bai-zhan(李百战)1, 2,
TAN Mei-lan(谈美兰)1, 2, MA Xiao-lei(马小磊)1, 2
1. Key Laboratory of the Three Gorges Reservoir Region’s Eco-Environment of Ministry of Education,
Chongqing University, Chongqing 400045, China;
2. The Faculty of Urban Construction and Environmental Engineering, Chongqing University,
Chongqing 400045, China
? Central South University Press and Springer-Verlag Berlin Heidelberg 2011
Abstract: To explore the thermal responses under the non-thermal equilibrium cold environmental conditions, a laboratory study was conducted in climate chamber. The local skin temperatures and thermal sensation of 20 subjects were recorded at 10 min intervals for 90 min under air temperatures of 7.4, 9.1, 11 and 15 °C. The results show that both local skin temperatures and mean skin temperature decrease not only with the drop of ambient air temperature but also with the exposure time. Local thermal sensation and overall the thermal sensation have the similar temperature-varying and time-varying characteristics. Predicted mean vote (PMV) model cannot correctly predict the thermal sensation under non-thermal equilibrium cold environment. The correlation between local thermal sensation and local skin temperatures shows that thermal sensation is closely related to skin temperature. Skin temperature is an effective indicator of thermal sensation. A linear relationship model between overall thermal sensation and mean skin temperature, considering both ambient temperature and exposure time, was established in the non-thermal equilibrium cold environment, which makes the evaluation of thermal sensation more objective.
Key words: indoor thermal environment; thermal comfort; thermal sensation; skin temperature; human thermal response
1 Introduction
Thermal response refers to personal physiological and psychological response to different thermal environment, which could be described by physiological index and thermal sensation vote. Usually studied physiological indexes include skin temperature [1-2], sensory nerve conduction velocity [3-4], heart rate variability [5], electrocardiograph and electro- encephalogram [6]. Among these indexes, skin temperature is the most important index for its heat exchange role with the thermal environment.
The most common thermal sensation predicating model is PMV-PPD model [7]. Thermal sensation is predicted as a combined function of air temperature, humidity, air velocity, mean radiant temperature, clothing and activity in the model. The presupposition of the model is that, people would be in heat balance while the mean skin temperature and skin wettedness were kept at a comfortable level, therefore, it is mainly used to evaluate thermal comfort of moderate thermal environment. Many researchers have shown that there were discrepancies between PMV index and the real thermal sensation, especially in naturally ventilated buildings [8], high temperature conditions [9] and high air velocity conditions [10]. In cold thermal environmental conditions, the discrepancies also exist. One explanation is that skin temperature is lower than the comfortable level. Even in a steady-state thermal environment, PMV cannot reflect the real thermal sensation well while entering the cold thermal environmental conditions, for the body needs some time to reach thermal equilibrium.
ASHRAE handbook fundamentals [11] adapt TSENS index, which is based on mean body temperature to evaluate thermal sensation. Compared with PMV, TSENS adapting ASHRAE 11-point scale has a wider application range and may predict thermal sensation at extreme cold or hot environment. TSENS index predicts thermal sensation well, however, it is not widely used as PMV index due to the complex calculation of mean body temperature, which must be calculated according to Gagge’s 2-node model [12]. While the 2-node model is nonlinear differential equation of two variations, the calculation of which depends on computers.
Some researchers have been looking for simple evaluation methods. ZHANG et al [2] proposed that thermal sensation was the function of skin temperature. YU and DUAN [13] adapted one-node model to predict the mean body temperature during transients and put the calculated mean body temperature into TSENS index to evaluate thermal sensation.
Thermal response is asymmetrical under cold and hot environment, and humans are more sensitive to cold stimuli than warm stimuli [14]. The existing evaluation method for neutral, hot or transient environment may not be suitable for cold thermal environmental conditions. At present, there is no thermal sensation evaluation method in the process of the establishing of human thermal equilibrium. In the human non-thermal equilibrium cold thermal environmental conditions, thermal sensation is not only influenced by the cool stimulation, but also the stimulate time and the original thermal condition of humans. The purpose of the study is to analyze the variation of skin temperature and thermal sensation in non-thermal equilibrium cold thermal environmental conditions, and finally to seek for a simple and feasible thermal sensation evaluation method in the non-thermal equilibrium cold thermal environmental conditions.
2 Experimental
2.1 Climate chamber and experimental conditions
The experiment was performed in a climate chamber (4 m×3 m×2.7 m) in Chongqing University, China. Its external environment is the indoor environment of a room. There was no direct solar radiation entered. This dual structure design can effectively reduce the interference of the outdoor thermal environment variation on climate chamber. The climate chamber can build kinds of combinations of thermal environmental parameters and realize the automatic control.
The study mainly aimed at the impact of air temperature and exposure time on human skin temperature and thermal sensation exposure to cold thermal environmental conditions. The experiment was conducted at four low temperature levels between 7- 15 °C, precisely, of 7.4, 9.1, 11.0 and 15.0 °C. In order to avoid the impact of relative humidity and air velocity on thermal sensation, the relative humidity was maintained at around 65% and the air velocity was less than 0.25 m/s to avoid draft.
2.2 Subjects
Ten male and ten female healthy university students volunteered as subjects. Each subject gave his written informed consent prior to the experiments and participated in all the four experiments. They were required to wear a uniform clothing combination of down jacket, short-sleeved T-shirt, down pants, cotton socks and cotton shoes with an insulation level of 1.32 clo (1 clo=0.155 m2・K/W) from clothing garment checklists in ASHRAE Standard 55 [15].
2.3 Equipments
Thermal comfort monitoring station (LSI, Italy) was used to measure the thermal environmental parameters around subjects. This station was able to take measurements and store the data into a data logger. Ambient temperature (Ta), black-bulb temperature (Tg), relative humidity (RH) and air velocity (v) were measured. Precisions were ±0.2 °C, ±2% and ±0.1 m/s, respectively.
The 13-point local skin temperatures of subject were measured with copper-constantan thermocouples attached to skin measuring sites, including forehead, chest, back, upper arm (right and left), lower arm (right and left), dorsal hand (right and left), calf (right and left), and thigh (right and left). Thermocouples linked to a multi-channel data collector recorded skin temperatures automatically and sent the data to a computer according to needed time intervals. Before the measurement, all the thermocouples were calibrated.
2.4 Experimental procedures
A subject entered the climate chamber from a neutral locker room and sat on a desk where he or she could perform a normal office work activity (1.0 met, 1 met=58.2 W/m2). The duration of each exposure was 2 h, and the first 0.5 h was the adaptation time that allowed the subject to settle down and minimize any possible influences due to the environmental changes. The measurements were made after the subject had stayed in the chamber for 30 min. The local skin temperatures of subject, the thermal environmental parameters and his thermal sensation in the chamber were measured or reported at the same time every 10 min. The thermal sensation responded to a questionnaire as the following description.
2.5 Questionnaire
The questionnaire aiming to characterize thermal sensation in cold thermal environmental conditions was divided into two sections. The first part filled in before the formal experiment concerned anthropometric characteristics such as age, height, weight and gender to collect some necessary information. The second one evaluated the thermal sensation using the ASHRAE 7-point scale, as shown in Fig.1. There were two types of thermal sensation questionnaire: one is the overall thermal sensation and the other one is the local thermal sensation, including the thermal sensation of head, neck, chest, back, arm, thigh, calf and foot.
![]()
Fig.1 ASHRAE 7-point scale of thermal sensation
2.6 Calculation and statistical analysis
On the basis of reliability and sensitivity, an eight- point formula [5] is used to calculate the mean skin temperature (MST), which can be expressed as
TMS=0.07Tforehead+0.175Tchest+0.175Tback+0.07Tupper arm+
0.07Tlower arm+0.05Thand +0.19Tthigh+0.20Tcalf (1)
where TMS is the mean skin temperature calculated according to the measuring sites and the corresponding weighting factors; Tforehead is the skin temperature of forehead; Tchest is the skin temperature of chest; Tback is the skin temperature of back; Tupper arm is the average skin temperature of right upper arm and left one; Tlower arm is the average skin temperature of right lower arm and left one; Thand is the average skin temperature of right dorsal hand and left one; Thand is the average skin temperature of right dorsal hand and left one; Tthigh is the average skin temperature of right thigh and left one; Thand is the average skin temperature of right calf and left one.
The SPSS 17.0 software was employed to make the statistical analysis, and the level of signi?cance was 0.05.
3 Results and discussion
3.1 Descriptions of subjects and experimental conditions
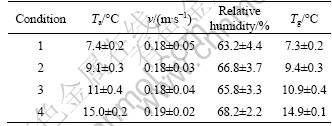
Table 1 and Table 2 describe the basic information of subjects and the thermal environmental parameters, respectively, in this study.
Table 1 Anthropometric data of subjects
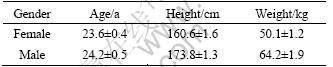
Table 2 Experimental conditions
3.2 Time-varying characteristics of local skin temperature and mean skin temperature
Figure 2 shows the changing trend of measured local skin temperatures with exposure time. Skin temperatures of the forehead, chest and back remain at about 31, 34 and 35 °C, respectively, during the exposure. However, skin temperatures of the extremities decrease with the exposure time. This is opposite to the neutral environment, which keeps steady [16]. The temperatures of all the extremities drop and the variation amplitude is different during the exposure time. The greatest temperature drop is on hand, close to 6 °C, and the second one is on the calf and lower arm, all of which are far away from the core part of body. The reason why temperatures of the trunk and forehead keep constant is that they are directly influenced by the body temperature. The low temperature exposure causes only superficial and peripheral cooling.
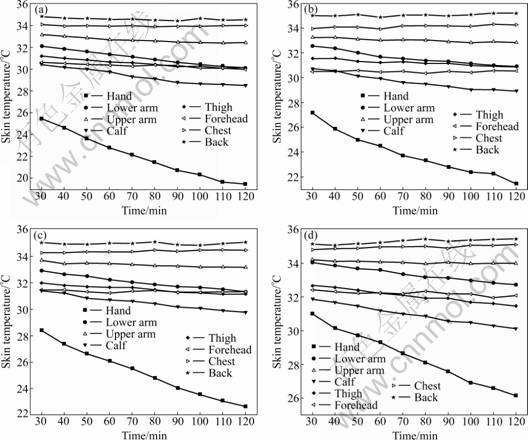
Fig.2 Measured local skin temperatures changing with time at different environmental temperatures: (a) 7.4 °C; (b) 9.1 °C; (c) 11.0 °C; (d) 15.0 °C
The time-varying characteristics of local skin temperatures give rise to the variation of mean skin temperature with time, as shown in Fig.3.
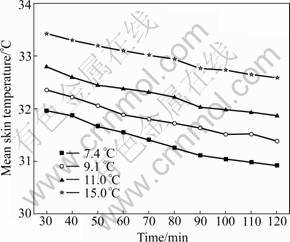
Fig.3 Mean skin temperature changes with time
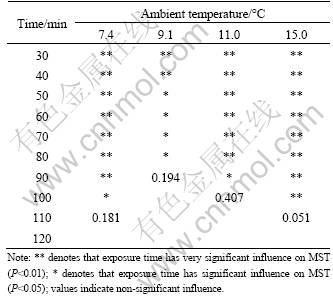
When exposed to the cold thermal environmental conditions, cold receptors under the skin are stimulated. By the regulation of central nervous system, vasoconstriction occurs, thus the blood flow is reduced and then the skin temperature decreases to reduce the radiation and convection heat loss with the environment. It will take a little time to attain a steady state. Repetitive measure analysis of variance (ANOVA) is shown in Table 3, which points out that the exposure time is one of the important factors that affect the heat exchange between human body and thermal environment. When entering the cold thermal environment, the body will make dynamic thermoregulation, which needs certain time to make mean skin temperature achieve stability. It takes 120 min for MST to approach a primary stable state in this study (P>0.05) and it is suggested that the experiments in cold thermal environmental conditions need 2 h to fully consider the heat exchange between human body and the thermal environment.
Table 3 Repetitive measure ANOVA of mean skin temperature
3.3 Temperature-varying characteristics of local skin temperature and mean skin temperature
The average values of the local skin temperatures during 30-120 min under different ambient temperatures are plotted in Fig.4. Two results about local skin temperatures can be obtained from this figure.
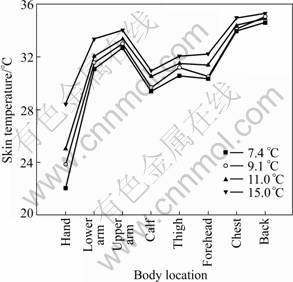
Fig.4 Local skin temperatures under different ambient temperatures
Firstly, local skin temperatures in different parts of body are not uniform in the same environment. Skin temperatures of the trunk (chest, back) are much higher than the extremities (hand, lower arm, upper arm, calf and thigh). Hands far away from the core part of body and exposed directly to the cold air environment have the lowest skin temperature. Because of the specific characteristic of hands, they were chosen as one of the mainly study objects in this study.
Secondly, the effect of air temperature on skin temperature is notable. Multiple comparisons of local skin temperatures indicate that skin temperatures under cold environmental conditions are significantly different (P<0.05), excluding chest and back near the heart. In other words, skin temperature is sensitive to ambient temperatures.
Figure 5 plots the relationship between mean skin temperature (the average value of 30-120 min) and ambient temperature in this experiment. It shows that mean skin temperature will markedly increase while the ambient temperature rises in the cold thermal environmental conditions. Mean skin temperature will be easily influenced by the ambient temperature.
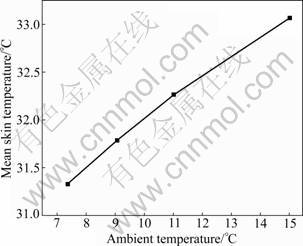
Fig.5 MST changing with ambient temperature
3.4 Time-varying characteristics of local thermal sensation and overall thermal sensation
The time-varying characteristics of skin temperature show that this is a non-thermal equilibrium cold environment, where the thermal sensation has the similar time-varying trend with skin temperature. Local thermal sensation decreases with the exposure time, including the trunk under low temperature thermal environment. Figure 6 is one example of the local thermal sensation varying with the exposure time.
As shown in Fig.7, overall thermal sensation also decreases with the exposure time under non-thermal equilibrium cold environmental conditions.
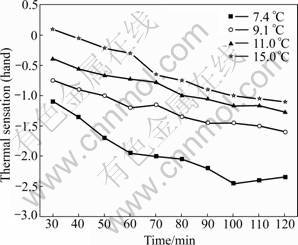
Fig.6 Local thermal sensation (hand) changing with time
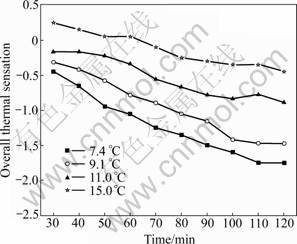
Fig. 7 Overall thermal sensation changing with time
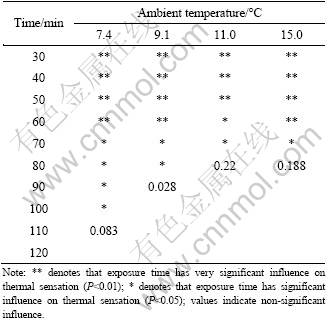
Table 4 gives the repetitive measure ANOVA of overall thermal sensation, which indicates that exposure time is one of the most important factors that affect thermal comfort. With the establishment of human thermal equilibrium, thermal sensation approaches to a steady state. In this study, overall thermal sensation reaches stable within 120 min.
Table 4 Repetitive measure ANOVA of overall thermal sensation
3.5 Temperature-varying characteristics of local thermal sensation and overall thermal sensation
Figure 8 plots the average values of local thermal sensation of different body parts with exposure time from 30 min to 120 min. Because of the different distribution of cold receptors [17], thermal sensation in different parts of body is not uniform under non-thermal equilibrium cold environmental conditions. Hand is the coldest part of body. On the other hand, thermal sensation in the same body section is significantly different under 7.4, 9.1, 11.0 and 15.0°C (P<0.05). Multiple comparisons of thermal sensation under different ambient temperatures show that thermal sensation is easily influenced by air temperature in the cold thermal environmental conditions.
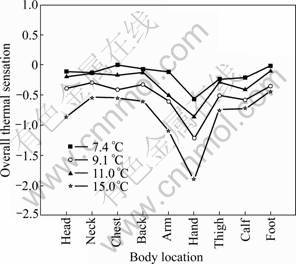
Fig.8 Local thermal sensation under different ambient temperatures
Figure 9 plots the relationship between overall thermal sensation (the predicted PMV and the real TSV) and ambient temperatures in this experiment. TSV in Fig.9 is the average of overall thermal sensations of the measurement in each condition. It shows that overall thermal sensation is significantly influenced by ambient temperature in cold thermal environmental conditions. However, the four experimental points are much higher than the values of PMV, which points out that the PMV model underestimates the real thermal sensation under non-thermal equilibrium cold thermal environmental conditions.
FANGER’s PMV model to predicted thermal sensation is based on the heat balance equation [7]. It is suitable for steady-state thermal environment that requires human body under thermal equilibrium condition. The PMV keeps constant during the exposure when the six variables in the calculation of PMV index keep constant, which indicates that PMV is an index without considering the influence of exposure time. Although it is the average value of TSV during the whole exposure in Fig.10, the PMV underestimates real thermal sensation at least 0.5 units.
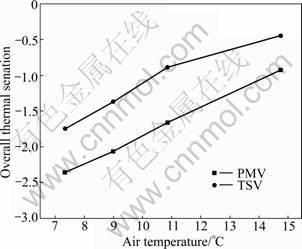
Fig.9 Overall thermal sensation under different ambient temperatures
From the mechanism of heat exchange, thermal exchange variables, the sensible heat loss through convection and radiation are closely related to skin temperature, which is typically expressed in terms of environmental factors (air temperature, velocity, relative humidity and mean radiant temperature). However, the above experimental results show that skin temperature changes with time in the non-thermal equilibrium environment. This involves the dynamic thermo- regulation process of body. Considering of the thermoregulatory process, thermal sensation in the cold thermal environmental conditions is not only the function of thermal environmental parameters, but also the exposure time, which cause the usually used PMV index not suitable in the non-thermal equilibrium conditions.
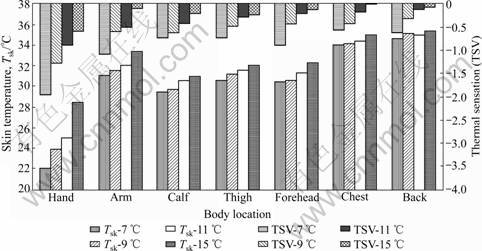
Fig.10 Skin temperatures and thermal sensation under different air temperatures
3.6 Relationship between thermal sensation and skin temperature
The experimental results show the similar variation between skin temperature and thermal sensation. Both of them have the temperature-varying characteristics and time-varying characteristics. McINTYRE [18] found that the cold perception depends on skin temperature. Humans feel cold or warm through nerve endings’ temperature of the skin rather than air temperature. In practice, air temperate is an easy way to predict thermal sensation. However, the results show that thermal sensation is influenced not only by ambient air temperature but also the exposure time under non-thermal equilibrium cold thermal environmental conditions. What’s the relationship between the thermal sensation and skin temperature?
Figure 10 plots the relationship between the average value of local thermal sensation and the average value of local skin temperature during the measured 90 min. Skin temperatures from different sites of the body are presented in the lower part and local thermal sensations are plotted in the upper part. It indicates that the non-quantitative relationship exists between thermal sensation and skin temperature: the lower the skin temperature is, the colder the subjects feel. Thermal sensation is closely related to skin temperature and skin temperature is an effective indicator of thermal sensation. How about the quantitative relationship?
As shown in Fig.11, when the mean skin temperature ranges from 30.9 to 33.5 °C, thermal sensation has a strong linear relationship in the process of human thermal equilibrium, and then the following regression lines came out:
VTS=0.797 1Tsk-26.387 (R2=0.901 2) (3)
where VTS is the thermal senstation.
This regression model considers both ambient temperature and the exposure time. As mentioned above, as long as the subjects do not reach the thermal equilibrium state, the PMV model cannot be used for predicating the thermal sensation. Skin temperature is an index involving environmental parameters and exposure time that can indicate thermal sensation well.
When VTS=0, the subjects feel themselves thermal neutral at mean skin temperature of 33.1 °C. The other studies pointed out that the thermoneutral mean skin temperature in the winter of Finland is (33.0±0.1) °C [19], and 33.2 °C in hot-humid area of China [20]. There is no significant difference of mean skin temperature in areas when humans feel neutral. The linear relationship between mean skin temperature and overall thermal sensation is also consistent with the results of other researchers. ZHANG [2] showed that overall sensation is roughly a linear function of mean-skin temperature between 29 and 34 °C. CHEN et al [20] also indicated the linear relationship when the mean skin temperature is between 29.7 and 33.8 °C. These regressions make the evaluation of thermal sensation in cold thermal environmental conditions more objective and scientific.
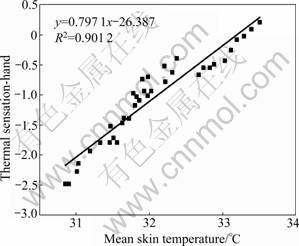
Fig.11 Regression of overall thermal sensation on mean skin temperature
4 Conclusions
1) The mean skin temperature is significantly influenced by the ambient temperature under cold thermal environmental conditions. The mean skin temperature decreases gradually with the exposure time under the non-thermal equilibrium cold environmental conditions. In this work, the mean skin temperature reaches stability in 120 min.
2) The thermal sensation is sensitive to cold air temperature. Exposure time is an important factor affecting thermal sensation. Thermal sensation decreases with the exposure time and finally approaches to a stable state after the establishment of human thermal equilibrium. In this work, overall thermal sensation reaches stability in 120 min.
3) Ambient temperature and exposure time should be comprehensively considered in the study field of thermal comfort. It is recommended that the exposure time of experimental study under cold environmental conditions is no less than 120 min.
4) The PMV model underestimates the real thermal sensation in the process of establishing human thermal equilibrium. The real thermal sensation is not only influenced by the ambient temperature but also the exposure time under dynamic cold environmental conditions.
5) Under the non-thermal equilibrium cold environmental conditions, the skin temperature is an effective indicator of thermal sensation. A strong linear relationship between overall thermal sensation and mean skin temperature is obtained.
References
[1] GAGGE A P, STOLWIJK J A J, HARDY J D. Comfort and thermal sensations and associated physiological responses at various ambient temperatures [J]. Environment Research, 1967, 1(1): 1-20.
[3] LIU Hong, LI Bai-zhan, CHEN Liang, TAN Mei-lan, MA Xiao-lei. Impact of indoor temperature and velocity on human physiology in hot summer and cold winter climate in China [C]// Proceedings of Clima 2007 WellBeing Indoors. Finland, 2007: 501-509.
[4] LI Bai-zhan, LI Wen-jie, LIU Hong, TAN Mei-lan, MA Xiao-lei. Physiological expression of human thermal comfort to indoor operative temperature in the non-HVAC environment [J]. Indoor and Built Environment, 2010, 19(2): 221-22.
[6] ZHENG Jie, ZHANG Yu, Yao Run-ming. Impact of indoor thermal comfort on physiological parameters of human body [J]. Journal of Central South University of Technology, 2009(S1): 24-27.
[7] FANGER P O. Thermal comfort [M]. Copenhagen: Danish Technical Press, 1970: 110-133.
[8] FERIADI H, WONG N H. Thermal comfort for naturally ventilated housed in Indonesia [J]. Energy and Buildings, 2004, 36: 614-626.
[9] ZHOU Xiang. Effect factor predicted index of human thermal sensation in neutral-hot environment [D]. Beijing: Tsinghua University, 2008. (in Chinese)
[11] ASHRAE. 2009 ASHRAE handbook-fundamentals [M]. Atlanta: American Society of Heating, Refrigerating and Air Condition Engineers, Inc, 2009: 9-19.
[16] LIU Hong. Thermal comfort in indoor dynamic environment in Chongqing [D]. Chongqing: Chongqing University, 2009: 99-101. (in Chinese)
[17] ZHU Ying-xin. Built environment [M]. Beijing: China Architecture and Building Press, 2005: 98-99.
[18] MCINTYRE D A. Indoor climate [M]. London: Applied Science Press, 1980: 68-69.
[20] CHEN Hui-mei, ZHANG Yu-feng, WANG Jin-yong, MENG Qing-lin. Human thermal comfort research in hot-humid area of China (1): Experimental methods and results [J]. HV&AC, 2010, 40(3): 83-89. (in Chinese)
Foundation item: Project(50838009) supported by the National Natural Science Foundation of China
Received date: 2011-01-09; Accepted date: 2011-05-23
Corresponding author: LIU Hong, PhD, Associate Professor; Tel: +86-13658362006; E-mail: liuhong1865@163.com

