Abstract: The quench sensitivity of 6005A alloy was studied using TTP (time―temperature―properties) diagrams plotted by HB and σb values and transmission electron microscopy (TEM). The results show that the nose temperatures of TTP curves are about 370℃. The quench sensitivity at low temperature is quite lower than that at moderate temperature, but is much higher than that at high temperature. It is concluded that, in the industrial production of section material, the outlet temperature after on-line extruding should be higher than 480℃, air-cooling time from 480℃ to critical temperature (400℃) should be shorter than 60s and the quench rate should be quick enough through moderate temperature. It is ascribed to the fact that supersaturated solid solution decomposes into equilibrium phase Mg2Si continuously with increasing isothermal time so that the strengthening effect decreases. It suppresses the formation of major strengthening phase β' and is detrimental to mechanical properties of 6005A alloy.
The quench sensitivity of 6005A alloy was studied using TTP (time-temperature-properties) diagrams plotted by HB and σ b values and transmission electron microscopy (TEM). The results show that the nose temperatures of TTP curves are about 370 ℃. The quench sensitivity at low temperature is quite lower than that at moderate temperature, but is much higher than that at high temperature. It is concluded that, in the industrial production of section material, the outlet temperature after on-line extruding should be higher than 480 ℃, air-cooling time from 480 ℃ to critical temperature (400 ℃) should be shorter than 60 s and the quench rate should be quick enough through moderate temperature. It is ascribed to the fact that supersaturated solid solution decomposes into equilibrium phase Mg 2Si continuously with increasing isothermal time so that the strengthening effect decreases. It suppresses the formation of major strengthening phase β ' and is detrimental to mechanical properties of 6005A alloy.
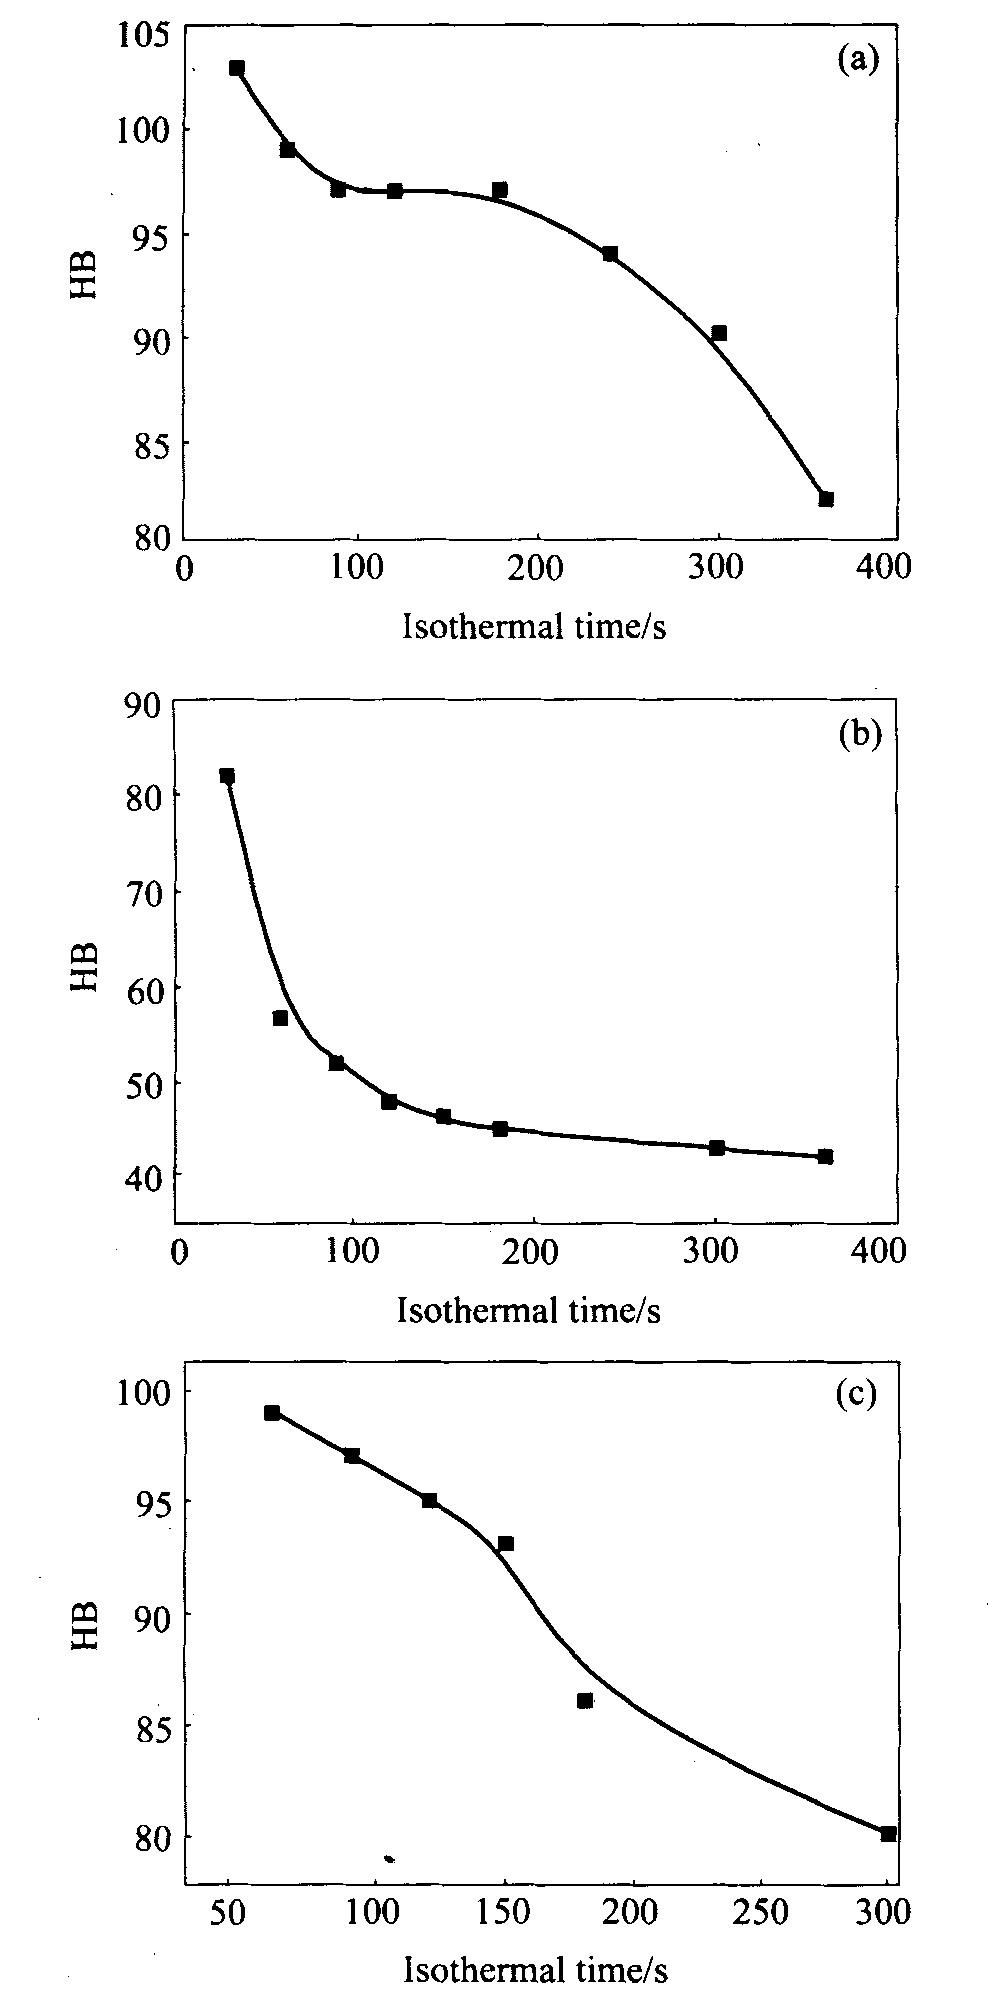
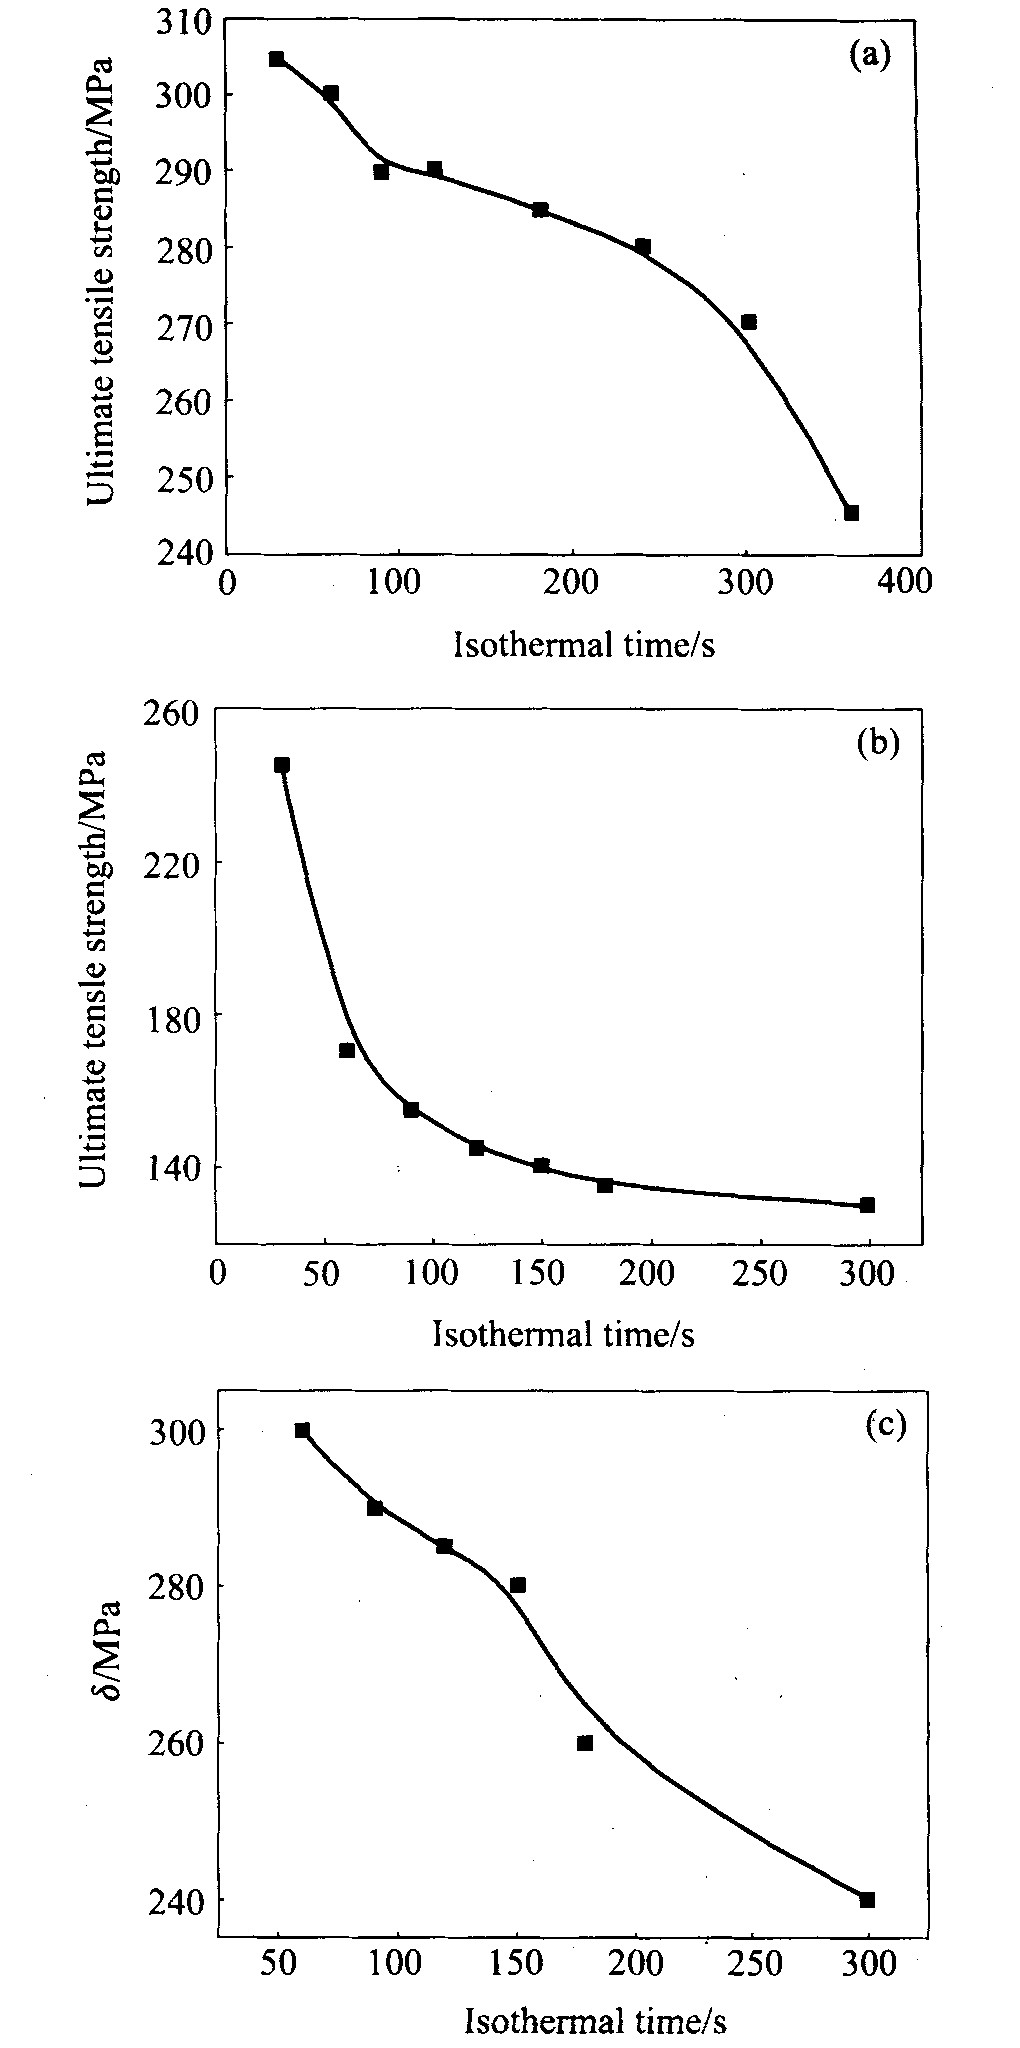
图3 6005A合金TTP曲线 Fig.3 TTP curves of 6005A (a)―σ b; (b)―HB
图4 实验合金不同等温处理状态的典型透镜衍衬像 Fig.4 Typical TEM images under different isothermal treatments (a), (b)―Solution treated at 550 ℃ for 1 h, then isothermal treated at 390 ℃ for 30 s; (c)―Solution treated at 550 ℃ for 1 h, then isothermal treated at 390 ℃ for 60 s; (d)―Solution treated at 550 ℃ for 1 h, then isothermal treated at 390 ℃ for 120 s