J. Cent. South Univ. Technol. (2011) 18: 1299-1303
DOI: 10.1007/s11771-011-0836-x
Effect of absorption boundary layer on nonlinear flow in low permeability porous media
WANG Xue-wu(王学武)1, 2, YANG Zheng-ming(杨正明)1, 2,
QI Ya-dong(齐亚东)1, 2, HUANG Yan-zhang(黄延章)1, 2
1. Institute of Porous Flow and Fluid Mechanics, Chinese Academy of Sciences, Langfang 065007, China;
2. Langfang Branch, Petro China Exploration and Development Research Institute, Langfang 065007, China
? Central South University Press and Springer-Verlag Berlin Heidelberg 2011
Abstract: Taking low permeability cores of Daqing oilfield for example, the flow characteristics at low velocity were studied with the self-designed micro-flux measuring instrument. Considering the throat distribution and capillary model, the thickness of fluid boundary layer under different pressure gradients was calculated, and the mechanism and influencing factors of nonlinear percolation were discussed. The results show that the percolation curve of ultra-low rocks is nonlinear, and apparent permeability is not a constant which increases with pressure gradient. The absorption boundary layer decreases with the increase of pressure gradient, and changes significantly especially in low pressure gradient, which is the essence of nonlinear percolation. The absorption boundary layer is also found to be impacted by the surface property of rocks.
Key words: low permeability reservoirs; percolation; absorption boundary layer; capillary model
1 Introduction
Low permeability reservoir is a relatively indistinct concept, which has not been strictly and precisely defined throughout the world yet. However, when the reservoir permeability is lower than 10-2 μm2, it must be a low permeability reservoir. The oil and gas resources preserved in low permeability reservoir are so abundant and are extensively distributed all over the world. Especially in China, the production of low permeability reservoir accounts for about 20% [1].
Due to the differences of the pore structure characteristics, the fluid flow in low permeability reservoirs obviously differs from that in medium and high permeability reservoirs. Because the throat radius of low permeability is small, and fluids are under the effect of surface molecules force, the relationship between pressure gradient and velocity is nonlinear at low velocity, and the use of Darcy’s law in low velocity environment is inaccurate [2].
Darcy’s law, the basis for much of our understanding of fluid flow in porous media, is a classic example of a scientific paradigm, because it has been used so successfully in the study of a wide variety of phenomena. However, in the 20th century, the research results indicated that the flow of water and oil in soil, sand, porous ceramics, and underground reservoirs did not follow Darcy’s law but behaved as a non-Darcy fluid, i.e., the percolation velocity and pressure gradient in the percolation movement expression showed nonlinear relation.
In 1919, MILLER-BROWNLIE [3] reported the studies of aquifers in India’s Punjab. He found that there was no flow in certain aquifers unless the gradient exceeded a threshold value. In 1954, von ENGLEHARDT and TUNN [4] observed pre-Darcy flow in a series of careful tests on consolidated rock samples taken from German oil reservoirs. In 1958, IRMAY [5] showed that Darcy’s law could be derived theoretically from the fundamental Navier-Stokes equations for fluid flow. In 1966, DUDGEON [6] reported a series of tests done in Australia, and observed pre-Darcy, Darcy, and post- Darcy flow regimes. BASAK [7] reviewed a number of studies reported in the soil science literature of the decade around 1970 and developed a classification scheme for flow regimes, and he also observed pre- Darcy, Darcy, and post-Darcy behaviors. In 1971, RUSSELL and SWARTZENDRUBER [8] presented some intriguing results from a very carefully performed set of experiments where water flowed through a variety of unconsolidated porous media. They found departures from Darcy’s law at low velocities with different mixtures of sand and silt, or with mixtures of sand, silt and clay. In 1973, CARVER [9] also reported tests involving the low velocity flow of water in unconsolidated sands and silts. He also found various departures from Darcy’s law at low superficial velocities. KECECIOGLU and JIANG [10] reported in 1994 the tests on the flow of water through beds of glass beads. Their procedures covered a very wide range of superficial velocities, and they observed four different flow regimes: pre-Darcy, Darcy, forchheimer and turbulent. Deviations from Darcy’s law in the pre-Darcy flow regime were complex. In 1999, PRADA and CIVAN [11] observed threshold gradients while flowing brine through core samples from consolidated rock at superficial velocities down to about 1.2 m/d. In 2006, WANG et al [12] tested the flow of heavy oil flow through porous media at the reservoir, and observed threshold gradients. In 2008, HAO et al [13] used simulated oil, formation water, injected water, and distillated water as fluids to measure and analyze the threshold pressure gradient for both single- and two-phase fluid flow.
Although there are lots of publications on describing nonlinear flow at low velocity, it seems that there is significant difference of nonlinear flow characteristic tested. The reason lies in the different understanding of the mechanism of nonlinear flow. Therefore, the flow characteristics at low velocity are studied by using self-designed micro-flux measuring instrument and the essence of nonlinear percolation is analyzed in this work.
2 Experimental
2.1 Material and equipment
The cores in the experiment are from Gulong Sag, Songliao Basin. Table 1 lists the petrophysical properties of the cores. The salinity of formation water is 6.0 g/L and the viscosity is 1.005 mPa・s.
Table 1 Petrophysical properties of core
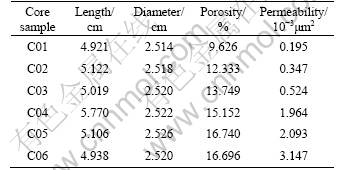
Figure 1 shows a schematic representation of the flow apparatus used in this work. This apparatus included a gas tank, an intermediate container, a pressure transducer, a coreholder, an automatic pump and a micro-flux measuring instrument.
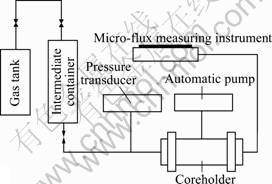
Fig.1 Schematic diagram of experimental setup
The coreholder and intermediate container were made of stainless steel which was capable of overburdening pressure up to 30 MPa. The automatic pump was employed to provide a confining pressure for core. The micro-flux measuring instrument, which integrated a glass micro-tube with inner diameter of 1 mm and an electronic digital vernier caliper, can be used to measure the movement distance of liquid level by photoelectric sensor. Therefore, the liquid flow rate could be calculated.
2.2 Experimental procedure
After washing and drying the cores, the porosity and permeability were tested, and then the cores were saturated by salt water. After establishing 100% water saturation, the core was placed into the coreholder, and confining pressure was loaded.
The pressure gradient of core was adjusted by the valve of gas tank. When the percolation velocity at the export end of the rock sample reached a stable state under a specific constant displacing pressure, the movement distance of liquid level and the time were recorded at different pressure gradients, and the velocity was calculated. Based on the pressure gradient and percolation velocity, the percolation curve was drawn.
3 Characteristics of nonlinear percolation
Fluid flow in low permeability rock is nonlinear at low pressure gradient. With the increase of pressure gradient, the relationship between velocity and pressure gradient tends to be linear. Under the fine and stable experimental condition, the relation curve between velocity and pressure gradient is not obvious (Fig.2). Using the data of velocity and pressure gradient, the apparent permeability (Kapp) can be calculated. With the increase of pressure gradient, the apparent permeability increases, and tends to be a certain value (K). Figure 3 shows the relationship between Kapp/Kmax and pressure gradient. At low pressure gradient, the variation of the apparent permeability is obvious; therefore, the nonlinear flow law exists at low velocity.
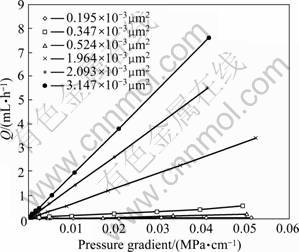
Fig.2 Percolation curves of cores with different permeabilities
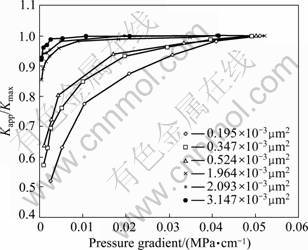
Fig.3 Relationship between Kapp/Kmax and 
4 Mechanism of nonlinear percolation
The pore system of low permeability cores consists of different sizes of small throats, the clay content of cores is high, and the specific surface is large; therefore, the force on solid/liquid interface is strong. As POLUBARINOVA-KOCHINA [14] pointed out, water is a polar molecule which tends to orientate itself in an electrostatic field, as can be found at a surface, especially with certain clays. Static water molecules can become oriented around surfaces, forming a quasi-crystalline structure that effectively narrows the pores or completely occludes them. As large pressure gradient is applied to the water in the porous medium, the weak intermolecular bonds holding this quasi-crystalline water structure in place are progressively overcome. Then, the area of flow channels in the medium becomes a function of fluid velocity. The nominal permeability of the medium increases with superficial velocity until the quasi- crystalline water structures are all broken down and Darcy linearity is obtained.
XU and XUE [15] and LI and HE [16] found the absorption bound water in single micro-tube experiment, and the thickness of bound water decreased with pressure gradient increasing. The existence of bound water decreases the permeability of cores, and affects the flow state, which results in nonlinear flow characteristic, and makes the permeability measured by salt water (Kw) lower than that measured by gas (Kg). With the decrease of the permeability of the core, the ratio of Kg/Kw tends to increase (Fig.4), which indicates that the lower the permeability of core is, the higher the percentage of the bound water accounts for the volume of throats. Therefore, combining the macro throat distribution, the changing law of thickness of bound water with pressure gradient can be calculated, and the mechanism of nonlinear flow can be analyzed.
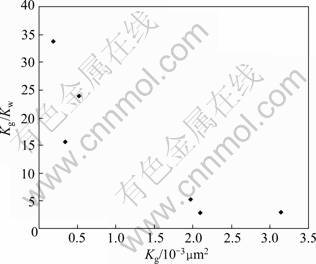
Fig.4 Relationship between Kg/Kw and permeability
4.1 Throat distribution
The constant-rate mercury injection technique is operated by the injection of mercury into the core sample at ultra-low velocity (10-6 mL/s). The capillary pressure of monitors changes as the mercury meniscus moves from pore throats to pore bodies. The meniscus moves in sudden steps, called Haines jumps, which are measured as the mercury pressure decreases. Decreases in mercury pressure are referred to as rheons, and it has been shown that rheons partition a rock’s pore space into two sections: pore bodies and pore throats (Fig.5).
Six core samples of low permeability were tested by constant-rate mercury injection, and the micro throat distribution was obtained (Fig.6). The results of the experiment indicate that the throat distributions of different permeability cores are greatly different, and the throat distribution is the main factor that controls the percolation ability.
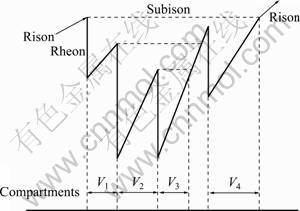
Fig.5 Pressure fluctuation of constant-rate mercury injection
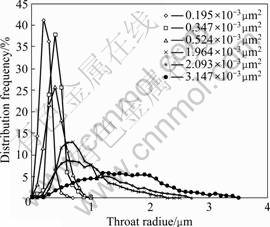
Fig.6 Throat distribution of cores
4.2 Capillary model
Based on the micro throat distribution, it is assumed that the core consists of different sizes of capillaries (Fig.7), and there is bound water at the surface of capillaries (Fig.8). According to Poiselle’s equation, the flow rate of core can be expressed by
 (1)
(1)
where Q is the flow rate, Dp is the pressure gradient, ni is the capillary number, ri is the radius of throat, m is viscosity of fluid, and Dr is the thickness of bound water.
There is no interaction between medium and gas, and the absorption bound layer does not exist; therefore, all throats of different sizes contribute to permeability. When liquid flows in porous media, not all the throats contribute to permeability. It is only when the radius of throats is larger than the thickness of bounder water, the throats are effective, and the effective radius of throat is the difference of the thickness of bound water and the actual radius. Therefore, according to the ratio of Kg to Kw (Eq.(2)) at different pressure gradients, the thickness of bound water can be calculated:
 (2)
(2)
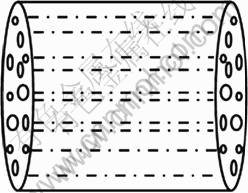
Fig.7 Schematic diagram of capillary model
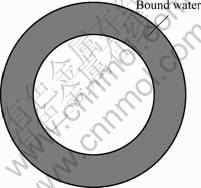
Fig.8 Schematic diagram of absorption boundary layer
Obtained from Fig.9, with the increase of pressure gradient, the thickness of bound water (Hb) decreases. It is indicated that more small throats and bound water of large throats are involved in flowing, and the permeability increases. The thickness of bound water decreases rapidly with the increase of pressure gradient at low pressure gradient, and decreases slowly at high pressure gradient. With the increase of pressure gradient, the thickness of bound water tends to be a certain value, and the conclusion is unanimous with the results of single micro-tube flow experiment, which shows nonlinearity at low pressure gradient on percolation curve. With the increase of pressure gradient, the relationship between velocity and pressure gradient tends to be linear.
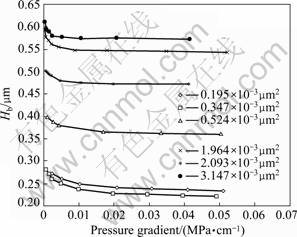
Fig.9 Relations between Hb and
There is bound water in different permeability cores, but the throat of low permeability core is small and distribution-centralized, and bound water accounts for a large proportion of the volume of throat; therefore, the ratio of Kg/Kw is large, and it shows high degree of nonlinear flow. The throat of high permeability distributes widely, large throat exists, and bound water accounts for a small proportion of the volume of throat; therefore, the ratio of Kg/Kw is small, and it shows low degree of nonlinear flow (Fig.10).
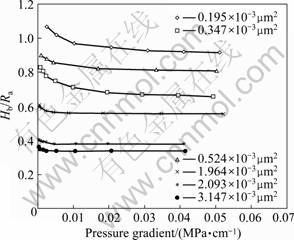
Fig.10 Relations between Hb/Ra and
The gas permeability and throat distribution of C04 and C05 are similar to each other, but the thickness of bound water of C04 is larger than that of C05. According to nuclear magnetic resonance test [17], compared with the movable fluid which characterizes the interaction between medium and fluid of two cores, the movable fluid saturation of C05 is larger than that of C04. Therefore, apart from the throat distribution, the surface property is another important factor that influences the thickness of bound water.
5 Conclusions
1) The fluid flow in low permeability rock is nonlinear at low velocity. The apparent permeability changes with pressure gradient. With the increase of the pressure gradient, the apparent permeability increases, and tends to be a certain value.
2) The permeability of low permeability core measured by salt water is less than that measured by gas, which indicates the existence of bound water. With the decrease of permeability, the ratio of Kg/Kw tends to increase, indicating that the percolation influenced by bound water is more obvious.
3) Considering throat distribution, combined with capillary model, the thickness of fluid boundary layers with different pressure gradients is calculated. With the increase of pressure gradient, the thickness of boundary layer decreases, and it is obvious at low velocity, which is the essence of nonlinear percolation.
4) Except for throat distribution, the surface property is another important factor that influences the thickness of bound water, and then affects the nonlinear percolation law.
References
[1] WANG Dao-fu. Ordos basin extra-low permeability oilfield development [M]. Beijing: Petroleum Industry Press, 2007: 1-3. (in Chinese)
[2] HUANG Yan-zhang. Fluid mechanics in low-permeability reservoir [M]. Beijing: Petroleum Industry Press, 1998: 80-86. (in Chinese)
[3] MILLER-BOWNLIE T A. Subsoil water in relation to tube wells [J]. Indian & Eastern Engineer, 1919, 42(2): 116-131.
[4] von ENGELHARDT W, TUNN W L M. The flow of fluids through sandstones [J]. Heidelberger Beitrage zur Mineralogie und Petrographie, 1954, 2(1): 12-25.
[5] IRMAY S. On the theoretical derivation of darcy and forchheimer formulas [J]. J Geophys Res, 1958, 64(4): 485-486.
[6] DUDGEON C R. An experimental study of the flow of water through coarse granular media [J]. La Houille Blanche, 1966, 21(7): 785-801.
[7] BASAK P. Non-Darcy flow and its implications to seepage problems [J]. Journal of the Irrigation & Drainage Division, American Society of Civil Engineers, 1970, 103(4): 459-473.
[8] RUSSELL D A, SWARTZENDRUBER D. Flux-gradient relationships for saturated flow of water through mixtures of sand, silt, & clay [J]. Soil Science Society of America Proceedings, 1971, 35(1): 21-26.
[9] CARVER R E. Studies on the validity of Darcy’s law for flow in natural sands [R]. Technical Completion Report USDI/OWRR Project No. A-037-GA, University of Georgia, Athens GA, 1973.
[10] KECECIOGLU I, JIANG Y. Flow through porous media of packed spheres saturated with water [J]. Journal of Fluids Engineering-Transactions of the American Society of Mechanical Engineers, 1994, 116(1): 164-170.
[11] PRADA A, CIVAN F. Modification of Darcy’s law for the threshold pressure gradient [J]. Journal of Petroleum Science & Engineering, 1999, 22(4): 237-240.
[12] WANG Shao-jun, HUANG Yan-zhang, CIVAN F. Experimental and theoretical investigation of the Zaoyuan field heavy oil flow through porous media [J]. Journal of Petroleum Science and Engineering, 2006, 50(2): 83-101.
[13] HAO Fei, CHENG Lin-song, HASSAN O, HOU J, LIU C Z, FENG J D. Threshold pressure gradient in ultra-low permeability reservoirs [J]. Petroleum Science and Technology, 2008, 26(9): 1024-1035.
[14] POLUBARINOVA-KOCHINA P Y. Theory of ground water movement [M]. Princeton N J: Princeton University Press, 1962: 20- 24.
[15] XU Shao-liang, YUE Xiang-an. Experimental research on nonlinear flow characteristics at low velocity [J]. Journal of China University of Petroleum: Natural Science Edition, 2007, 31(5): 60-63.
[16] LI Zhong-feng, HE Shun-li. Influence of boundary layers upon filtration law in low-permeability oil reservoirs [J]. Petroleum Geology & Oilfield Development in Daqing, 2005, 24(2): 57-59. (in Chinese)
[17] COATES G R, XIAO L Z, PRAMMER M G. NMR logging principles and applications [M]. Texas: Gulf Publishing Company, 1999: 7.
(Edited by YANG Bing)
Foundation item: Project(2008ZX05013) supported by the National Science and Technology Project of China; Project(10672187) supported by the National Natural Science Foundation of China
Received date: 2010-04-30; Accepted date: 2011-01-22
Corresponding author: WANG Xue-wu, PhD; Tel: +86-10-69213407; E-mail: wangxuewu@163.com

