A model of deformation of thin-wall surface parts during milling machining process
��Դ�ڿ������ϴ�ѧѧ��(Ӣ�İ�)2018���5��
�������ߣ������� �ƺ�� Rae W. West ���� �ż���
����ҳ�룺1107 - 1115
Key words��thin-walled surface parts; milling force; elastic deformation; finite element model
Abstract: A three-dimensional finite element model was established for the milling of thin-walled parts. The physical model of the milling of the part was established using the AdvantEdge FEM software as the platform. The aluminum alloy impeller was designated as the object to be processed and the boundary conditions which met the actual machining were set. Through the solution, the physical quantities such as the three-way cutting force, the tool temperature, and the tool stress were obtained, and the calculation of the elastic deformation of the thin-walled blade of the free-form surface at the contact points between the tool and the workpiece was realized. The elastic deformation law of the thin-walled blade was then predicted. The results show that the maximum deviation between the predicted value and the actual measured machining value of the elastic deformation was 26.055 ��m; the minimum deviation was 2.011 ��m, with the average deviation being 10.154 ��m. This shows that the prediction is in close agreement with the actual result.
Cite this article as: WANG Ling-yun, HUANG Hong-hui, Rae W. WEST, LI Hou-jia, DU Ji-tao. A model of deformation of thin-wall surface parts during milling machining process [J]. Journal of Central South University, 2018, 25(5): 1107�C1115. DOI: https://doi.org/10.1007/s11771-018-3810-z.

J. Cent. South Univ. (2018) 25: 1107-1115
DOI: https://doi.org/10.1007/s11771-018-3810-z

WANG Ling-yun(������)1, HUANG Hong-hui(�ƺ��)1, Rae W. WEST2,LI Hou-jia(����)1, DU Ji-tao(�ż���)1
1. Department of Manufacturing Engineering and Technology, Shanghai University of Engineering Science,Shanghai 200437, China;
2. College of Engineering, University of Nevada-Las Vegas, Las Vegas, Nevada 89154, US
 Central South University Press and Springer-Verlag GmbH Germany, part of Springer Nature 2018
Abstract: A three-dimensional finite element model was established for the milling of thin-walled parts. The physical model of the milling of the part was established using the AdvantEdge FEM software as the platform. The aluminum alloy impeller was designated as the object to be processed and the boundary conditions which met the actual machining were set. Through the solution, the physical quantities such as the three-way cutting force, the tool temperature, and the tool stress were obtained, and the calculation of the elastic deformation of the thin-walled blade of the free-form surface at the contact points between the tool and the workpiece was realized. The elastic deformation law of the thin-walled blade was then predicted. The results show that the maximum deviation between the predicted value and the actual measured machining value of the elastic deformation was 26.055 ��m; the minimum deviation was 2.011 ��m, with the average deviation being 10.154 ��m. This shows that the prediction is in close agreement with the actual result.
Key words: thin-walled surface parts; milling force; elastic deformation; finite element model
Cite this article as: WANG Ling-yun, HUANG Hong-hui, Rae W. WEST, LI Hou-jia, DU Ji-tao. A model of deformation of thin-wall surface parts during milling machining process [J]. Journal of Central South University, 2018, 25(5): 1107�C1115. DOI: https://doi.org/10.1007/s11771-018-3810-z.
1 Introduction
Complex thin-walled structures such as the metal aluminum thin-shelled parts and thin pieces used in military radar, the wings on a plane, and the turbine blades on an engine, along with other thin- walled parts are widely used as high-performance parts in aviation, aerospace, weapons, and other fields. Their manufacturing requirements are becoming more and more precise. The wings on a plane, the turbine blades on an engine, and other thin-walled parts that are large sized, have low rigidity, and need high precision surfaces that are formed using CNC milling or CNC turning. Due to their low rigidity, residual stresses, along with excessive cutting force and heat, unreasonable tool structure and cutting parameters, and other contributing factors, the workpieces of these structures are prone to deformation, and may even require scrapping in extreme cases, during the processing of these structural parts.
The finite element simulation can reveal the processing data difficult to obtain by the test methods, such as cutting force, stress, deformation, and material failure stress. At present, many scholars have used the finite element analysis method to study the deformation of thin-walled parts. ARMAREGO et al [1] and BUDAK et al [2] have developed a physical model to predict the cutting force based on the cutting mechanism. However, these researches are limited to the finite element analysis of workpiece deformation under known working conditions, and can not predict the deformation of workpiece under unknown conditions. WEINERT et al [3] used the finite element method for the calculation and analysis of the aluminum alloy structure process and the prediction of static errors during the circumferential milling of thin-walled parts. LI et al [4] established the end milling simulation model. GUO et al [5] created a finite element model for predicting the milling deformation of aerospace aluminum alloy thin-walled parts. RATCHEV et al [6, 7] founded a flexible cutting force model to predict the machining surface accuracy error of the low stiffness parts in the static simulation analysis and proposed an error compensation strategy to predict the deformation, thermal deformation and residual stress deformation caused by the cutting process.For the development direction of automation, intelligent machining is the main content of virtual manufacturing when the finite element method is used to estimate the machining error. The above preliminary conclusion provides guidance for the control of the machining accuracy of thin-walled parts. However, accurate deformation analysis depends on the exact load model of cutting force. Therefore, it is necessary to establish an accurate milling force model through the cutting force experiment. Based on the accurate iterative analysis of the machining deformation, it is possible to remove most of the residual material from the cutter.In the further precise analysis and practical application, it is necessary to consider the impact of machining tool deformation, workpiece clamping method, cutting temperature, tool wear and other factors. Through numerical control compensation, The accuracy of wall thickness of the thin-walled parts can be guaranteed in the finishing process through one machining trajectory, so as to achieve efficient, economical and high quality.
The basic problems of physical simulation of the metal cutting were discussed, including the finite element method of cutting, material constitutive model, the separation of chip and workpiece, the friction between chip and workpiece, and other related theories and methods. The physical simulation model of the milling process was established using the AdvantEdge FEM software as the platform, the aluminum alloy impeller as the object to be processed, setting up the simulation boundary conditions corresponding to the actual machining. The physical simulation model of the milling process was established. Through the solution, the physical quantities such as three-way cutting force, tool temperature and tool stress and other physical quantities are obtained. The elastic deformation of the thin-walled blade with free-form surface at different tool contact points was calculated and the elastic deformation law of the thin-walled blade was predicted by using the Ansys software.
2 Finite element model for deformation of thin-walled parts
The relevant data, such as the cutting temperature, the cutting force, the distribution of the cutting stress, and the deformation of the workpiece and the tool, can be obtained without cutting the workpiece through the reasonable modeling of the cutting process, the finite element analysis and the post-processing of the static and dynamic visualization of the numerical results .
2.1 Finite element model analysis
The milling diagram of thin-walled parts is shown in Figure 1. The workpiece material is an aluminum alloy 7075 and the wall thickness dimension, t, of the thin wall portion is 2 mm. A double-flute (two-flute) cylindrical ball head end milling cutter with a helix angle of 20�� and an front angle r0 of 5�� is used in the milling process. The tool diameter is (equal to) 5 mm; the tool material is the cemented carbide YG8; the radial milling width ap is 0.3 mm; the axial milling depth aw is 0.4 mm; the feed per minute fz is 0.15 mm; the spindle speed n is equal to 10000 r/min; the friction coefficient f is 0.3.
2.2 Generate milling cutter path (milling tool path trajectory generation)
The relevant tool parameters and machining parameters must also be set before the tool path is generated. Since the cutting allowance of the blade finishing is small, the ball head milling cutter with a radius of 5 mm is used for milling. The residual height parameter is set to 0.01 mm, the number of machining tool tracks is 14, and the string height error is 0.005 mm, as shown in Figure 2.

Figure 1 Schematic diagram of thin-walled parts milling simulation

Figure 2 Milling tool path
In order to obtain the deformation of a single blade using the milling simulation, the direction of the blade leading edge to the trailing edge is defined as U direction, and the four curves along the U direction are U lines; direction of the blade tip to the root is defined as V direction. The nine curves along the V direction are V lines. U line of the leaves and V line of the leaves were divided into 36 small pieces by the equal parameter method, as shown in Figure 3.
A series of contact point coordinates and tool axis vectors corresponding to the cutting tool movement were obtained during a five-axis CNC machining process, using the tool position data converted through the contact points of tool and workpiece, as shown in Table 1.

Figure 3 Leaf curve division
2.3 Constitutive model of workpiece material
The Johnson-Cook criterion uses the multiplication relationship of the variables to describe the effects of strain, strain rate and temperature, and is used to simulate the dynamic behavior of metal materials from low strain rates to high strain rates. Johnson-Cook guidelines are expressed as [8�C12]:

The first term in the formula describes the strain hardening effect of the material, and the second term reflects the relationship between the flow stress increasing with the logarithmic strain rate, and the third term reflects the relationship between the flow stress decreasing with the index of temperature rise, where  and Tr represent the reference strain rate and the reference temperature, respectively; Tm is the melting point of the material; A, B, n represent the material strain enhancement coefficients; c is the material strain rate enhancement coefficient; m characterizes the material heat softening coefficient [13�C15] as shown in Table 2.
Table 1 Tool center coordinates and tool axis vectors

Table 2 Material parameters of Al7075 Johnson-Cook model

A shear failure model was used to achieve separation of chips from the workpiece. The shear failure model is based on the value of the equivalent plastic strain at the integration point. When the damage parameter reaches the value one, the unit is invalid. The failure parameter is defined as follows:

In the above formula, �� is the failure parameter;  is the initial value of the equivalent plastic strain;
  is the incremental value of the equivalent plastic strain;
  is the value of the failure strain. The failure strain is set based on the following aspects, plastic strain rate, the ratio of the non-dimensional compressive stress to the partial stress p/q (p is the compressive stress and q is the Misses stress) , temperature, predefined domain variable. Here the Johnson-Cook model is used to define the failure strain.

where d1�Cd5 are the effective constants measured below the transition temperature; is the reference strain rate;
  is the plastic strain rate;
  is determined by the following formula:

In the above formula, �� is the current temperature; ��melt is the melting point; and ��transition is room temperature.
The following figure describes the stress and strain characteristics of the material when it is damaged. There are two types of failure at the materials that are isotropic and reinforced elasto-plastic: the yield degradation softening and elastic stress, as shown in Figure 4. The solid line shows that the material has undermined the response of stress and strain, and the dotted line when the damage does not exist has undermined the stress strain response.
In Figure 4, ��yo and are, respectively, the yield stress and the equivalent plastic strain when the material starts to damage. The is the equivalent plastic strain at the time of material failure at D=1. When the material fails, the equivalent plastic strain depends on the characteristic length of the element and can not be used as a criterion to describe the damage evolution of the material. On the contrary, the criterion of material damage evolution is determined by the equivalent plastic displacement  or the fracture dissipation energy Gf.

Figure 4 Stress and strain of progressive damage and deterioration
When the material begins to be damaged or failed, the stress�Cstrain curve can not accurately describe the behavior of the material. Continuing to apply the stress�Cstrain curve will result in strain concentration, which (and the curve) is too dependent on the grid drawn during modeling, so that the energy dissipated after grid densification is reduced. The Hillerborg energy failure method is proposed to characterize the failure process using a stress displacement response curve to reduce the dependence of the analysis on the grid. Using the concept of brittle fracture, Gf treated as an energy that destroys the unit is defined as the parameter of the material. In this way, the softening effect at the beginning of damage) is a stress displacement response rather than a stress�Cstrain response. The destruction of energy is expressed by the following formula:

The of above expression is an equivalent plastic displacement, which describes the yield stress for the change of the crack after the damage begins. Before the injury begins, =0. After the injury started,  where L is the unit feature length associated with the integral points, and the unit feature length is defined based on the shape of the unit collection. Plane unit length is the square root of the integral point area, while the cubic unit length is the cube root of the integral area volume. The damage evolution which is defined based on effective plastic displacement can be described as the following equation:

when the effective plastic displacement in the criterion reaches  the rigidity of the material is completely lost, and the failure grid of the model is automatically deleted. That is, the material is broken at this time and the chip begins to form.
3 Analysis of machining deformation of thin-wall parts
3.1 Establishment of force model
In order to solve the problem of machining precision control of thin-walled parts, it is necessary to establish the force model, the deformation model and NC compensation model.The key is to establish an accurate force model based on the existing literature [16�C19]. The force model of ball head cutter at point 1 was established using AdvantEdge software platform. Figure 5 shows an analysis of the milling force.

Figure 5 An analysis of milling force
3.2 Change in cutting force
By extracting the milling force data in the above-mentioned milling model in the 0.0002�C 0.003 s time frame along the x-axis, y-axis, z-axis three-way cutting force changes were drawn as shown in Figure 6. The cutting force when the section of the arc cutting edge close to the straight edge first contacts with the workpiece as the milling cutter cutting into the workpiece is mainly along z-axis positive direction.

Figure 6 Change in cutting force
As the cutter teeth gradually cut into the workpiece, the three-way cutting forces gradually increase until the cutting force reaches the maximum value for the first cut of workpiece with the cutting edge of the arc, and then the cutting forces were gradually reduced. The maximum tangential forces of the three-way cutting force appear at the same time. The maximum cutting forces of the tool on x-axis, y-axis and z-axis are �C112.56 N, �C108.43 N and 30.54 N, respectively, based on the last three peaks on the curve shown in Figure 6
Based on the data of the position of each contact point between the tool and the workpiece, the milling force analysis model was established, as shown in Table 1, and the milling force of the each contact point of the workpiece was calculated, as shown in Table 3.
Table 3 Cutting force at each contact point of tool

4 Analysis of deformation calculations
Due to the problem of elastic deformation under the milling force during the milling process of thin-walled parts, the structural static analysis can be used to calculate the deformation of thin-walled parts. Then, the geometric and physical models of the parts were established; the load and boundary conditions were applied; the parts were meshed and the finite element model was established. The effects of the change of the linear load size, the change of the position and the direction of the load, and the change of the wall thickness on the deformation of the parts are all taken into account. Analysis of thin-walled pieces with Ansys software is equivalent to simulating the deformation of the workpiece during milling process. For the integrated impellers in thin-walled blade processing, the elastic deformation occurs mainly in the semi-finishing and finishing process of the blade. Using the thin-walled blade finishing process as an example, the tool position trajectory of the blade was programmed along the U-direction parameter, and the four tool path tracks can be selected by the interval along the other V-direction parameter; nine tool contact points were selected at intervals on each tool position track; elastic deformation was calculated at each tool contact point on the blade. The blade surface mesh node was the selected tool contact point, as shown in Figure 7.
The results of the deformation at the nearest grid node of the each contact points of the tool were extracted, as shown in Table 4.
The elastic deformation prediction results of this example were represented respectively by a three-dimensional diagram, as shown in Figure 8.
Based on the elastic deformation prediction diagram, the elastic deformation of the thin-walled blade has the following rules:
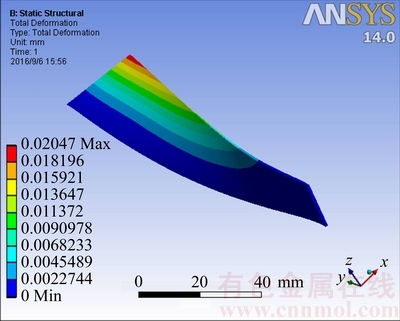
Figure 7 Calculation of deformation results
Table 4 Deformation of each tool contact point


Figure 8 Three-dimensional diagram of elastic deformation
1) All the tool contact points corresponding to the elastic variables will cause the workpiece undercut error.
2) The closer the distance to the root of the blade on the tool track is, the smaller the amount of elastic deformation of the workpiece is. The farther the distance is, the greater the amount of elastic deformation of the workpiece is.
3) For the same tool path, the elastic deformation at both ends of the tool contact points is greater than that at the middle of the tool contact points, and the elastic deformation profile is of ��U�� shape.
4) The largest deformation of the blade occurs at the intersection of the leaf top line and the intake U line.
5) The elastic deformation of the thin-walled parts in the milling process varies with the position of the milling tool. In the x-axis direction of the tool feed, when the cutter is in the two cantilever edges, the deformation is the maximum. In the z-axis of the tool feed direction, the deformation gradually increases as the milling cutter moves away from the fixed edge.
6) The accuracy of calculation of the elastic deformation is verified by measuring the error of the actual machining of the surface of the blade sample. The difference between the actual measured value and the calculated value from the 9th point to the 1st point of the 4th curve along the U direction where the deformation amount is large is 26.055, 20.332, 14.104, 9.407, 4.846, 4.11, 4.535, 7.331 and 10.203 ��m, respectively. The difference between the actual measured value and the calculated value from the 9th to the 1st point of the first curve along the U direction where the deformation amount is small is 6.753, 3.571, 3.003, 2.442, 2.153, 2.011, 2.304, 2.512 and 2.874 ��m, respectively. The average of all the differences is 10.154 ��m.
5 Conclusions
The prediction model of the average milling force concerning the inclination angle of the tool is established for the characteristics of the blade surface of the complex curved surface. The results of the model are verified by AdvantEdge software. The experimental results show that the prediction of milling force is in good agreement with the results of professional simulation software. And the deformation of thin-walled parts was calculated and the results were analyzed and evaluated.
The aluminum alloy 7075 thin-walled material milling model was established. The experimental results show that the simulation process is closer to the engineering practice than the existing finite element model. The main rules are as follows:
1) The error is less than 5% between the cutting force simulation value and the experimental value.
2) The larger displacement of the workpiece occurs at 0�C2 mm from the edge of the of the end The maximum deformation of the workpiece appears at about 0.002 mm from the processing edge of the workpiece, and the error of the machining surface is about 0.8 ��m.
3) The maximum deviation between the predicted value of elastic deformation and the measured value of actual machining is 26.055 ��m; the minimum deviation is 2.011 ��m; the average deviation is 10.154 ��m; the prediction is in good agreement with the actual result.
4) In the process of elastic deformation of thin-walled parts studied, the influence of the change of the linear load, the change of the load position and the variation of the wall thickness on the deformation of the parts were taken into account, and the deformation under different influence factors was predicted, which laid a foundation for the analysis and prediction of the deformation of thin-walled parts.
References
[1] ARMAREGO E J A, DESHPANDE N D. Force prediction models and CAD/CAM software for helical tooth milling processes III: End-milling and slot operations [J]. International Journal of Product Research, 1994, 32(7): 1715-1738.
[2] BUDAK E, ALTINTAS Y, ARMOREGO E J A. Prediction of milling force coefficients from orthogonal cutting data [J]. ASME Journal of Manufacture Science and Engineering, 1996, 118(2): 216-224.
[3] WEINERT K, BIERMANN D, KERSTING M, GR NERT S. Experimental and computational analysis of machining processes for light-weight aluminum structures [J]. Advanced Materials Research, 2008, 43: 97-104.
[4] LI Hong-qi, SHIN Y C. A comprehensive dynamic end milling simulation model [J]. Journal of Manufacturing Science and Engineering, 2006, 128(1): 86-95.
[5] GUO H, ZUO D W, WU H B, TONG G Q. Prediction on milling distortion for aero-multi-frame parts [J]. Materials Science and Engineering A, 2009, 499(1): 230-233.
[6] RATCHEV S, LIU S, HUANG W, BECKER A A. Milling error prediction and compensation in machining of low-rigidity parts [J]. International Journal of Machine Tools and Manufacture, 2004, 44(15): 1629-1641.
[7] RATCHEV S, LIU S, BECHER A A. Error compensation strategy in milling flexible thin-wall parts [J]. Journal of Materials Processing Technology, 2005, 162(10): 673-681.
[8] WANG Ling-yun, HUANG Hong-hui, Intelligent manufacturing system of impeller for computer numerical control (CNC) programming based on KBE [J]. Journal of Central South University, 2014, 21(12): 4577-4584.
[9] WANG Chun, CHENG Hao, SU Bin. Johnson cook material model and simulation experiment of aluminum alloy 6005A [J]. Advanced Materials Research, 2012, 472�C475: 510�C514.
[10] RATCHEV S, LIU Shu-long, HUANG Wei. Machining simulation and system integration combining FE analysis and cutting mechanics modeling [J] International Journal of Advanced Manufacture, 2007, 35(1): 55-65.
[11] CHEN Wei-fang, XUE Jian-bin. Deformation prediction and error compensation in multilayer milling processes fort hin-walled parts [J] International Journal of Machine Tools & Manufacture, 2009, 49(11): 859�C864.
[12] WANG Y P, HAN Chun-jie, WANG Can, LI Shi-ke. A modified Johnson�CCook model for 30Cr2Ni4MoV rotor steel over a wide range of temperature and strain rate [J]. Journal of Materials Science, 2011, 46(9): 2922�C2927.
[13] RATCHEV S, LIU S, HUANG W, BECKER A A. An advanced FEA based force induced error compensation strategy in milling [J]. International Journal of Machine Tools and Manufacture, 2006, 46(5): 542-551.
[14] SHROT A, BAKER M. Determination of Johnson-Cook parameters from machining simulations [J]. Computational Materials Science, 2012, 52(1): 298-304.
[15] EUN Y H, DONG W K, JONG Y L, LEE C S, CHEN F F. High speed pocket milling planning by feature-based machining area partitioning [J]. Robotics and Computer-Integrated Manufacturing, 2011, 27(4): 706-713.
[16] GUO H, ZUO D W, WU H B, XU F, TONG G Q. Prediction on milling distortion for aero-multi-frame parts [J]. Materials Science and Engineering A, 2009, 499(1): 230-233.
[17] YE G G, XUE S F, JIANG M Q. Modeling periodic adiabatic shear band evolution during high speed machining Ti-6Al-4V alloy [J]. International Journal of Plasticity, 2013, 40(1): 39-55��
[18] SONG Qing-hua, LIU Zhan-qiang, AI Xing, LIU Zhen-ling. Influence of chatter on machining distortion for thin-walled component peripheral milling [J]. Advances in Mechanical Engineering, 2014, Article ID329564. DOI: http:// dx.doi.org/10.1155/2014/329564.
[19] EUN Y H, DONG W K, JONG Y L, LEE C S, CHEN F F. High speed pocket milling planning by feature-based machining area partitioning [J]. Robotics and Computer-Integrated Manufacturing, 2011, 27(4): 706-713.
(Edited by YANG Hua)
���ĵ���
�����������ϳ���ӹ����ε�����Ԫģ��
ժҪ�������˱������ϳ���ӹ�����ά����Ԫģ�͡���AdvantEdge FEM����Ϊƽ̨���������ϳ��������ģ�͡������Ͻ�Ҷ��Ϊ���ӹ������趨����ʵ�ʼӹ��ķ���߽�������ͨ�����õ������������������¶ȼ�����Ӧ�������������������������污��ҶƬʵ���ڸ��������㴦�ĵ��Ա�����, Ԥ���˱���ҶƬʵ���ĵ��Ա��ι��ɡ�������������Ա���Ԥ��ֵ��ʵ�ʼӹ�����ֵ֮������ƫ��Ϊ26.055 ��m����Сƫ��Ϊ2.011 ��m��ƽ��ƫ��Ϊ10.154 ��m�������Ԥ������ʵ�ʽ��ʮ���Ǻϡ�
�ؼ��ʣ��������������ϳ���������Ա��Σ�����Ԫģ��
Foundation item: Project(U1530138) supported by the National Natural Science Foundation of China; Project(A1-8903-17-0103) supported by the Natural Science Foundation of Shanghai Municipal Education Commission, China
Received date: 2017-06-27; Accepted date: 2017-10-13
Corresponding author: WANG Ling-yun, Professor; Tel: +86�C13501979635; E-mail: Wanglyun16@sina.com; ORCID: 0000-0002- 7501-7910

