2219铝合金熔化焊焊缝中的偏析及其对力学性能的影响
来源期刊:中国有色金属学报(英文版)2017年第2期
论文作者:李权 吴爱萍 李艳军 王国庆 齐铂金 鄢东洋 熊林玉
文章页码:258 - 271
关键词:2219铝合金;熔化焊;宏观偏析;微观偏析;力学行为
Key words:2219 aluminum alloy; fusion welding; macrosegregation; microsegregation; mechanical behavior
摘 要:采用氩气保护的低频脉冲变极性氩弧焊(LPVPTIG)、氦气保护的直流氩弧焊(DCTIG)和氩气保护的高频脉冲变极性氩弧焊(HPVPTIG)等焊接方法获得了3种不同的焊缝。结果表明:由于热输入的波动,LPVPTIG焊缝存在宏观偏析带,带内聚集了粗大的共晶和显微气孔;DCTIG和HPVPTIG焊缝仅存在微观偏析,但由于焊接速度较慢,HPVPTIG焊缝Cu元素微观偏析程度低于DCTIG焊缝。力学性能测试结果表明:焊缝的力学性能随着Cu元素和气孔偏析程度的增加而降低,LPVPTIG焊缝由于存在宏观偏析带,其纵向拉伸力学性能低于横向拉伸力学性能。
Abstract: Three kinds of welds were made using low frequency pulse current variable polarity tungsten inter gas (LPVPTIG) with argon shielding, direct current TIG (DCTIG) with helium shielding and high frequency pulse current variable polarity TIG (HPVPTIG) with argon shielding, respectively. It was found that macrosegregation bands with large amount of thick continuous eutectics and microporosities formed in the LPVPTIG weld due to the fluctuation of the pulse varied heat input. Only microsegregation existed in the DCTIG weld and HPVPTIG weld. However,the HPVPTIG weld had lower extent of Cu microsegregation since its welding speed was slower. The tensile results indicated that the mechanical properties of the weld decreased with the increase of the segregation extent of Cu and porosities, and LPVPTIG weld had lower tensile properties in the longitudinal direction than those in the transverse direction due to the macrosegregation bands.
Trans. Nonferrous Met. Soc. China 27(2017) 258-271
Quan LI1,2, Ai-ping WU1,3,4, Yan-jun LI1, Guo-qing WANG5, Bo-jin QI6, Dong-yang YAN7, Lin-yu XIONG2
1. Department of Mechanical Engineering, Tsinghua University, Beijing 100084, China;
2. Capital Aerospace Machinery Company, Beijing 100076, China;
3. State Key Laboratory of Tribology, Tsinghua University, Beijing 100084, China;
4. Key Laboratory for Advanced Materials Processing Technology, Ministry of Education, Tsinghua University, Beijing 100084, China;
5. China Academy of Launch Vehicle Technology, Beijing 100076, China;
6. School of Mechanical Engineering and Automation, Beihang University, Beijing 100191, China;
7. Beijing Institute of Astronautics Systems Engineering, Beijing 100076, China
Received 3 November 2015; accepted 3 March 2016
Abstract: Three kinds of welds were made using low frequency pulse current variable polarity tungsten inter gas (LPVPTIG) with argon shielding, direct current TIG (DCTIG) with helium shielding and high frequency pulse current variable polarity TIG (HPVPTIG) with argon shielding, respectively. It was found that macrosegregation bands with large amount of thick continuous eutectics and microporosities formed in the LPVPTIG weld due to the fluctuation of the pulse varied heat input. Only microsegregation existed in the DCTIG weld and HPVPTIG weld. However,the HPVPTIG weld had lower extent of Cu microsegregation since its welding speed was slower. The tensile results indicated that the mechanical properties of the weld decreased with the increase of the segregation extent of Cu and porosities, and LPVPTIG weld had lower tensile properties in the longitudinal direction than those in the transverse direction due to the macrosegregation bands.
Key words: 2219 aluminum alloy; fusion welding; macrosegregation; microsegregation; mechanical behavior
1 Introduction
The 2219 (Al-Cu) heat treatable aluminum alloy has outstanding mechanical properties at low temperature and the most readily weldability among 2000 series aluminum alloys [1]. Because of these characteristics, 2219 aluminum alloy is widely used for the fabrication of liquid cryogenic rocket fuel tanks. Although friction stir welding (FSW) [2,3] and variable polarity plasma arc welding (VPPA) [4,5] methods have superiority on the welding of 2219 aluminum alloy, tungsten inert gas arc welding (TIG) [6-8] is still necessary on the welding of complex structure due to its good flexibility. Owing to the low mechanical properties of the TIG weld, it is usually the weakness region of the welded structure. Solidifying segregation is one important factor that affects the mechanical properties of the TIG weld.
2219 aluminum alloy contains 5.8%-6.8% Cu exceeding the maximum Cu content (5.65%) in α(Al) at the temperature of Al-Cu eutectic reaction. According to the Al-Cu binary phase diagram [9], there will be about 2.36% α(Al)+θ(Al2Cu) of eutectic generated under the equilibrium solidification condition. As is well known, the solidification process in the fusion weld is usually nonequilibrium, which results in the microsegregation of Cu. Thus, the amount of eutectic in the weld is higher than 2.36% and the Cu content in the α(Al) matrix is lower than 5.65%. For heat treatable aluminum alloys, the weld metal strength mainly depends on the solute supersaturation since it determines the subsequent aging response and the yield strength [10]. Besides microsegregation, macrosegregation may also exist in the fusion weld and affect the solute redistribution. Pulse varied heat input during welding is one of the acknowledged causes for macrosegregation. Although TIG technique is frequently used for the welding of 2219 aluminum alloy, the segregation behavior in the weld and its influence on the mechanical properties of the weld are lack of systematically study.
In this study, three kinds of welds were made using low frequency pulse current variable polarity TIG (LPVPTIG) with argon shielding, direct current TIG (DCTIG) with helium shielding and high frequency pulse current variable polarity TIG (HPVPTIG) with argon shielding, respectively. Macrosegregation and microsegregation in the welds and their influence on the mechanical properties of the welds were quantitatively investigated. Temperature contours in different welding processes were acquired by numerical simulation. The advancing processes of the solidification front and the solidus interface in the welding process were extracted according to the evolution of temperature contours. Based on these data, the segregation behavior in different welding processes was analyzed.
2 Experimental
2.1 Materials and welding
The base material used in this study was 2219-T8 aluminum alloy. T8 stands for solution heat treating, cold working and artificial aging. The filler metal was 2325 aluminum alloy. The standard chemical compositions of the base material [11] and the filler metal are listed in Table 1. The chemical compositions of the main alloy elements measured by inductively coupled plasma- atomic emission spectrometer are in the standard range. Since the filler metal almost had the same Cu content with the base material, the average Cu content in the welds was considered to be the same. Three kinds of joints were welded using different welding processes. The first one was butt welded using LPVPTIG with filler metal automatically fed into the singe-V groove. The second one was butt welded using DCTIG without filler metal. The third one was butt welded using HPVPTIG with filler metal manually fed intermittently. The dimensions of the weld plates are shown in Fig. 1. The power source for the first two welding processes was Miller Dynasty 700. The power source for HPVPTIG weld was developed by CONG et al [12]. The welding parameters for different welding processes are listed in Table 2. The pulse frequency for LPVPTIG was 0.8 Hz, while it was 40000 Hz for HPVPTIG. Figure 2(a) shows the schematic diagram of the current waveform for LPVPTIG, of which the variable polarity frequency was higher than the pulse frequency. The current waveform of the HPVPTIG was quite different from that of the LPVPTIG as shown in Fig. 2(b). The high frequency pulsed current was on the direct current electrode negative (DCEN) polarity of HPVPTIG.
2.2 Microstructure examination
The weld samples were cut from the welded plates using electro-discharge cutting machine. Then, the samples were ground by SiC paper from 400 to 2000 grift, and were mechanically polished using diamond paste. The specimen for light microscope was etched by Keller’s reagent. The specimen for electron microscope was not etched, and was observed by back scattered electron (BSE) microscopy. The samples were observed from the top section as shown in Fig. 3. Energy dispersive spectrometry (EDS, developed by Oxford Instruments) was used to analyze the element concentration of different phases in the specimens. The volume fraction of the eutectic was measured using image analysis technique (ImageJ code developed by National Institutes of Health, USA). The precipitation phase in the weld was examined using Q2000 differential scanning calorimeter (DSC).
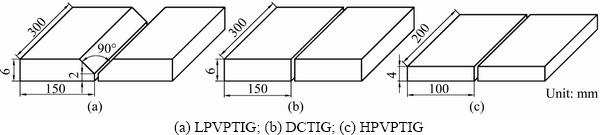
Fig. 1 Dimensions of weld plate and weld groove for different welding processes
Table 1 Chemical compositions of 2219 and 2325 aluminum alloys (mass fraction, %) [11]
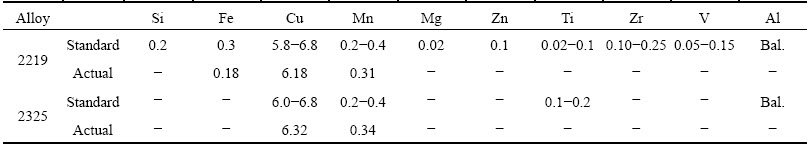
Table 2 Welding parameters for different welding processes
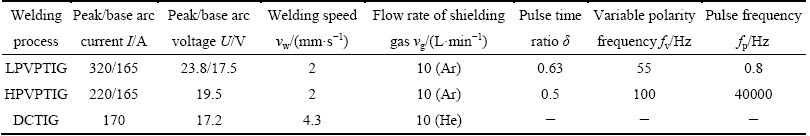
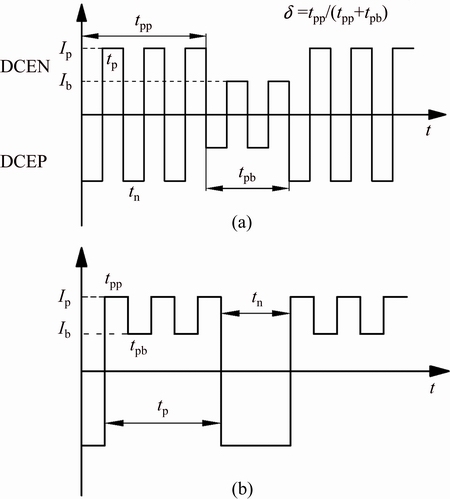
Fig. 2 Schematic diagrams of current waveform for LPVPTIG (a) and HPVPTIG (b)
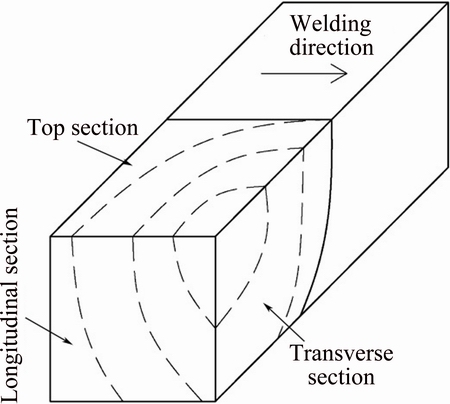
Fig. 3 Different sections of weld
2.3 Tensile test
Figure 4(a) shows the cutting positions of the longitudinal tensile specimen and transverse tensile specimen in the welded plates. Figure 4(b) shows the dimensions of the specimens based on the ISO 6982-1:2009 standard. The tensile test was carried out using an electronic universal testing machine with the tensile rate of 1 mm/min. An extensometer with a gauge length of 10 mm was used to measure the average tensile strain. Digital image correlation (DIC) technique was used to measure the strain field on the surface of the tensile specimen. The DIC device was Aramis 4M optical measuring system developed by GOM. Before the tensile test, speckles were sprayed on the measuring surface of the specimen as shown in Fig. 4(c). After the tensile test, the fracture morphology of the specimen was observed through Lyra 3 scanning electronic microscopy (SEM) developed by TESCAN.
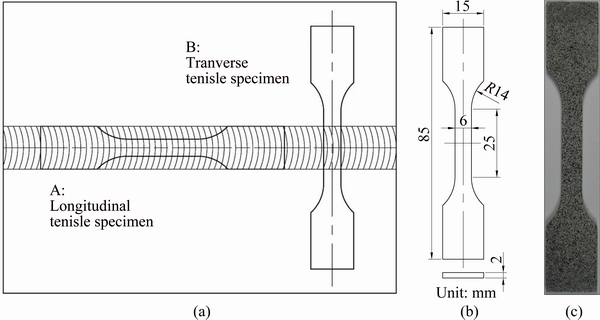
Fig. 4 Cutting positions (a) and dimensions (b) of tensile specimen and specimen with speckles on measuring surface for DIC test (c)
2.4 Numerical calculation of thermal process in welds
The microstructure of the weld is determined by the thermal process. In order to figure out the reasons for the segregation difference in the weld with different TIG welding processes, numerical calculation of the thermal processes in the welds was conducted using ABAQUS code.
2.4.1 Model of heat source
The double ellipsoid heat source model [13] was used in the numerical calculation. The power density distribution inside the front quadrant is
 (1)
(1)
Similarly, the power density distribution inside the rear quadrant is
 (2)
(2)
In Eqs. (1) and (2), Q is the effective heat input computed as ηUI (η is the thermal efficiency) for continuous arc current; ff and fr are the fractions of the heat deposited in the front and rear quadrants (ff+fr=2); a1, a2, b, and c are the parameters describing the shape of the heat source; v is the welding speed; and t is the time. For LPVPTIG welding process, Q is computed as
 (3)
(3)
where Up and Ip are the peak arc voltage and peak arc current; Ub and Ib are the base arc voltage and base arc current; T is the pulse period (T=1/fp); and tp is the duration of pulse current (calculated as δT). For HPVPTIG welding process, the heat input is almost stable due to the very high pulse frequency. Thus, Q can be expressed as
 (4)
(4)
where Iavg is the average arc current.
2.4.2 Simulation model
The 3D model is shown in Fig. 5 including the weld plate, the underlay and the pressure plate. The last two parts were the fixtures used to simulate the heat conduction in the actual welding process. Due to the symmetry, half of the model was chosen to be the analysis model. The temperature dependent thermal physical parameters of 2219 aluminum alloys [14] used in the analysis are listed in Table 3. The film coefficients on the boundary of the parts were calculated based on the composite effects of convection and radiation using subroutine code. The element type was DC3D8. The elements near the weld center were refined.
Table 3 Temperature dependent thermal conductivity and specific heat of 2219 aluminum alloy [14]
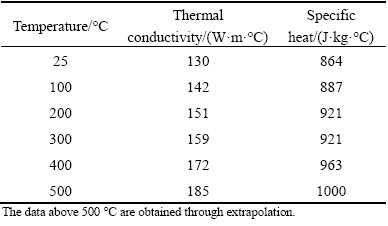
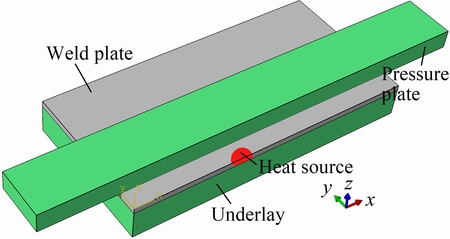
Fig. 5 3D model for temperature field calculation of different TIG welding processes
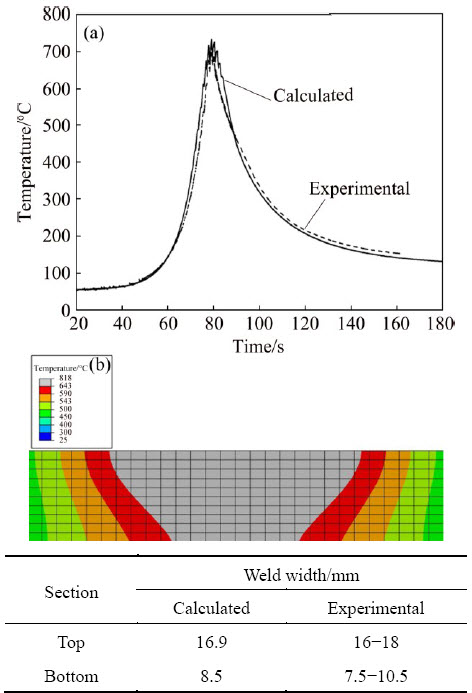
Fig. 6 Temperature cycles in center of LPVPTIG weld (a) and corresponding temperature field on transverse section of joint (b)
2.4.3 Validation of calculation results
Figure 6(a) shows the calculated temperature cycle in the LPVPTIG weld center, which agreed well with the experimental results measured by a thermocouple. Figure 6(b) shows the corresponding temperature field on the transverse section of the joint when the width of the weld zone was the maximum. The region with the temperature above 643 °C (liquidus temperature of 2219 alloy) was the weld zone. The calculated width of the weld zone also agreed well with the experimental results. Using the same cooling environment, the temperature field in the DCTIG weld and the HPVPTIG weld was also calculated.
3 Results and discussion
3.1 Microstructures of welds
3.1.1 Microstructures of LPVPTIG weld
Figure 7(a) shows the periodic banding microstructures of the LPVPTIG weld on the top section. According to the EDS analysis results of different positions shown in Table 4, the white particles (such as position M1 in Fig. 7(b) and position M5 in Fig. 7(c)) were α+θ eutectics due to their close Cu/Al mass ratio to that of α+θ eutectic. However, the distribution of the eutectics was macroscopically not uniform (Fig. 7(a)). Zone A (Fig. 7(b)) had fewer and smaller eutectics than Zone B (Fig. 7(c)). Furthermore, the Cu content in the α(Al) matrix of Zone A (positions M2-M4) was also lower than that of Zone B (positions M6 -M8). This demonstrates that Zone A had lower average Cu content than Zone B, and macrosegregation of Cu occurred in the LPVPTIG weld.
Figure 8 shows the DSC results of the LPVPTIG weld and the base material. The DSC curve of the LPVPTIG weld shows an endothermic (dissolution) reaction between 100 °C and 175 °C. As is well known, the aging sequence of Al-Cu alloy is as follows: supersaturated α→GP zones →θ"→θ'. For the 2219 alloy containing GP zones, there will be an endothermic reaction between 50 °C and 200 °C in the DSC curve due to the dissolution of GP zones [15]. For the 2219-T8 alloy containing θ' phase, there should be no endothermic reaction in that temperature range. So, the DSC curve demonstrates that GP zones formed in the LPVPTIG weld.
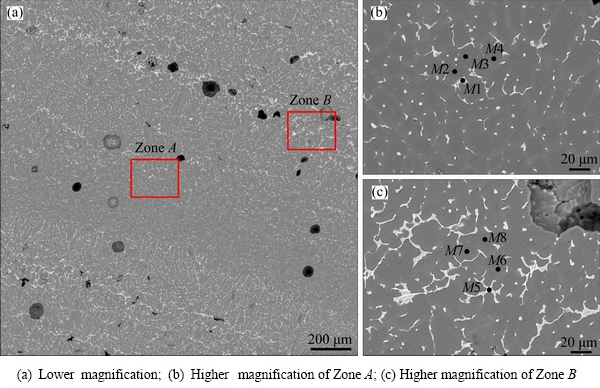
Fig. 7 Back scatter electronic images of LPVPTIG weld microstructures on top section
Table 4 EDS analysis results of LPVPTIG weld microstructures on top section (mass fraction, %)
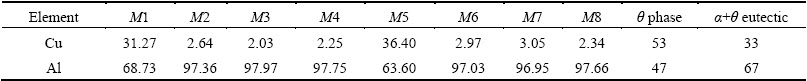
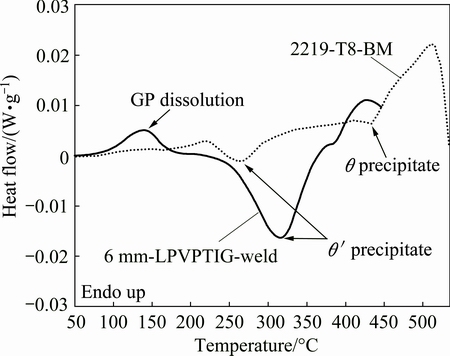
Fig. 8 DSC curves of LPVPTIG weld and base material
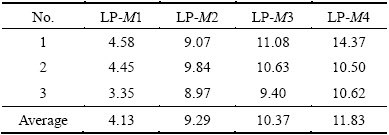
Figure 9(a) shows the optical microstructures of the LPVPTIG weld on the top section. It can be seen that the white bands and the microporosity bands distributed periodically. Figure 9(b) shows the magnified pictures of Zone LP-M in the center of the weld marked as red rectangle in Fig. 9(a). The microstructures of a pulse cycle in Zone LP-M can be divided into four typical regions according to their characteristics shown in Fig. 10. The amounts of the eutectics in different regions are listed in Table 5. Zone LP-M1 possessed the lowest amount of eutectics (4.13%) and displayed as white band in Fig. 9(a). The eutectics distributed among the columnar dendrites in Zone LP-M2, and their amount (9.29%) was significantly higher than that in Zone LP-M1. In Zone LP-M3, the amount of the eutectics increased to 10.37%. Zone LP-M4 had the highest amount of eutectics (11.83%) and accumulated microporosities. Moreover, the distribution of the eutectics in Zone LP-M4 was not uniform. Many eutectics formed as the thick continuous strip along the arc-shaped band. As mentioned previously, the region with a higher amount of eutectics also had a higher content of Cu. So, Zone LP-M4 was considered as the most serious macrosegregation band with Cu and porosities.
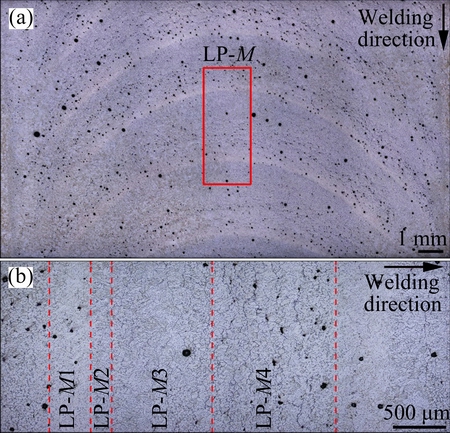
Fig. 9 Optical microstructures of LPVPTIG weld on top section (a) and magnified pictures of Zone LP-M (b)
Table 5 Amount of eutectics in LPVPTIG weld (mass fraction, %)
3.1.2 Microstructures of DCTIG weld
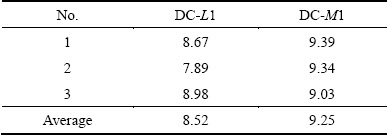
Figure 11(a) shows the optical microstructures of the DCTIG weld on the top section. Due to the steady heat input, the microstructures of the DCTIG weld were much more uniform than those of the LPVPTIG weld. In the left region (Zone DC-L1), the eutectics with the amount of 8.52% (Table 6) were distributed among the columnar dendrites toward the centerline (Fig. 11(b)). In the center region (Zone DC-M1), the eutectics with the amount of 9.25% (Table 6) were distributed among the equiaxed dendrites (Fig. 11(c)).
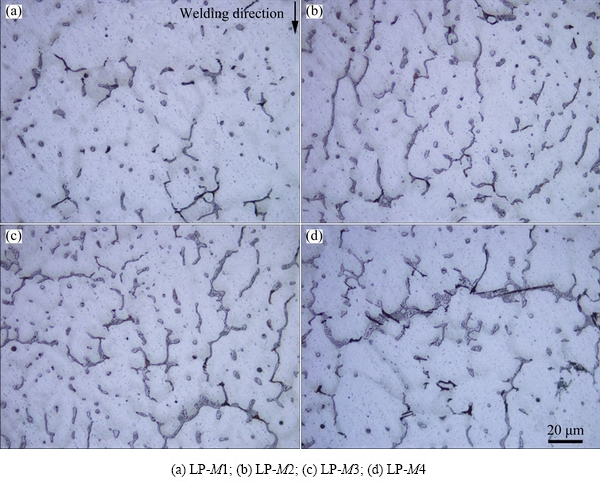
Fig. 10 Optical microstructures of different regions in Zone LP-M
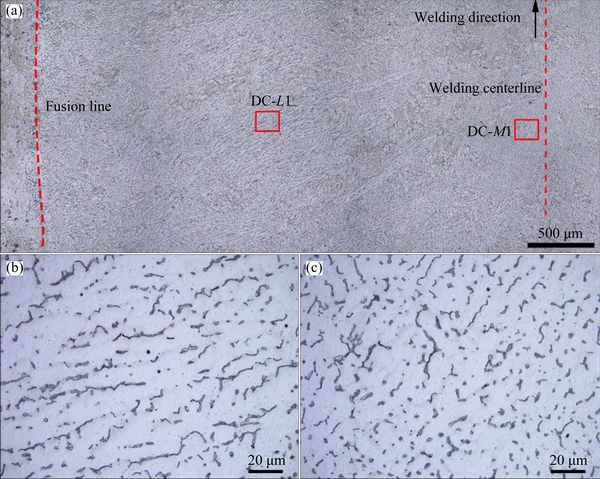
Fig. 11 Optical microstructures of DCTIG weld on top section (a), and magnified pictures of Zone DC-L1 (b) and DC-M1 (c)
Table 6 Amount of eutectics in DCTIG weld (mass fraction, %)
3.1.3 Microstructures of HPVPTIG weld
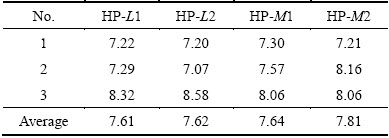
Figure 12(a) shows the optical microstructures of the HPVPTIG weld on the top section. Although the filler metal was fed intermittently, the microstructures of the HPVPTIG weld were macroscopically uniform. This means that the feeding manner of the filler metal had no effects on macrosegregation. However, the morphologies of the eutectics were not the same in different positions as shown in Figs. 12(b)-(e). The eutectics were distributed among the columnar dendrites toward the welding direction in Zones HP-L2 and HP-M2 (Figs. 12(c), (e)), while they were distributed among the equiaxed dendrites in Zones HP-L1 and HP-M1 (Figs. 12(b), (d)). This was the cause of the intermittently feeding of the filler metal. With the continuous feeding of the filler metal, the columnar grains will grow from the fusion boundary and proceed toward the weld centerline curving in the welding direction. Thus, the eutectics will segregate among the columnar dendrites. However, with intermittent feeding of the filler metal, the growing of the columnar grains was disturbed. Although the morphologies of the eutectics were different, the amount of the eutectics was quite uniform (average 7.67%) as presented in Table 7.
The statistic results of the eutectics indicate that the distribution of eutectics in LPVPTIG weld was not uniform, and the serious macrosegregation band in the weld had the highest amount of eutectics. The distribution of the eutectics in the DCTIG weld and HPVPTIG weld was uniform. Because of the microsegregation of Cu, the amount of eutectics was much higher than that generated under equilibrium solidification condition. However, the HPVPTIG weld had lower microsegregation extent than DCTIG weld due to its lower amount of eutectics. Except the white band in LPVPTIG weld, HPVPTIG weld possessed the lowest amount of eutectics.
3.2 Tensile behavior of welds
3.2.1 Tensile properties of weld
Table 8 shows the tensile properties of the welds with different welding processes. The corresponding tensile curves are shown in Fig. 13. The mechanical properties of the LPVPTIG were the lowest among the three welds, while those of the HPVPTIG weld were the highest. Furthermore, the mechanical properties of the LPVPTIG weld in transverse tensile direction were higher than those in longitudinal tensile direction. However, the mechanical properties of the HPVPTIG weld without macrosegregation band had no concern with the tensile direction. Compared with the tensile strength and elongation of the LPVPTIG weld, those of the HPVPTIG weld increased by 13% and 71%, respectively. As the DSC results shown in Fig. 8, the main strengthening phase in the α(Al) matrix of the weld was GP zone. A lower microsegregation extent of Cu in the weld will lead to a higher amount of GP zone in the α(Al) matrix and then a higher strain hardening capacity. So, the strain-stress curve of the HPVPTIG weld was above that of DCTIG weld as shown in Fig. 13.
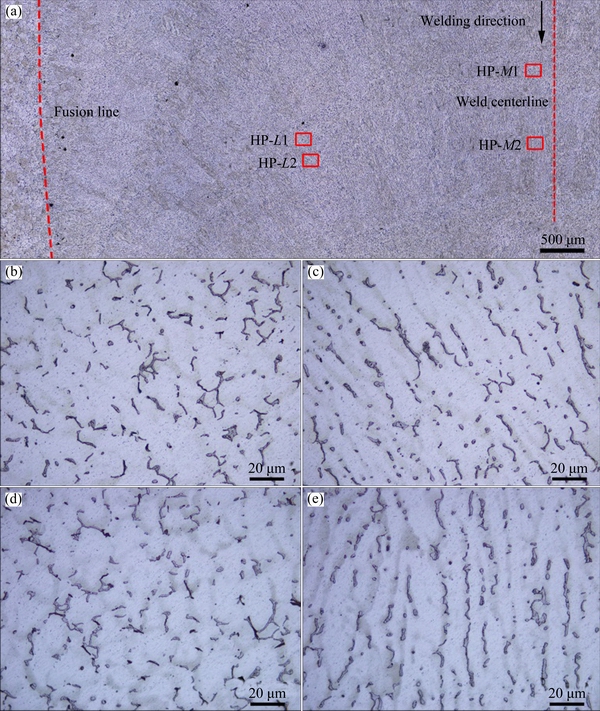
Fig. 12 Optical microstructures of HPVPTIG weld on top section (a), and magnified pictures of Zone HP-L1 (b), HP-L2 (c), HP-M1 (d), and HP-M2 (e)
Table 7 Amount of eutectics in HPVPTIG weld (mass fraction, %)
3.2.2 Tensile strain distribution on LPVPTIG weld
In order to figure out the reason why the mechanical properties of the LPVPTIG weld were different in different tensile directions, the strain field on the weld surface during tensile test was measured. Figure 14 shows the strain distribution along the tensile direction on the LPVPTIG welds at the moment just before the fracture occurred. It can be found that the strain concentrated in the serious macrosegregation bands when the weld was tensioned in the longitudinal direction, through comparison between the strain distribution and the metallurgical picture of the fractured weld shown in Fig. 14(a). This is because that the accumulated porosities in the macrosegregation bands decreased the effective bearing area. When the weld was tensioned in the transverse direction, the concentration of strain in the macrosegregation bands can also be observed (Fig. 14(b)).
Table 8 Tensile properties of welds with different welding processes
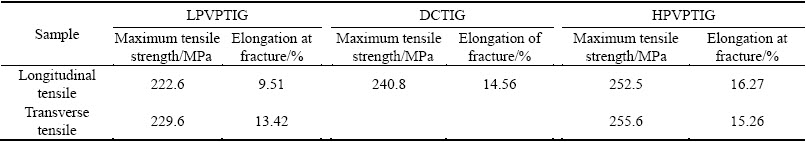
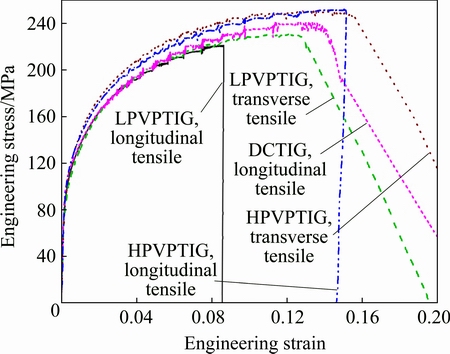
Fig. 13 Strain-stress curves of welds with different welding processes
However, the strain concentration extent in the macrosegregation bands was different in different tensile directions. Figure 15 shows the strain vs time curves of different positions on the welds. For the weld tensioned in the longitudinal direction, the strain began to concentrate in the macrosegregation bands (at positions P0 and P2 in Fig. 14(a)) when the tensile stress was about 134 MPa, and increased to around 12.9% until fracture (Fig. 15(a)). For the weld tensioned in the transverse direction, the strain began to concentrate in the macrosegregation bands (at positions P3 and P5 in Fig. 14(b)) when the stress was 215 MPa, and increased to around 18.8% until fracture (Fig. 15(b)). Those results indicate that the strain concentration extent in the macrosegregation bands tensioned in the longitudinal direction was higher than that tensioned in the transverse direction.
3.2.3 Fractographs of weld
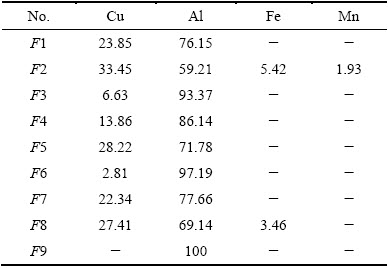
Figure 16 shows the longitudinal tensile fractographs of the welds for different welding processes. The EDS analysis results at different positions on the fracture surface are listed in Table 9. Those positions (F1, F2, F4, F5, F7 and F8) which had higher Cu content than the others were the eutectics. The fracture of the LPVPTIG weld exhibits the rupture characteristic of quasi-cleavage (Fig. 16(a)). Many large brittle fractured eutectic particles (positions F1 and F2) were exposed on the fracture surface. The fracture of the DCTIG weld and HPVPTIG weld exhibits the rupture characteristic of dimples (Figs. 16(b) and (e)). At the bottom of the dimples (positions F4, F5, F7 and F8), small eutectic particles can be observed.
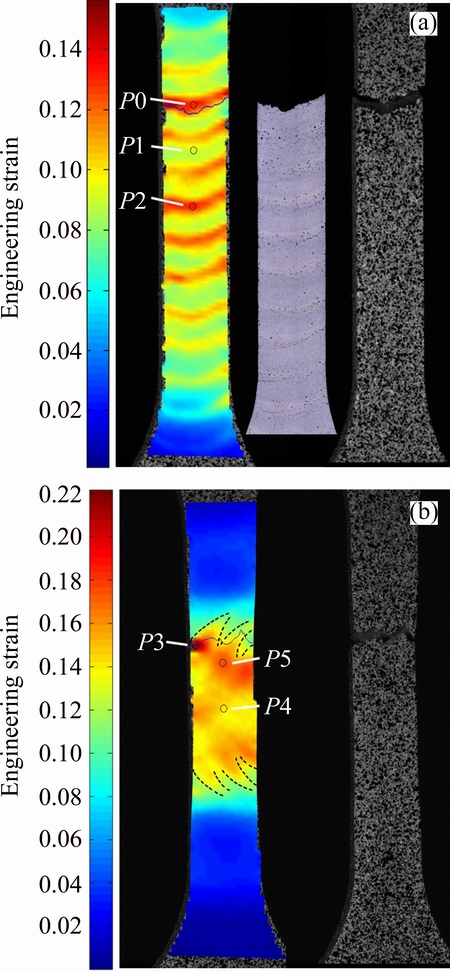
Fig. 14 Strain distribution on LPVPTIG welds tensioned in longitudinal direction (a) and transverse direction (b) at moment just before fracture
The difference of the fractures was caused by the different amounts and morphologies of eutectics in the welds. As shown in Fig. 14(a), the LPVPTIG weld fractured at the serious macrosegregation band which having the highest amount of thick eutectics. The thick brittle eutectics deformed inconsistently with the α(Al) matrix during the tensile load, and significantly deteriorated the plasticity of the weld. However, the eutectics in the DCTIG and HPVPTIG welds were thinner and more uniform than those in the serious macrosegregation band of the LPVPTIG weld. Those thin eutectics preferred to be the nucleation cores of dimples, and their deterioration to the plasticity of the weld was less serious than the thick continuous eutectics.
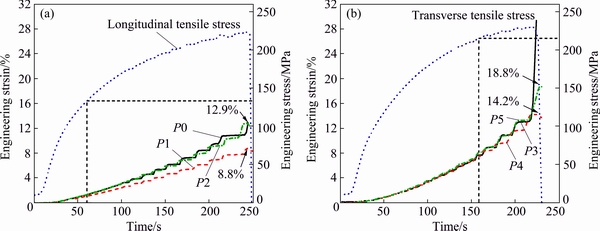
Fig. 15 Strain and stress at different positions on longitudinal tensile weld (a) and transverse tensile weld (b) vs time
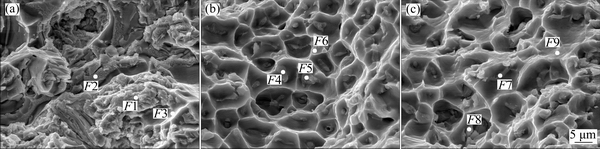
Fig. 16 Fractographs of longitudinal tensile tested LPVPTIG weld (a), DCTIG weld (b) and HPVPTIG weld (c)
Table 9 EDS analysis results at different positions on fracture surface (mass fraction, %)
3.2.4 Mechanical behavior of macrosegregation band
The tensile results of the welds indicate that the serious macrosegregation band was the weakness region in LPVPTIG weld. If the serious macrosegregation band is simplified as a weakness plane shown in Fig. 17, the mechanical behavior of the band can be analyzed.
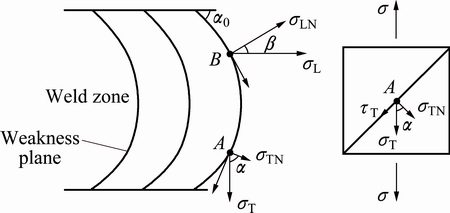
Fig. 17 Force analysis schematic of LPVPTIG weld tensioned in longitudinal direction and transverse direction
The tensile stress on the weld is denoted by σ. When the weld is tensioned in the transverse direction, the stress along the tensile direction on point A of the weakness plane is denoted by σT, and the angle between the normal direction on point A and the tensile direction is denoted by α (as shown in Fig. 17, α0≤α≤ 90°). Then, σT is calculated as
σT=σcos α (5)
The normal stress component σTN is
σTN=σcos2α (6)
When the weld is tensioned in the longitudinal direction, the stress along the tensile direction on point B of the weakness plane is denoted by σL, and the angle between the normal direction on point B and the tensile direction is denoted by β (as shown in Fig.17, 0≤β≤90°-α0). Similarly, σL is calculated as
σL=σcos β (7)
The normal stress component of σL is
σLN=σcos2β (8)
The fracture of the weakness plane is determined by the normal stress component. If the weld is tensioned in the transverse direction, σTN can get the maximum value σcos2α0 when α=α0. Thus, the weld always fractured near the fusion line when it was tensioned under the transverse load. This analysis result is consistent with the experimental results shown in Fig. 14(b).
If the weld is tensioned in the longitudinal direction, σLN can get the maximum value σ when β=0. Thus, the fracture initiated in the center of the weld and always propagated along the serious macrosegregation band when the weld was tensioned under the longitudinal load. This analysis result is also consistent with the experimental results shown in Fig. 14(a). Since the normal fracture stress of the weakness plane is constant, the needed maximum longitudinal tensile stress is lower than the maximum transverse tensile stress. This explains that the maximum longitudinal tensile strength was always smaller than the maximum transverse tensile strength for the LPVPTIG welds.
3.3 Segregation behavior in welds
3.3.1 Thermal process in welds
The results in the previous sections show that the macrosegregation and microsegregation in the welds play a key role in the mechanical properties of the welds. The different extents of macrosegregation and microsegregation in the three welds were considered to be caused by the different thermal processes of the welds experienced.
Figure 18(a) shows the calculated temperature contours (543, 625 and 643 °C) on the top surface of the LPVPTIG weld in a single pulse cycle from TA to TD. TA and TD were in the early stage of the peak current, TB was the moment when the peak current turned to the base current, and TC was the moment when the base current turned to the peak current. 643 °C is the liquidus temperature of 2219 aluminum alloy, and 543 °C is the incipient melting point. The zone with the temperature above 643 °C was the weld pool. Due to the effect of the pulse varied heat input, the size of the weld pool increased and decreased alternately. The zone in the weld with the temperature between 543 and 643 °C was the mushy zone which was partially solidified. Figure 18(b) shows the displacement vs time curves of the mushy zone in the weld center accompanied with the welding current. It is shown that the displacement of the solidification front (643 °C) was fluctuated in a cycle, while the displacement of the solidus interface increased almost linearly with time.
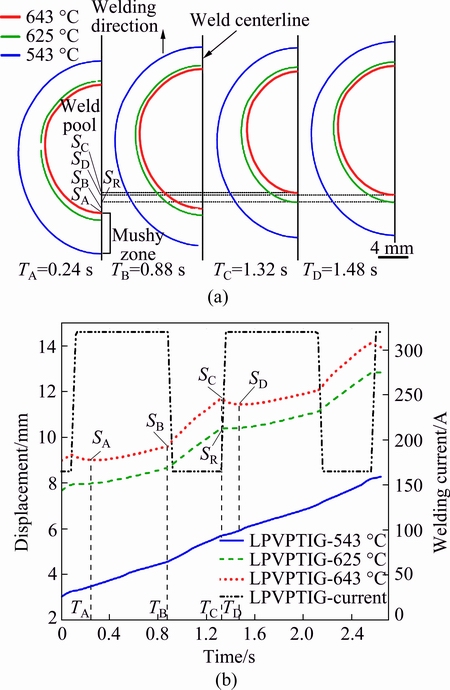
Fig. 18 Temperature contours on top surface of LPVPTIG weld (a) and displacement vs time curves of mushy zone in weld center accompanied with welding current (b)
During the peak welding current, the tail of the weld pool grew toward the opposite direction of welding with the assumed speed of vg. During the base welding current, the tail of the weld pool shrank toward the same direction of welding with the assumed speed of vs. It is supposed that the welding speed was vw, the advancing speed of the solidification front was RL, and the advancing speed of the solidus interface was RS. RS was approximately equal to vw since the displacement of the solidus interface almost increased linearly with time. During the peak welding current, the advancing speed of the solidification front can be calculated as
RL=vw-vg (9)
During the base welding current, the advancing speed of the solidification front can be calculated as
RL=vw+vs (10)
As shown in Fig. 18, TA, TB, TC and TD were the different moments in a pulse cycle, and the corresponding displacements of the solidification front in the weld center were SA, SB, SC and SD. Figure 19 shows the advancing speed of the solidification front and the solidus interface in a cycle. During the later stage of the peak current between TA and TB, the weld pool grew slowly, and the advancing speed of the solidification front was lower than that of the solidus interface (RL=vw-vg
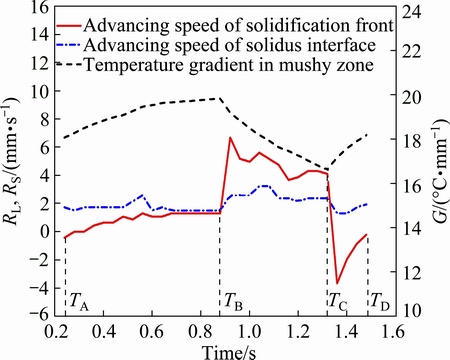
Fig. 19 Advancing speed of solidification front (RL) and solidus interface (RS), and temperature gradient (G) in mushy zone
Figure 20 shows the displacement vs time curves of the mushy zone in the center of DCTIG weld and HPVPTIG weld on the top surface. It indicates that the moving speed of mushy zone was equal to the welding speed. The solidification speeds in the weld center of DCTIG and HPVPTIG were 4.3 mm/s and 2.0 mm/s, respectively. The temperature gradients in the mushy zone of DCTIG and HPVPTIG weld center were nearly the same (about 26 °C/mm).
3.3.2 Macrosegregation and microsegregation behavior in welds
FLEMINGS [16] summarized that macro- segregation formed in the mushy zone, and it was the result of slow interdendritic flow, driven by shrinkage, geometry, solid deformation or gravity in most case. He also developed the well-known local solute redistribution equation to explain the macrosegregation in the unidirec- tional solidification of Al-4.5%Cu alloy [17-19]. According to his research results, the abrupt changes of the movement of the solidification front and solidus interface will result in the macrosegregation of solute as follows.
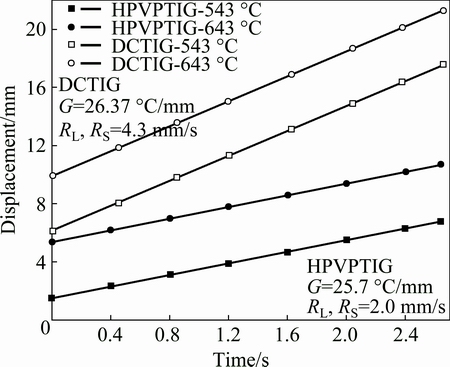
Fig. 20 Displacement vs time curves of mushy zone in center of DCTIG weld and HPVPTIG weld on top surface
When the advancing speed of the solidification front is equal to that of the solidus interface, the solute-poor liquid will flow at the speed of vf from the solidification front to the solidus interface to feed the solidification shrinkage. When the advancing speed of the solidification front is lower than that of the solidus interface (RL
The microsegregation of solute is determined by the solidification rate and temperature gradient [20]. The increase of temperature gradient will generally increase the microsegregation extent of solute. The increase of solidification rate will increase the microsegregation extent by decreasing the solute back diffusion in the solid on one hand, and will decrease the microsegregation extent by increasing the dendrite tip undercooling on the other hand. Thus, the microsegregation extent of solute will first increase and then decrease with the increasing of the solidification rate. For Al-4.9%Cu alloy, the microsegregation extent of Cu got the maximum value at the solidification rate of 10 mm/s when the temperature gradient was 7.5-18.7 °C/mm [21]. According to the research results by PALIWAL et al [20], the effects of temperature gradient and solidification rate on the microsegregation extent are regardless of the solute content. So, the microsegregation extent in Al-6.3%Cu alloy may get the maximum value at the solidification rate closed to that in Al-4.5%Cu alloy under the similar temperature gradient in this work (Figs. 19 and 20).
Taking a single pulse cycle in LPVPTIG weld as an example, the macrosegregation and microsegregation of Cu in the region from SA to SD can be analyzed as follows. Region SA-SB had the lowest amount of eutectics due to the minimum Cu content and the low solidification rate (0-1.3 mm/s), and exhibited as white band. The amount of eutectics in region SB-SR was higher due to the increased Cu content and solidification rate (6.7-4.1 mm/s). Region SR-SD had the highest amount of eutectics due to the highest Cu content. The macrosegregation and microsegregation mechanism for Cu can also be extended to porosity [22]. Thus, region SD-SR showed the most serious macrosegregation band with the highest amount of eutectics and porosities.
The DCTIG weld and HPVPTIG weld had no macrosegregation band since the advancing speed of the solidification front was equal to that of the solidus interface. However, the solidification rate of HPVPTIG weld was slower than that of the DCTIG weld as shown in Fig. 20. Thus, the amount of eutectics in HPVPTIG weld was lower due to the lower microsegregation extent of Cu.
4 Conclusions
1) Macrosegregation bands with large amount of thick continuous eutectics and microporosities formed in the LPVPTIG weld. There was no macrosegregation in the DCTIG weld and HPVPTIG weld. However, the microsegregation extent of Cu in the HPVPTIG weld was lower than that in the DCTIG weld due to the slower welding speed.
2) The serious macrosegregation bands were the weakness regions in the LPVPTIG welds, and made the mechanical properties of the LPVPTIG weld anisotropic. The experimental and theoretical analysis results indicated that the LPVPTIG weld had lower tensile properties in the longitudinal direction than those in the transverse direction.
3) The macrosegregation of Cu and microporosities in the LPVPTIG weld was caused by the pulse varied heat input. In the later stage of the peak current, negative macrosegregation was produced since the advancing speed of the solidification front was lower than that of the solidus interface. When the peak current turned to the base current, positive macrosegregation was produced since the advancing speed of the solidification front was higher than that of the solidus interface. In the early stage of the peak current, the intensified positive macrosegregation was produced due to the remelting of the solidification front.
4) The mechanical properties of the weld decreased with the increase of the segregation extent of Cu and porosities. HPVPTIG weld had the lowest extent of segregation and the highest mechanical properties among the three welds. Compared with the tensile strength and elongation of the LPVPTIG weld, those of the HPVPTIG weld increased by 13% and 71%, respectively.
References
[1] VENKATA-NARAYANA G, SHARMA V M J, DIWAKAR V, SREE KUMA K R, PRASAD R C. Fracture behavior of aluminium alloy 2219-T87 welded plates [J]. Science and Technology of Welding and Joining, 2004, 9(2): 121-130.
[2] XU Wei-feng, LIU Jin-he, LUAN Guo-hong, DONG Chun-lin. Microstructure and mechanical properties of friction stir welded joints in 2219-T6 aluminum alloy [J]. Materials & Design, 2009, 30(9): 3460-3467.
[3] CHEN Ying-chun, LIU Hui-jie, FENG Ji-cai. Friction stir welding characteristics of different heat-treated-state 2219 aluminum alloy plates [J]. Materials Science & Engineering A, 2006, 420(1-2): 21-25.
[4] HARTMAN J A, BEIL R J, HAHN G T. Effect of copper rich regions on tensile properties of VPPA weldments of 2219-T87 aluminum [J]. Welding Journal, 1987, 32(1): 73-83.
[5] NUNES A C. Variable polarity plasma arc welding on the space shuttle external tank [J]. Welding Journal, 1984, 63(9): 27-35.
[6] ZHU Z Y, DENG C Y, WANG Y, YANG Z W, DING J K, WANG D P. Effect of post weld heat treatment on the microstructure and corrosion behavior of AA2219 aluminum alloy joints welded by variable polarity tungsten inert gas welding [J]. Materials & Design, 2015, 65: 1075-1082.
[7] LI Quan, WU Ai-ping, LI Yan-jun, WANG Guo-qing, YAN Dong-yang, LIU Juan. Influence of temperature cycles on the microstructures and mechanical properties of the partially melted zone in the fusion welded joints of 2219 aluminum alloy [J]. Materials Science & Engineering A, 2015, 623: 38-48.
[8] LI Quan, WU Ai-ping, ZHAO Yue, WANG Guo-qing, YAN Dong-yang, WU Hui-qiang. Fracture behavior of double-pass TIG welded 2219-T8 aluminum alloy joints under transverse tensile test [J]. Transactions of Nonferrous Metals Society of China, 2015, 25(6): 1794-1803.
[9] MURRAY J L. The aluminium-copper system [J]. International Metals Reviews, 1985, 30(5): 211-233.
[10] NORMAN A F, DRAZHNER V, PRANGNELL P B. Effect of welding parameters on the solidification microstructure of autogenous TIG welds in an Al-Cu-Mg-Mn alloy [J]. Materials Science & Engineering A, 1999, 259(1): 53-64.
[11] DAVIS J R. Aluminum and aluminum alloys [M]. Materials Park, OH: ASM International, 1993: 662-663.
[12] CONG Bao-qiang, QI Bo-jin, LI Wei, YANG Ming-xuan. A novel ultrafast-convert hybrid pulse square-wave VP-GTAW process for aluminum alloys [J]. China Welding, 2010, 19(2): 32-36.
[13] GOLDAK J, CHAKRAVARTI A, BIBBY M. A new finite element model for welding heat sources [J]. Metallurgical Transactions B, 1984, 15(2): 299-305.
[14] MENG Q G, FANG H Y, YANG J G, JI S D. Analysis of temperature and stress field in Al alloy's twin wire welding [J]. Theoretical and Applied Fracture Mechanics, 2005, 44(2): 178-186.
[15] JOHN M P. A calorimetric study of precipitation in aluminum alloy 2219 [J]. Metallurgical Transactions A, 1981, 12(2): 269-280.
[16] FLEMINGS M C. Our understanding of macrosegregation: Past and present [J]. ISIJ International, 2000, 40(9): 833-841.
[17] FLEMINGS M C, NEREO G E. Macrosegregation. Part. 1 [J]. Transactions of Metallurgical Society of AIME, 1967, 239(9): 1449-1461.
[18] FLEMINGS M C, NEREO G E. Macrosegregation. Part. 3 [J]. Transactions of Metallurgical Society of AIME, 1968, 242(1): 50-55.
[19] FLEMINGS M C, NEREO G E. Macrosegregation. Part. 2 [J]. Transactions of Metallurgical Society of AIME, 1968, 242(1): 41-49.
[20] PALIWAL M, KANG D, ESSADIQI E, JUNG I. Variations of microsegregation and second phase fraction of binary Mg-Al alloys with solidification parameters [J]. Metallurgical and Materials Transactions A, 2014, 45(8): 3308-3320.
[21] SARREAL J A, ABBASCHIAN G J. The effect of solidification rate on microsegregation [J]. Metallurgical Transactions A, 1986, 17(11): 2063-2073.
[22] D’ANNESSA A T. Characteristic redistribution of solute in fusion welding [J]. Welding Journal, 1966, 45(12): 569-576.
李 权1,2,吴爱萍1,3,4,李艳军1,王国庆5,齐铂金6,鄢东洋7,熊林玉2
1. 清华大学 机械工程系,北京 100084;
2. 首都航天机械公司,北京 100076;
3. 清华大学 摩擦学国家重点实验室,北京 100084;
4. 清华大学 先进成形制造教育部重点实验室,北京 100084;
5. 中国运载火箭技术研究院,北京 100076;
6. 北京航空航天大学 机械工程及自动化学院,北京 100191;
7. 北京宇航系统工程研究所,北京 100076
摘 要:采用氩气保护的低频脉冲变极性氩弧焊(LPVPTIG)、氦气保护的直流氩弧焊(DCTIG)和氩气保护的高频脉冲变极性氩弧焊(HPVPTIG)等焊接方法获得了3种不同的焊缝。结果表明:由于热输入的波动,LPVPTIG焊缝存在宏观偏析带,带内聚集了粗大的共晶和显微气孔;DCTIG和HPVPTIG焊缝仅存在微观偏析,但由于焊接速度较慢,HPVPTIG焊缝Cu元素微观偏析程度低于DCTIG焊缝。力学性能测试结果表明:焊缝的力学性能随着Cu元素和气孔偏析程度的增加而降低,LPVPTIG焊缝由于存在宏观偏析带,其纵向拉伸力学性能低于横向拉伸力学性能。
关键词:2219铝合金;熔化焊;宏观偏析;微观偏析;力学行为
(Edited by Xiang-qun LI)
Corresponding author: Quan LI; Tel: +86-10-68750239; E-mail: liquan_211@aliyun.com
DOI: 10.1016/S1003-6326(17)60030-X

