Quantitative estimation of social stock for metals Al and Cu in China
��Դ�ڿ����й���ɫ����ѧ��(Ӣ�İ�)2012���7��
�������ߣ���ǿ ������ ½����
����ҳ�룺1744 - 1752
�ؼ��ʣ�����������������Դ��ƽ��ʹ����������ѭ���ʣ�ƽ������
Key words��social stock; secondary resource; average use life; recyclable ratio; average age
ժ Ҫ������������������һ���̶��Ͼ����ɹ����յĶ�����Դ�������������˽������������ķ���������Top-down��������������������������(���������ֲ��䡢������ָ���仯�����������Ա仯)�Խ��������������ɻ����ʺ�ƽ�������Ӱ�졣�ڴ˻����ϣ����ҹ�2006��2009�������ͭ���������������˷������õ����·�����������ڼ�������ͭ������������������2009��ʱ�ֱ�ﵽ��8890��t��5140��t��ƽ���ɻ����ʷֱ�Ϊ1.45%��0.30%��ƽ������ֱ�Ϊ4.65 a��6.89 a������δ���ҹ�����ͭ���������ٵĽ��ͣ�����ͭ���������Ŀɻ����ʺ�ƽ�����佫������������
Abstract: Social stock for metal determines secondary or recoverable resources to a certain extent. Top-down analysis method for the studying of metal in social stock was given. Influences of metal consumption under three circumstances, that is keeping constant, varying in a linear trend and in an exponential trend, on one kind of metal��s social stock, recyclable ratio and average age were analyzed. Al-contents and Cu-contents in social stock for China during the period 2006��2009 were calculated. The results reveal that Al-contents and Cu-contents in social stock kept increasing and reached 88.9 million tons and 51.4 millions tons in 2009, respectively, their average recyclable ratios are 1.45% and 0.30%, and the average ages are 4.65 years and 6.89 years, respectively. The recyclable ratios and average ages of Al-contents and Cu-contents in social stock will rise in future along with the decline of the increasing rate of aluminum consumption and copper consumption.

![]()
Trans. Nonferrous Met. Soc. China 22(2012) 1744-1752
YUE Qiang1, WANG He-ming1, 2, LU Zhong-wu1
1. State Environmental Protection Key Laboratory of Eco-Industry, Northeastern University, Shenyang 110819, China;
2. Research Center for Material Cycles and Waste Management, National Institute for Environmental Studies,
Onogawa Tsukuba Ibaraki 305-8506, Japan
Received 31 August 2011; accepted 20 October 2011
Abstract: Social stock for metal determines secondary or recoverable resources to a certain extent. Top-down analysis method for the studying of metal in social stock was given. Influences of metal consumption under three circumstances, that is keeping constant, varying in a linear trend and in an exponential trend, on one kind of metal��s social stock, recyclable ratio and average age were analyzed. Al-contents and Cu-contents in social stock for China during the period 2006-2009 were calculated. The results reveal that Al-contents and Cu-contents in social stock kept increasing and reached 88.9 million tons and 51.4 millions tons in 2009, respectively, their average recyclable ratios are 1.45% and 0.30%, and the average ages are 4.65 years and 6.89 years, respectively. The recyclable ratios and average ages of Al-contents and Cu-contents in social stock will rise in future along with the decline of the increasing rate of aluminum consumption and copper consumption.
Key words: social stock; secondary resource; average use life; recyclable ratio; average age
1 Introduction
Production and consumption of iron and steel, aluminum, copper, zinc and lead, etc, have increased quickly in China since 1990s [1]. Scrap of these metals was severely insufficient to meet the needs. The heavy dependence on imports for iron ore, bauxite and copper concentrate, etc, has made great pressure on China��s resources strategy [2-6]. At the same time, metal products continued entering social stock, such as building and construction, transportation, mechanical engineering, electrical engineering, packaging, household and office equipment. However, with the growing of the inputted metal to the social stock, the output of secondary resources from the social stock is very limited in recent years [2-6]. It can be expected that the amount of secondary resources produced from the social stock should increase some years later. The amount of a country or a region��s secondary resources available for recycling was determined by the volume of social stock and its composition, which includes the historical change in consumption, but relevant information on the social stock and secondary resources in China is difficult to grasp. Since the amount of China��s secondary resources of steel scrap available for recycling had not been analyzed, electric steel plants broadly developing in the 1990s resulted in a huge waste of investment. Therefore, the analysis on the metals social stock and their composition obtained the variation of the potential recyclable secondary resources. Analysis of metal flows and stocks can provide some basis for the decision making of resources strategy, industrial and environmental policy of China��s metal industry.
Studies on metal flows and stocks have been carried out broadly out of China. SPATARI et al [7,8] took copper and zinc as examples to analyze the net change of the whole European social stock in 1994, using substance flow analysis of the ��Stocks and Flows�� model. GRAEDEL et al [9] adopted similar ��Stocks and Flows�� model to analyze the net change of the social stock of copper in 1994 for 56 countries, nine regions and the whole world. MELO [10] presented the distribution of the aluminum-containing materials in the final products, then analyzed and predicted the amount of waste generation of the aluminum industry in Germany from 1986 to 2012 according to different probability distribution functions. ELSHKAKI et al [11] analyzed the changes of lead in the social stock of Netherlands, which brought about the environmental and economic influence on lead industry in the future. BLINDER et al [12] studied the changes of per capita social stock of copper and zinc in certain areas and countries. ROSTKOWSKI et al [13] used survey research and statistical analysis methods to calculate the social stock of nickel in New Haven city, Connecticut, USA, based on the nickel-containing substances in the distribution of final products. DAIGO et al [14] developed the calculating formulas of the inflow and outflow of copper-containing materials from the copper social stock, and analyzed Japan��s social stock of copper in 2005.
A few studies on social stock of metals have been carried out in China. YUE and LU [15] used ��Stocks and Flows�� model to analyze the net increase of social copper stock per capita in China in the period 1998-2002; LOU and SHI [16] used survey research and statistical analysis to calculate the social stock of steel and aluminum of Handan City in 2005, based on the use volume and intensity of steel and aluminum in the final products. MAO et al [17] used ��Stocks and Flows�� model to analyze the net changes of 52 national, 8 regional and global social stocks of lead in 2000. GUO et al [18] used ��Stocks and Flows�� model to analyze the net increase of zinc in the social stock in China in 2006.
In this work, the analysis method is given for the study of metal in social stock, and the Top-down method is used to analyze the social stock of metallic substance. Then, the characteristics of social stock under different variation of metal consumption are discussed. Finally, social stock for aluminum and copper in China is calculated.
2 Analysis method of social stock for metallic substance
2.1 Framework
Stock and recoverability of metallic substance are shown in Fig. 1. From Fig. 1, it can be seen that social stock (SS) of metallic substance has the highest recoverability for secondary resources, tailing stock and landfilled stock come next, and dissipated stock has the lowest recoverability. So, it can be said that SS of metallic substance determines the quantities of recyclable old scrap to a certain extent.
2.2 Analysis method
Top-down method is used here to study the social stock of metal, which calculates the difference by metal in final products which are flowed into SS and then flowed out of SS in a period of time (t0-t) [19]. And SS of metallic substance in the time t0 should be known (see Fig. 2). Generally, metal flowed into SS as final products in-use and metal flowed out of SS as discarded products can be got by functions of time. SS of metallic substance at a random time t can be calculated by:
![]() (1)
(1)
where min(��) is metal mass in final products flowed into SS; mout(��) is metal mass in discarded products flowed out of SS; mss(t0) is metal mass in SS at initial time t0.
Socioeconomic system can be separated as steady system and non-steady system according to the variation of metal substance in SS: when metal contents don��t change with time, we can regard it as a steady system; when metal contents change with time, then it is a non-steady system. These two systems are described in Figs. 2(a) and (b), respectively.
Metal in social stock doesn��t change for steady system, that is, mss(t) equals mss(t0). In fact, as Eq. (1)
shows, if ![]() equals
equals ![]() , this system
, this system
is a steady system.
The quantities of metal flows into SS in a period of
time (t0-t) are ![]() . If one metal has i
. If one metal has i
categories of final products, we can get
![]()
![]() (2)
(2)
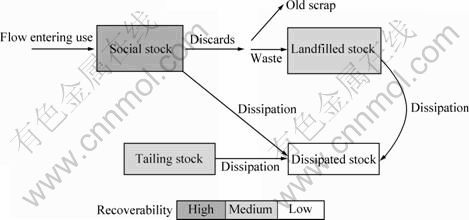
Fig. 1 Stock and recoverability of metallic substance
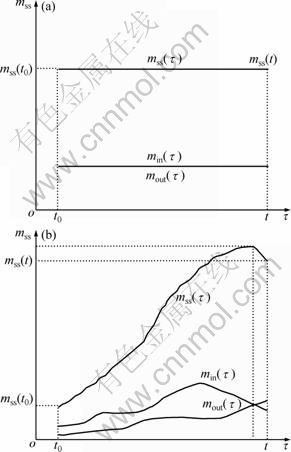
Fig. 2 Variation of social stocks of metals in steady and non-steady systems: (a) Steady system; (b) Non-steady system
The quantities of metal flowed out of SS in a period
of time (t0-t) can be expressed as ![]() If
If
we assume the average use life for the first category of metal products is ����1, the second is ����2, ��, the ith is ����i,
 (3)
(3)
where ��1,r, ��2,r, ��, ��i,r are recycling rates of the first, second, ����ith category of discarded metal products; ��1,l, ��2,l, ��, ��i,l are landfilling rates of the first, second, ����ith category of discarded metal products.
In Eq. (3),
![]()
and
![]()
![]()
is the scrap recycled in the period (t0-t).
Taking Eq. (2) and Eq. (3) into Eq. (1), SS of metallic substance can be calculated out under the known parameter of mss(t0).
If we want to calculate SS of metallic substance based on Eq. (2) and Eq. (3), we should obtain the information on the use categories of metal products, distribution of metal in different categories of metal products (constitution of metal use) and average use life for each category of metal products for a long period of time. It is almost impossible to obtain these data for a long period in China because of insufficient data sources. So, a simplified analysis method is adopted here.
Metal consumption of a country (or a region) can be calculated by the following formula under the situation that metal stockpile doesn��t change so much.
mcons(��)=mprod(��)+mimpo(��)�Cmexpo(��) (4)
where mcons(��), mprod(��), mimpo(��), mexpo(��) are consumption, production, imported quantities and exported quantities for one kind of metal in the year ��, respectively.
It is easy to understand that quantities of metal consumption mcons are the same with metal flowing into SS (min). Based on Eq. (1), SS of metallic substance at a random time t can be calculated by the following formula:
![]() (5)
(5)
where ���� is the weighted average use life for different categories of metal products in Eq. (3).
Metal products have an average use life ����, namely, the average use life of copper products is about 30 years [4, 20], the average use life of aluminum products is about 16 years [21], and the average use life of zinc products is about 17 years [22]. Metal products will be discarded and reclaimed as secondary resources after their use life. Constitution of social stock of metallic substance in the year �� can be described as Fig. 3, where we assume the average use life of metal products is ����.
In Fig. 3, m��, m��-1, ��, m��-����+1 and m��-���� are metal contents in final products in the year ��, (��-1), ��, (��-����+1) and (��-����). SS of metallic substance in the year �� can be calculated as:
![]() (6)
(6)
where mss(��) is the SS of metallic substance in the year ��.
Metal products in the year (��-����) (which is expressed by m��-����) will be discarded from social stock and reclaimed as secondary resources to the metal production, fabrication and manufacture stage.
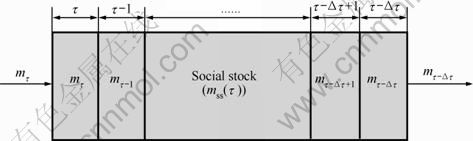
Fig. 3 Sketch map of metal in social stock of year ��
3 Social stock of metallic substance under different variation of metal consumption
3.1 Function types of metal consumption
According to the data on metal (iron and steel, aluminum, copper, etc) consumption of USA, UK, Japan in the past one hundred years and China after the year 1949, metal consumption functions can be divided into four types: 1) linear increase or keeping constant; 2) linear decrease; 3) nonlinear increase; 4) nonlinear decrease. Based on the actual circumstances of metal consumption in some countries, there are four combined characteristics of metal consumption functions: 1) linear increase or keeping constant + nonlinear increase (Fig. 4(a)); 2) nonlinear increase + linear increase or keeping constant (Fig. 4(b)); 3) nonlinear decrease + linear increase or keeping constant (Fig. 4(c)); 4) nonlinear increase + nonlinear decrease (Fig. 4(d)) [22,23].
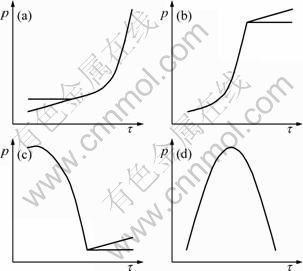
Fig. 4 Combined characteristics of metal consumption functions
3.2 Variation of metal consumption on social stock of metallic substance
Metal consumption of a country (or a region) in a period of time can be divided into three circumstances: 1) keeping constant; 2) linear variation; and 3) exponential variation. In the following part of this section, we will discuss SS of metallic substance in the above three circumstances according to section 2.2. The average use life of metal products is assumed to be ����, and metal consumption in the initial year is m0.
1) Constant metal consumption
Metal consumption keeps constant, which is ![]() . SS of metallic substance at a random t will be equal to that at the initial time t0 under this circumstance according to Eq. (5), that is,
. SS of metallic substance at a random t will be equal to that at the initial time t0 under this circumstance according to Eq. (5), that is,
mss(t)=mss(t0) (7)
2) Linear variation of metal consumption
Variation trend of metal consumption is assumed to be ![]() . According to Eq. (5), SS of metallic substance at a random t can be calculated by the following formula under linear variation of metal consumption.
. According to Eq. (5), SS of metallic substance at a random t can be calculated by the following formula under linear variation of metal consumption.
![]()
![]()
![]() (8)
(8)
SS of metallic substance will increase gradually under linear increase of metal consumption (that is k>0); SS of metallic substance will decrease gradually under linear decrease of metal consumption (that is k<0). In addition, the average use life of metal products (����) and metal consumption at the initial time (m0) also have great influence on the SS of metallic substance. The larger the ���� and m0 are, the larger the SS of metallic substance��s change in this period (t0-t).
3) Exponential variation of metal consumption
Variation trend of metal consumption is assumed to be ![]() According to Eq. (5), SS of metallic substance at a random t can be calculated by the following formula under exponential variation of metal consumption.
According to Eq. (5), SS of metallic substance at a random t can be calculated by the following formula under exponential variation of metal consumption.
![]()
![]()
![]() (9)
(9)
SS of metallic substance will increase gradually under exponential increase of metal consumption (that is q>0); SS of metallic substance will decrease gradually under exponential decrease of metal consumption (that is q<0). In addition, metal consumption at the initial time (m0) also has great effect on the SS of metallic substance. The larger the m0 is, the larger the SS of metallic substance��s change in this period (t0-t).
3.3 Quantities, recyclable ratio and average age for SS of metallic substance in year ��
3.3.1 Quantities for SS of metallic substance in year ��
Taking the average use life of aluminum products in China, which is 16 years, as an example [21], we will discuss quantities, recyclable ratio and average age for SS of metallic substance in the year �� according to section 2.2.
1) Constant metal consumption
According to Fig. 3 and Eq. (6), SS of metallic substance in the year �� can be calculated by the following formula when metal consumption keeps constant.
![]() (10a)
(10a)
2) Linear variation of metal consumption
Variation trend of metal consumption is assumed to be ![]() . According to Fig. 3 and Eq. (6), SS of metallic substance in the year �� can be calculated by the following formula under linear variation of metal consumption.
. According to Fig. 3 and Eq. (6), SS of metallic substance in the year �� can be calculated by the following formula under linear variation of metal consumption.
![]()
![]() (10b)
(10b)
3) Exponential variation of metal consumption
Variation trend of metal consumption is assumed to be ![]() . According to Fig. 3 and Eq. (6), SS of metallic substance in the year �� can be calculated by the following formula under exponential variation of metal consumption.
. According to Fig. 3 and Eq. (6), SS of metallic substance in the year �� can be calculated by the following formula under exponential variation of metal consumption.
![]()
![]() (10c)
(10c)
If taking the average use life of copper products in China, which is 30 years, as an example [4,20], the formulas (10a)-(10c) can be expressed as:
1) Constant metal consumption
![]() (11a)
(11a)
2) Linear variation of metal consumption
![]()
![]() (11b)
(11b)
3) Exponential variation of metal consumption
![]()
![]() (11c)
(11c)
3.3.2 Recyclable ratio for SS of metallic substance in year ��
Old scrap in the year �� can be calculated by the following formula:
![]() (12)
(12)
where Z(��) is the recyclable old scrap, t/a; R(��) is the recyclable ratio for SS of metallic substance, %; mss(��) is SS of metallic substance, t/a.
Taking the average use life of aluminum products in China, which is 16 years, as an example, the variations of metal consumption on the recyclable ratio for SS of metallic substance will be discussed below according to section 3.3.1.
1) Constant metal consumption
We assume that old scrap resource in the year �� is m0. The recyclable ratio for SS of metallic substance��that is R(��), can be expressed by the following formula according to Eq. (12).
![]() (13a)
(13a)
2) Linear variation of metal consumption
As the same reason, old scrap resource in the year �� is m0. The recyclable ratio for SS of metallic substance, that is R(��), can be expressed by the following formula according to Eq. (12).
![]()
![]() (13b)
(13b)
3) Exponential variation of metal consumption
As the same reason, old scrap resource in the year �� is m0. The recyclable ratio for SS of metallic substance, that is R(��), can be expressed by the following formula according to Eq. (12).
![]()
![]()
![]() (13c)
(13c)
If taking the average use life of copper products in China, which is 30 years, as an example, the formulas (13a)-(13c) can be expressed as:
1) Constant metal consumption
![]() (14a)
(14a)
2) Linear variation of metal consumption
![]()
![]() (14b)
(14b)
3) Exponential variation of metal consumption
![]()
![]()
![]() (14c)
(14c)
The influences of linear increase and exponential increase of metal consumption on the recyclable ratio for SS of metallic substance can be obtained by the Eqs. (13b) and (13c) and Eqs. (14b) and (14c). Of course, the influences of linear decrease and exponential decrease of metal consumption can also be analyzed by Eqs. (13b) and (13c) and Eqs. (14b) and (14c).
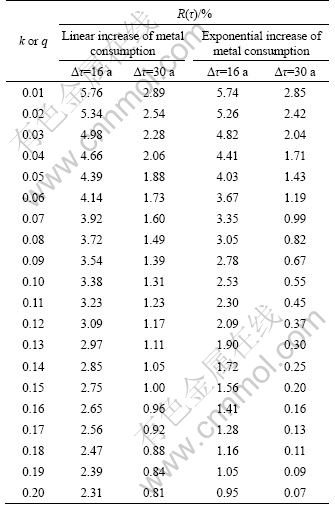
As shown in Table 1, the recyclable ratio for SS of metallic substance under metal consumption in a linear increase or in an exponential increase is smaller than that of metal consumption keeping constant. The faster the metal consumption increases (the bigger the k and q are), the smaller the recyclable ratio for SS of metallic substance is. We can also find that if k=q, the recyclable ratio for SS of metallic substance under metal consumption in an exponential increase is smaller than that in a linear increase. Under the same k or q, recyclable ratios for ���� equal to 30 years are smaller than those for the ���� equal to 16 years.
Table 1 Influence of metal consumption��s variation on recyclable ratio of metal in social stock
3.3.3 Average age for SS of metallic substance in year ��
SS in the year �� is made of metal flows into SS in the same year �� and a certain number of years before the year ��, so here we can define the concept of average age for metal products in the SS. The average age of metal products in the SS can be expressed by:
 (15)
(15)
where ![]() (��) is the average age of metal products in the SS, a; mi is the metal flowing into SS in the year i, t. For a definite SS, the older the average age is, the larger the reclaimed secondary resources in the short period are; the younger the average age is, the smaller the reclaimed secondary resources are.
(��) is the average age of metal products in the SS, a; mi is the metal flowing into SS in the year i, t. For a definite SS, the older the average age is, the larger the reclaimed secondary resources in the short period are; the younger the average age is, the smaller the reclaimed secondary resources are.
Taking the average use life of aluminum products in China, which is 16 years, as an example, variations of metal consumption on the average age for SS in the year �� will be discussed below according to section 3.3.1.
1) Constant metal consumption
The average age for SS of metallic substance, ![]() can be expressed by the following formula according to Eq. (15).
can be expressed by the following formula according to Eq. (15).
![]() (16a)
(16a)
2) Linear variation of metal consumption
The average age for SS of metallic substance, ![]() can be expressed by the following formula according to Eq. (15).
can be expressed by the following formula according to Eq. (15).
![]()
![]() (16b)
(16b)
3) Exponential variation of metal consumption
The average age for SS of metallic substance, ![]() can be expressed by the following formula according to Eq. (15).
can be expressed by the following formula according to Eq. (15).

![]() (16c)
(16c)
Taking the average use life of copper products in China, which is 30 years, as an example, the formulas (16a-16c) can be expressed as:
1) Constant metal consumption
![]() (17a)
(17a)
2) Linear variation of metal consumption
![]()
![]() (17b)
(17b)
3) Exponential variation of metal consumption

![]() (17c)
(17c)
The influences of linear increase and exponential increase of metal consumption on the average age for SS of metallic substance are obtained by Eqs. (16b) and (16c) and Eqs. (17b) and (17c). Similarly, the influences of linear decrease and exponential decrease of metal consumption can also be analyzed by Eqs. (16b) and (16c) and Eqs. (17b) and (17c).
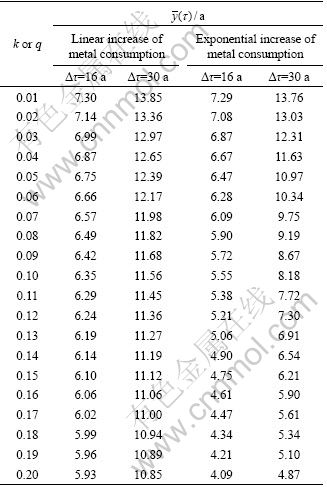
From Table 2, we can see that the average age for SS of metallic substance under metal consumption in a linear increase or in an exponential increase is smaller than that of metal consumption keeping constant. The faster the metal consumption increases (the larger the k and q are), the younger the average age for SS of metallic substance is. We also find that if k=q, the average age for SS of metallic substance under metal consumption in an exponential increase is younger than that in a linear increase.
Table 2 Influence of metal consumption��s variation on average age of metal in social stock
4 Social stock for aluminum and copper in China
4.1 Social stock for aluminum in China
The variation of aluminum consumption of China in the period 1990-2009 is shown in Fig. 5 [1]. The changes of consumption in this period close to exponential growth and can be fitted into the following formula:
![]()
The variations of Al-contents in SS in China during the period 2006-2009 were calculated in the range (54.2-88.9)��106 t (Table 3), based on the average use life of aluminum products being about 16 a in China [21].
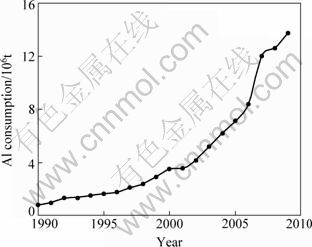
Fig. 5 Variation of aluminum consumption in China in 1990-2009
Table 3 Quantities of Al-contents in social stock in China during period 2006-2009
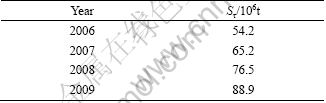
The Al-contents in social stock increased quickly in the period 2006-2009, and finally reached 88.9��106 t in the year 2009.
The average recyclable ratio for SS of aluminum substance was calculated to be 1.45% in the studied period according to Eq. (13c). We find when q is in the range of 0.15-0.16, the recyclable ratio is in the range of 1.41%-1.56%. But along with the descending of aluminum consumption in the future in China, the recyclable ratio for SS of aluminum substance will increase gradually.
The average age for SS of aluminum substance was calculated to be 4.65 a in this period according to Eq. (16c). We find when q is in the range of 0.15-0.16, the average age is in the range of 4.61-4.75 a. But along with the descending of aluminum consumption in the future in China, the average age for SS of aluminum substance will increase gradually.
4.2 Social stock for copper in China
The variation of copper consumption of China in the period 1976-2009 is shown in Fig. 6 [1]. Changes of consumption in this period close to linear growth in the period 1976-1990 and exponential growth in the period 1990-2009, respectively, and can be fitted into the following two formulas:
![]() , in the period 1976-1990
, in the period 1976-1990
![]() , in the period 1990-2009
, in the period 1990-2009
The variations of Cu-contents in SS in China during the period 2006-2009 were calculated in the range of (36.8-51.4)��106 t (Table 4), based on the average use life of copper products being about 30 a in China [4,20].
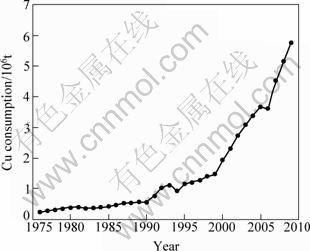
Fig. 6 Variation of copper consumption in China in 1976-2009
Table 4 Quantities of Cu-contents in social stock in China during period 2006-2009
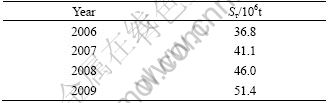
The Cu-contents in social stock increased quickly in the period 2006-2009, and finally reached 51.4��106 t in the year 2009.
The average recyclable ratio for SS of copper substance was calculated to be 0.30% in the studied period according to Eq. (14c). We find when q is in the range of 0.13-0.14, the recyclable ratio is in the range of 0.25%-0.30%. But along with the descending of copper consumption in the future in China, the recyclable ratio for SS of copper substance will increase gradually.
The average age for SS of copper substance was calculated to be 6.89 a in this period according to Eq. (17c). We find when q is in the range of 0.13-0.14, the average age is in the range of 6.54-6.91 a. But along with the descending of copper consumption in the future in China, the average age for SS of copper substance will increase gradually.
4.3 Discussion
From the above analysis, we found that Al-contents and Cu-contents in SS have increased quickly in recent years. Though the quantities of Al and Cu flowed into SS are large, the products containing them are young and they will stay in SS for a long period of time. Correspondingly, the recyclable ratios and average ages are low at present. But we can forecast that along with the descending of the increasing rate for aluminum and copper consumption in the future in China, the recyclable ratios and average ages for SS of aluminum and copper will rise.
5 Conclusions
1) Social stock of metallic substance determines the quantities of old scrap that can be reclaimed. Based on the analysis of metals social stock and composition, we can obtain the variation of potential secondary resources. Analysis of metal flows and stocks can provide some basis for the decision making of China��s metal industry��s resources strategy, industrial policy and environmental policy, and achieve a sustainable development of metal industry.
2) The recyclable ratio and average age for SS of metallic substance under metal consumption in a linear increase or in an exponential increase are smaller than those of metal consumption keeping constant. The faster the metal consumption increases, the smaller the recyclable ratio and average age for SS of metallic substance is. For the same increasing rate of metal consumption, the recyclable ratio and average age for SS of metallic substance under metal consumption in an exponential increase is smaller than that in a linear increase.
3) Al-contents and Cu-contents in social stock increased quickly in the period 2006-2009, and reached 88.9��106 t and 51.4��106 t in the year 2009, respectively. In this period, the average recyclable ratios for SS of aluminum and copper were 1.45% and 0.30%, and the average ages for SS of aluminum and copper were 4.65 and 6.89 a, respectively. Along with the descending of the increasing rate for aluminum and copper consumption in the future in China, the recyclable ratios and average ages for SS of aluminum and copper will increase gradually.
References
[1] Editorial Board of China Nonferrous Metals Industry Yearbook. China Nonferrous Metals Industry Yearbook 1991-2009 [M]. Beijing: China General Print Company, 1991-2009. (in Chinese)
[2] LU Zhong-wu. On steel scrap resources for steel industry [J]. Iron and Steel, 2002, 37(4): 66-70, 6. (in Chinese)
[3] YUE Qiang, WANG He-ming, LU Zhong-wu. Analysis of contemporary aluminum cycle in China [C]//DU Zhen-yu, ZHOU Dong. Proceedings of 2010 International Conference on Information Technology and Industrial Engineering. Livepool, UK: World Academic Union, 2010: 324-327.
[4] YUE Qiang, LU Zhong-wu. Analysis of contemporary copper recycling in China [J]. The Chinese Journal of Process Engineering, 2006, 6(4): 683-690. (in Chinese)
[5] ZHANG Jiang-hui, LU Zhong-wu. Status and approach of recycle of zinc resources in China [J]. Resources Science, 2007, 29(3): 86-93. (in Chinese)
[6] MAO Jian-su, YANG Zhi-feng, LU Zhong-wu. Industrial flow of lead in China [J]. Transactions of Nonferrous Metals Society of China, 2007, 17: 400-411.
[7] SPATARI S, BERTRAM M, FUSE K, GRAEDEL T E, RECHBERGER H. The contemporary European copper cycle: 1 year stocks and flows [J]. Ecological Economics, 2002, 42: 27-42.
[8] SPATARI S, BERTRAM M, FUSE K, GRAEDEL T E, SHELOV E. The contemporary European zinc cycle: 1 year stocks and flows [J]. Resources, Conservation and Recycling, 2003, 39: 137-160.
[9] GRAEDEL T E, van BEERS D, BERTRAM M, FUSE K, GORDON R B, GRITSININ A, KAPUR A, KLEE R J, LIFSET R J, MEMON L, RECHBERGER H, SPATARI S, VEXLER D. Multilevel cycle of anthropogenic copper [J]. Environmental Science & Technology, 2004, 38(4): 1242-1252.
[10] MELO M T. Statistical analysis of metal scrap generation: the case of aluminum in Germany [J]. Resources, Conservation and Recycling, 1999, 26: 91-113.
[11] ELSHKAKI A, van der VOET E, van HOLDERBEKE M, TIMMERMANS V. The environmental and economic consequences of the development of lead stocks in the Dutch economics system [J]. Resources, Conservation and Recycling, 2004, 42: 133-154.
[12] BLINDER C, GRAEDEL T E, RECK B. Explanatory variables for per capita stocks and flows of copper and zinc [J]. Journal of Industrial Ecology, 2006, 10(1-2): 111-132.
[13] ROSTKOWSKI K, RAUCH J, DRAKONAKIS K, RECK B, GORDON R B, GRAEDEL T E. ��Bottom-up�� study of in-use nickel stocks in New Haven, CT [J]. Resources, Conservation and Recycling, 2007, 50: 58-70.
[14] DAIGO I, HASHIMOTO S, MATSUNO Y, ADACHI Y. Material stocks and flows accounting for copper and copper-based alloys in Japan [J]. Resources, Conservation and Recycling, 2009, 53: 208-217.
[15] YUE Qiang, LU Zhong-wu. Analysis of contemporary copper cycle in China����STAF�� method [J]. China Resources Comprehensive Utilization, 2005(4): 6-12, 21. (in Chinese)
[16] LOU Y, SHI L. Analyzing iron and aluminum stocks in Handan city in 2005 [J]. Resources Science, 2008, 30(1): 147-152. (in Chinese)
[17] MAO J S, DONG J, GRAEDEL T E. The multilevel cycle of anthropogenic lead II. Results and discussion [J]. Resources, Conservation and Recycling, 2008, 52: 1050-1057.
[18] GUO X Y, ZHONG J Y, SONG Y. Substance flow analysis of zinc in China [J]. Resources, Conservation and Recycling, 2010, 54: 171-177.
[19] BRUNNER P H, RECHBERGER H. Practical handbook of material flow analysis [M]. Boca Raton: Lewis Publishers, 2004: 62-63.
[20] YUE Q, LU Z W, ZHI S K. Copper cycle in China and its entropy analysis [J]. Resources, Conservation and Recycling, 2009, 53: 680-687.
[21] YUE Qiang, WANG He-ming, LU Zhong-wu. Aluminum flow analysis based on average service life of aluminum products in China [J]. Journal of Northeastern University: Natural Science, 2010, 31(9): 1304-1308. (in Chinese)
[22] ZHANG Jiang-hui. Studying on zinc cycle and regeneration index of depreciated zinc products in China [D]. Shenyang: Northeastern University, 2007. (in Chinese)
[23] KLEIJN R, HUELE R, VOET E. Dynamic substance flow analysis: The delaying mechanism of stocks, with the case of PVC in Sweden [J]. Ecological Economics, 2000, 32: 241-254.
�� ǿ1��������1, 2��½����1
1. ������ѧ ���һ���������̬��ҵ�ص�ʵ���ң�����110819��
2. �ձ����������о��� ѭ����ἰ���������������ģ����� 305-8506, �ձ�
ժ Ҫ������������������һ���̶��Ͼ����ɹ����յĶ�����Դ�������������˽������������ķ���������Top-down�������������������������ͣ����������ֲ��䡢������ָ���仯�����������Ա仯���Խ��������������ɻ����ʺ�ƽ�������Ӱ�졣�ڴ˻����ϣ����ҹ�2006��2009�������ͭ���������������˷������õ����·�����������ڼ�������ͭ������������������2009��ʱ�ֱ�ﵽ��8890��t��5140��t��ƽ���ɻ����ʷֱ�Ϊ1.45%��0.30%��ƽ������ֱ�Ϊ4.65 a��6.89 a������δ���ҹ�����ͭ���������ٵĽ��ͣ�����ͭ���������Ŀɻ����ʺ�ƽ�����佫������������
�ؼ��ʣ�����������������Դ��ƽ��ʹ����������ѭ���ʣ�ƽ������
(Edited by YUAN Sai-qian)
Foundation item: Project (71003018) supported by the National Natural Science Foundation of China; Project (N110402003) supported by the Fundamental Research Funds for the Central Universities, China
Corresponding author: YUE Qiang; Tel: +86-24-83672218; E-mail: yueq@smm.neu.edu.cn
DOI: 10.1016/S1003-6326(11)61382-4

