Numerical simulation of high temperature air combustion in aluminum hydroxide gas suspension calcinations
来源期刊:中国有色金属学报(英文版)2009年第1期
论文作者:刘代飞 丁凤其 张红亮 郑文波
文章页码:259 - 266
Key words:aluminum hydroxide; gas suspension calcinations; high temperature air combustion; numerical simulation; FLUENT software
Abstract: The high temperature air combustion(HiTAC) process in gas suspension calcinations(GSC) was studied by using a CFD software FLUENT that can simulate the three-dimensional physical model of GSC with the k-epsilon turbulent viscous model, PDF non-premixed combustion species model, P1 radiation model, thermal and prompt NO pollution model. The simulation vividly describes the distributions of the temperature, velocity and consistency fields. Finally, the optimal operation conditions and igniter configuration of particular fuel combustion are obtained by analyzing and comparing the simulation results. And the emission quantity of NOx, CO and CO2 deduced from computation can play a role as reference. These optimal and estimated values are beneficial to practical operation.
基金信息:the National Natural Science Foundation of China

LIU Dai-fei(刘代飞)1, DING Feng-qi(丁凤其)1, ZHANG Hong-liang(张红亮)1, ZHENG Wen-bo(郑文波)2
1. School of Metallurgical Science and Engineering, Central South University, Changsha 410083, China;
2. Hunan CSU Yeshine Science and Technology Development Co., Ltd, Changsha 410100, China
Received 4 December 2007; accepted 16 September 2008
Abstract: The high temperature air combustion(HiTAC) process in gas suspension calcinations(GSC) was studied by using a CFD software FLUENT that can simulate the three-dimensional physical model of GSC with the k-epsilon turbulent viscous model, PDF non-premixed combustion species model, P1 radiation model, thermal and prompt NO pollution model. The simulation vividly describes the distributions of the temperature, velocity and consistency fields. Finally, the optimal operation conditions and igniter configuration of particular fuel combustion are obtained by analyzing and comparing the simulation results. And the emission quantity of NOx, CO and CO2 deduced from computation can play a role as reference. These optimal and estimated values are beneficial to practical operation.
Key words: aluminum hydroxide; gas suspension calcinations; high temperature air combustion; numerical simulation; FLUENT software
1 Introduction
In the alumina production it is always the primary role to establish a stable heat system, increasing the thermal efficiency, decreasing the fuel consumption and reducing the exhaust emission. The roasting energy consumption takes up about 10% of the whole energy used in the alumina production[1]. Besides, if temperature decreases by 100 ℃, about 3% energy could be saved in terms of high quality[2]. Therefore, adopting efficient combustion technology is beneficial to saving energy. The high temperature air combustion (HiTAC) technology was put forward by TANAKA et al[3], and this kind of novel combustion technology can both save energy and reduce the exhaust emission of NOx[4-6]. The operational pattern in terms of the magnitude and mode of fuel and air[7-13], and the structure of furnace are crucial in HiTAC technology[14-17]. Compared with the kiln, the gas suspension calculation (GSC) has remarkable effect on energy-saving, which promotes its broad application in aluminum hydroxide roasting process. However, the investigation of optimal operational condition for roasting was quite in shortage[18], and the combustion process and gas-particle behaviours were few reported. In order to realize reasonable and highly efficient combustion process and obtain the optimal operational condition, the physical field of combustion and behaviours of gas-particle phase were studied by using a CFD software FLUENT in this study.
2 Physical model of gas suspension calcinations
The roasting furnace in a certain alumina plant is considered as the simulation subject. The physical structure is shown in Fig.1. There are four sections in the furnace: bottom combustion room (d 800 mm×1 400 mm), middle conical room, top calcinations room(d 2 160 mm×8 380 mm ) and its tangential smoke outlet. The chemistry composition of fuel is as follows (volume fraction): CH4 84%, C2H6 7%, H2 0.8%, CO 0.2%, N2 8%. Three altitude surfaces have been established, i.e. feeding inlet, V08 igniter (the primary fuel and air) and V19 igniter (the secondary fuel whose pipe is d 80 mm). It is the most important task to optimize calcination parameters embodied as follows: the configuration for feeding inlet, V08 and V19 igniter; the optimal operation conditions for particular fuel, air and igniters.
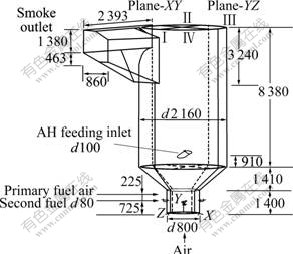
Fig.1 Furnace structure of GSC (unit: mm)
3 Mathematic models and solutions
3.1 Mathematic equations
1) Turbulence models
In turbulent flows, the velocity at a point is considered as a sum of the mean (time averaged) and fluctuating components:
![]() (1)
(1)
Through substituting expression of this form into the basic momentum balance, the time-averaged values and the effect of turbulence incorporated are represented by the Reynolds stress ![]() FLUENT relates the Reynolds stress to mean flow quantities via three turbulence models: k-ε model, RNG k-ε model and Reynolds stress model. Because the standard k-ε model has the desirable properties of robustness and is widely used, the k-ε turbulent viscous model was adopted in this thesis.
FLUENT relates the Reynolds stress to mean flow quantities via three turbulence models: k-ε model, RNG k-ε model and Reynolds stress model. Because the standard k-ε model has the desirable properties of robustness and is widely used, the k-ε turbulent viscous model was adopted in this thesis.
2) Combustion models
In this investigation, the fuel and oxygen were put in combustion room with different flow. Non-premixed combustion species model was adopted[19]. This model supposed that the instantaneous thermal chemistry has relations with mixture fraction f, which is defined as follows:
![]() (2)
(2)
where Zi is mass fraction of element i, ‘ox’ means oxidizer value in inlet, ‘fuel’ means the fuel value in inlet.
In order to compute the PDF at all points in flow, the β-function PDF was chosen. The β-function PDF shape is given by the following function with two parameters, average mixture fraction ![]() and its variance mean square value
and its variance mean square value ![]() :
:
![]() (3)
(3)
where
 (4)
(4)
and
 (5)
(5)
The equilibrium chemistry was used in preprocess prePDF. With this model, the simulation can include the effects of intermediate species and dissociation reactions, producing more realistic predictions of flame temperatures in combustion models.
3) Radiation model
The P-1 radiation model was adopted to simulate heat transfer in combustion. The P-1 radiation model is the simplest case of the more general P-N model, which is based on the expansion of the radiation intensity into an orthogonal series of spherical harmonics[20]. For combustion and complicated geometries, the P-1 model works reasonably well.
4) NOx pollutant model
The product mechanism of NOx in combustion consists of thermal, prompt, and fuel NOx formation. Due to the content of N is low and the NO is up to 95% in combustion, the thermal and prompt NOx was considered[21].
According to the extended Zeldovich mechanism, the net rate of formation of NO is given as follows:
![]()
![]() (6)
(6)
where [NO], [O], [N2], [N], [O2], [OH]and [H] are the concentrations, mol/m3; k1, k2, k3 are the rate constants; and k-1, k-2, k-3 are the corresponding reverse rates.
The prompt NOx formation rate will be approximately equal to the overall prompt NOx formation rate:
![]() (7)
(7)
![]() (8)
(8)
Eα=251.16 kJ/mol (9)
where kpr and Eα are experimental constants, a is the oxygen reaction order, R is the universal gas constant, and p is the pressure. [Fuel] is the concentration of fuel. The rate of prompt NOx formation is found to be of the first order with respect to nitrogen and fuel concentration, but the oxygen reaction order, a, depends on the experimental conditions.
3.2 Boundary conditions
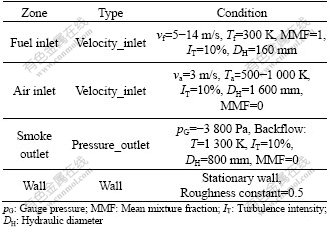
Due to the fact that the most of fuel is provided for V19 combustion, V08 igniter could not be considered in the preliminary simulation and the configuration of V19 was set by simple scheme with four pipes symmetrical layout. The model of combustions furnace was achieved by Gambit. As indicated in Fig.2, with the TGrid method, the meshing model could be obtained with 111 900 mesh nodes and 6 138 697 cells. As va, Ta, vf, Tf mean the velocity of secondary air, the temperature of secondary air, the velocity of secondary fuel, the temperature of secondary fuel respectively, the adopted boundary conditions in simulation are listed in Table 1.
The governing integral equations for the conservation of mass and momentum and for energy and other scalars such as turbulence and chemical species were solved through control-volume-based technique. Pressure and velocity field are computed by Semi-Implicit Method for Pressure-Linked Equations (SIMPLE) algorithms. The convergence criterion for energy equation was that the residual error was less than 10-6, whereas for other governing equations it was 10-3. In this study, all residual errors of the degree of freedom were set by 10-3, which is satisfactory for simulation analysis.
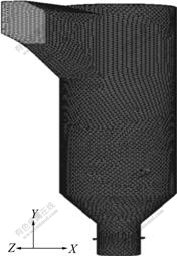
Fig.2 Meshes of GSC
Table 1 Boundary conditions
4 Results and analysis
4.1 Characteristic of combustion
Operational conditions adopted in this study are as follows: va=3 m/s, Ta=500 K and Tf=300 K. When vf=5- 14 m/s, the state of combustion would be simulated. The evaluate indexes of smoke under various vf are shown in Fig.3. Several conclusions can be achieved from it.
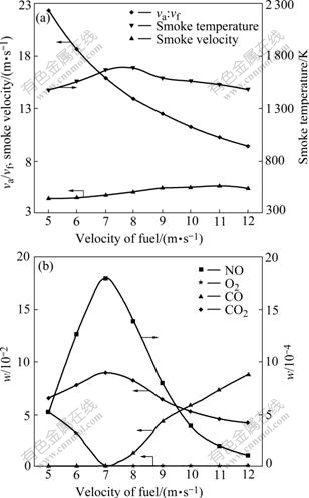
Fig.3 Simulation results of combustion (va=3 m/s, Ta=500 K, Tf=300 K)
1) When va is constant, as vf becomes larger, the function of the ratio of va to vf (va/vf) belongs to monotonic decreasing function. The velocity of outlet air belongs to monotonic increasing function.
2) Combustion temperature, mass fraction of NOx and mole fraction of CO2 show the similar tendency of change, all of which belong to single peak curve. At the point vf=8 m/s (va/vf=14.2), the temperature reaches peak value. The mass fraction of NOx and mole fraction of CO2 have maximum at vf=7 m/s (va/vf=16).
3) When vf>7 m/s (va/vf<16), the mole fraction of CO becomes monotonic increasing. This means that the change trend of CO is in reverse with NOx and CO2.
In order to reveal the state of combustion, two orthogonal axes surfaces were set in GSC, as shown in Fig.1, plane-XY and plane-YZ, which separated the combustion room intoⅠ, Ⅱ, Ⅲ, and Ⅳ.
The simulation results of condition va=3 m/s, vf=5 m/s, vf=9 m/s, and vf=14 m/s are displayed in Fig.4. Findings from this figure are:
1) When the fuel flux is small, as shown in Fig.4(a), the combustion is achieved in high oxygen. In plane-ZY, the higher temperature region appears near walls of top cone due to the influence of large velocity of center flow on the smoke. On the side of smoke outlet, the temperature in plane-ZY is lower than that in plane-XY. The whole temperature distribution is: TⅡ>TⅠ>TⅢ>TⅣ.
2) When the fuel flux is suitable, as shown in Fig.4(b), the complete combustion gradually becomes low oxygen combustion, which makes the high temperature filled in the room. On the side of smoke outlet, the temperature in plane-ZY is higher than that in plane-XY. The whole temperature distributing is: TⅣ>TⅢ>TⅠ>TⅡ.
3) When the fuel flux is larger, as shown in Fig.4(c), the low oxygen leads to incomplete combustion. The temperature distribution presents uniform and the highest temperature appears on the side of smoke outlet.
The operation of GSC in the optimal va/vf is beneficial to energy-saving, reducing consumption and stabilizing heat system. The temperature (1 450 K) required in roasting and exhaust emission could be adopted as the criterion of ascertaining va/vf. Through comparing simulation results with various va/vf, the reasonable va/vf value would be obtained. Form Fig.3, we can know that the range, vf=9-10 m/s, is satisfactory for the requirement with the two criterion indexes. In addition, the process that dust separated from the smoke is achieved through the electrostatic cleaner, which requires the low emission of CO. Hereby, the optimal va/vf would be obtained, namely 12.6, and the corresponding operational conditions are that va is 3 m/s, vf is 9 m/s.
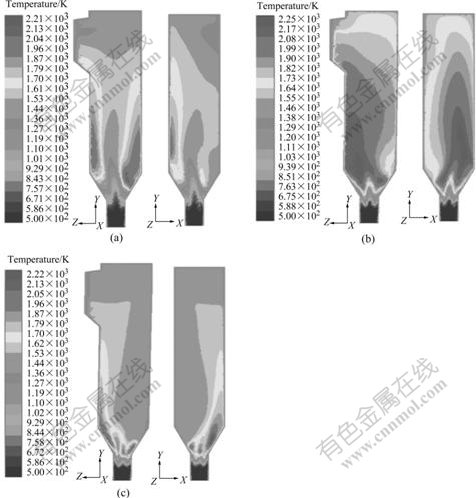
Fig.4 Distribution of temperature: (a) va= 3 m/s, vf=5 m/s; (b) va=3 m/s, vf=9 m/s; (c) va= 3 m/s, vf=14 m/s
4.2 Configuration of feeding inlet
The velocity field has direct relation with the behavior of particles in GSC. And the residence time of particle is not only the macro display of velocity distribution but also the primary requirement for good product quality. In order to reveal the behavior of particle, the range of particle diameter, d=45-100 μm, is selected and three release regions are set at each field of section Y=3 720 mm, which is shown in Fig.5
The simulation results reveal that the behavior of particle is similar in the two kinds of operational condition, which are va=3 m/s, vf=9 m/s and va=5 m/s, vf=15 m/s. In part Ⅰand Ⅱ, the particle presents recycle volution that prolongs the residence time. And for feeding inlet set in parts Ⅲ and Ⅳ, the particle exits directly from smoke outlet with air flow. The average residence time of particle at different release positions are as follows: when va is 3 m/s, tⅡ is 24 s, tⅠ is 10 s, tⅢ is 6 s and tⅣ is 4 s; when va is 5 m/s, tⅡ is 6 s, tⅠ is 4 s, tⅢ is 5 s and tⅣ is 2 s. Accordingly, we can deduce that the reasonable feeding inlet position is part Ⅳ. Fig.1 shows that if a point is inlet the feeding particles would finally locate in region A and if b then B, c then C, as the feeding pipe combines with combustion room with some obliquity. If va is or lager than 5 m/s, the residence time of particle would be less than the roasting time (1.4 s), which means that the adjusting range for va is very narrow. The optimal particle inlet may be region B, which can enlarge the adjusting range of va and particle would fall in high temperature region.
4.3 Configuration of V08 and V19 igniter
According to the temperature distribution, there are two considered positions for V08 igniter, A and B fixing points, as shown in Fig.6(a). To find out the physical field, the two igniter fixing schemes have been simulated.
The simulation results are described as follows: when the secondary air is small, the temperature peak appears in the region opposite to V08 igniter, namely, if setting igniter is at A, the temperature in part II is higher, whereas for setting igniter at B, the temperature in part Ⅳ is higher. The result is presented in Fig.6(b). When the secondary air becomes large, the temperature peak appears on the same side with V08 igniter, namely, setting igniter at A, then the temperature in part Ⅳ is higher, whereas for setting igniter at B, the temperature in part Ⅱ is higher, as shown in Fig.6(c). From above results, we can deduce that the optimal fix point is B. Because at the first stage of combustion and feeding, most of the heat is provided by V08 igniter and the secondary air is not large, the local highest temperature in part Ⅱ matches with the feeding fixed above A, which is beneficial to temperature uniformity in GSC. Furthermore, on the calcinations stage, the secondary air is large and V19 igniter is started, the heat provided by V08 igniter can supply for lower temperature region in part Ⅱ.
In terms of V19 monolayer igniter, the two kinds of fixing schemes, which are shown in Fig.6(a), have similar temperature distribution. According to the symmetry principle, there are many configuration schemes that can be decided with the layer number, calcinations yield and fuel caloric and so on.
4.4 Characteristic of air condition
4.4.1 Oxygen content distribution
One of the remarkable characteristics of roasting combustion is: the minuteness molecule group of air and fuel present prompt reaction and diffuse burning in the combustion room which has high temperature and low oxygen atmosphere[22]. With the operational conditions in va=3 m/s and vf=9 m/s, the air oxygen content distribution in combustion section was analyzed. The mole fraction of oxygen in Y orientation of GSC is shown in Fig.7. We can see that four fuel flows are put in combustion room at section surface of Y=750 mm and the oxygen content presents symmetrical distribution. With the airflow ascending, the oxygen content gradually descends in combustion section. In the mostly combustion section, the oxygen content is about 6%. Above section surface of Y=2 600 mm, the main flame becomes partial to Ⅳ due to the tangent outlet of smoke flow in volume Ⅱ.
4.4.2 Air preheating condition
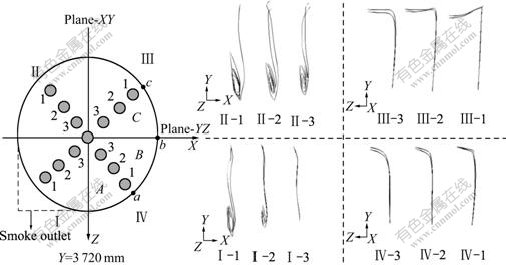
Fig.5 Particle tracks (va=5 m/s, vf=15 m/s)
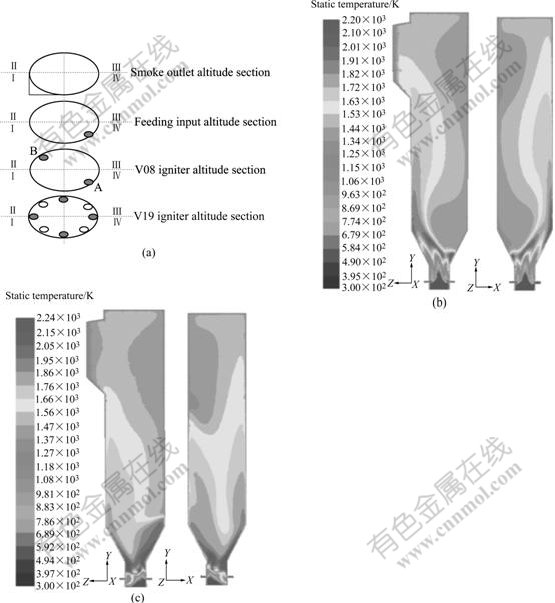
Fig.6 Layout scheme for V08 and V19 igniters (a), temperature distribution (b) (V08 is fixed at B, vf08=10 m/s, vf19=0 m/s, va=1 m/s) and temperature distribution (c) (V08 is fixed at B, vf08=10 m/s, vf19=5 m/s, va=1.67 m/s)
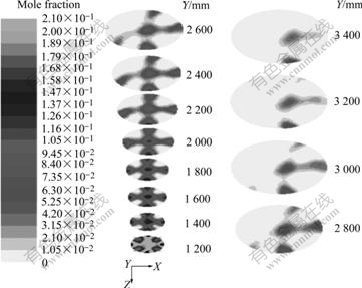
Fig.7 Mole fraction of O2 in Y orientation
By exchanging heat with high temperature Al2O3 production, the inlet air is preheated. And high preheating temperature means the efficiency of heat reuse is enhanced and fuel cost is reduced. As air preheating temperature becomes higher which means that the explicit heat becomes larger, the mass of air and fuel put in combustion room will be reduced, which means the combustion heat is small. However, in terms of total heat, it still can reach the requirement of roasting. In practice production, the combustion smoke is exhausted by the exhauster machine. To keep yield and quality, the air flux can be adjusted by changing the power of exhauster machine while the temperature has remarkable change.
As temperature is concerned, computing conditions are as follows: va=3 m/s, va/vf=12.6, Ta=500-900 K. The result is listed in Table 2. Several conclusions can be achieved from Table 2.
1) Enhancing the preheat temperature is beneficial to saving fuel. When Ta=500-700 K, the mass of fuel drops remarkably, the effect on Ta=700-900 K is not remarkable.
2) Rule of exhaust emission is: with the temperature increasing, emission of NOx increases, whereas, emission of CO and CO2 is not remarkably changed. The concentration of NOx in the plane-XY and plane-YX is shown in Fig.8. Most of NOx appears in part Ⅳand the local highest concentration of NOx is increased remarkably in the plane-YZ.
5 Conclusions
1) The FLUENT simulation software was adopted to study the three-dimension complex flow field in GSC. The non-premixed combustion species model, the P-1 radiation model, the thermal energy and the prompt NOx pollution model were chosen. By modeling and computing, the physical field is visualized by the simulation results which provides a measure for inquiring and understanding the microcosmic field in GSC.
Table 2 Simulation results of smoke outlet in GSC
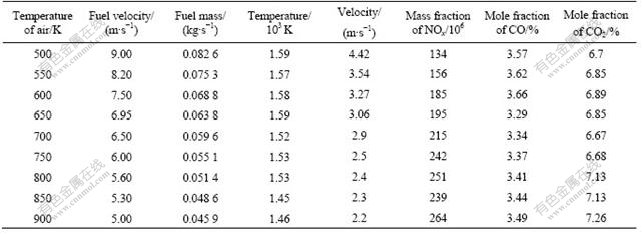
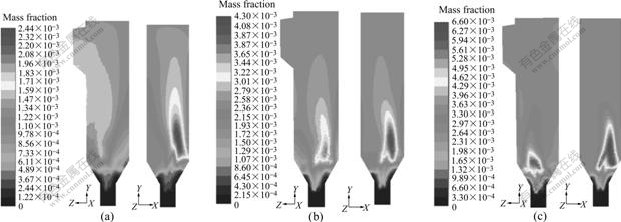
Fig.8 Distribution of NO concentration at different air temperatures: (a) 500 K; (b) 700 K; (c) 900 K
2) By analyzing the simulation results with different operational conditions, the low oxygen complete combustion has a reasonable temperature field distribution among the three states, i.e. the high oxygen complete combustion, the low oxygen complete and incomplete combustion. The optimal feeding inlet position is part Ⅳ and the optimal fixing position for V08 igniter is part Ⅱof GSC. For a certain fuel, the optimal va/vf is 12.6.
3) The low oxygen state is obtained under a certain operational condition in the combustion section. The effect of energy-saving is obvious by enhancing the air preheating temperature. The emission quantity of NOx, CO and CO2 estimated through simulation will be a very good guiding to the production operation when the real emission values cannot be obtained without detector in the actual production.
References
[1] YANG Chong-yu. Process technology of alumina [M]. Beijing: Metallurgy Industry Press, 1994. (in Chinese)
[2] WANG Tian-qing. Practice of lowering gaseous suspension calciner heat consumption coast [J]. Energy Saving of Non-ferrous Metallurgy, 2004, 21(4): 91-94. (in Chinese)
[3] HASEGAWA T, TANAKA R, NIIOKA T. Combustion with high temperature low oxygen air in regenerative burners [C]// Proceedings of the First Asia-Pacific Conference on Combustion. Osaka, Japan: ASPACC, 1997: 290-293.
[4] XIAO Ze-qiang. Statue of research and application on HTAC in Japan & Europe [R]. Changsha: Central South University, 1999. (in Chinese)
[5] YASUDA T, UENO C. Dissemination project of industrial furnace revamped with HTAC [C]// Proceedings of the Second International Seminar on High Temperature Combustion in Industrial Furnace. Stockholm, Sweden, 2000.
[6] QI Hai-ying, LI Yu-hong, YOU Chang-fu, YUAN Jiao, XU Xu-chang. Emission on NOx in high temperature combustion with low oxygen concentration [J]. Journal of Combustion Science and Technology, 2002, 8(1): 17-22. (in Chinese)
[7] WU Guang-liang, ZHU Rong, LI Shi-qi, GUO Han-jie, YANG Xiang, WANG Zheng-zhou. Application of the high temperature air combustion in Chinese metallurgical furnaces [J].Industrial Heating, 2002, 4: 6-10. (in Chinese)
[8] JIANG Shao-jian, AI Yuan-fang, PENG Hao-yi, YANG Wei-hong, ZHOU Jie-min, XIAO Ze-qiang. Methods to obtain atmosphere of high temperature and low oxygen content in furnace [J]. Metallurgical Power, 2000, 4: 1-3. (in Chinese)
[9] DELABROY O, HAILE E, LACAS F, CANDEL S, POLLARD A, SOBIESIAK A, BECKER H A. Passive and active control of NOx in industrial burners [J]. Experimental Thermal and Fluid Science, 1998, 16: 64-75.
[10] RONG H, TOSHIYUKI S, MAKOTO T, TETSUYA H, JUN’ICHI S. Analysis of low NO emission in high temperature air combustion for pulverized coal[J]. Fuel, 2004, 83: 1133-1141.
[11] XU M, AZEVEDO J L T, CARVALHO M G. Modelling of the combustion process and NOx emission in a utility boiler[J]. Fuel, 2000, 79: 1611-1619.
[12] WU Seng-rung, CHANG Wen-chen, CHIAO J. Low NOx heavy fuel oil combustion with high temperature air [J]. Fuel, 2007, 86: 820-828.
[13] YANG W, BLASIAK W. Mathematical modelling of NO emissions from high-temperature air combustion with nitrous oxide mechanism [J]. Fuel Processing Technology, 2005, 86(9): 943-957.
[14] KREMER H, MAY F, WIRTZ S. The influence of furnace design on the NO formation in high temperature processes [J]. Energy Conversion and Management, 2001, 42:1937-1952.
[15] YANG Wei-hong, BLASIAK L. Numerical study of fuel temperature influence on single gas jet combustion in highly preheated and oxygen deficient air [J]. Energy, 2005, 30: 385-398.
[16] KONNOV A A, COLSON G, DE RUYCK J. NO formation rates for hydrogen combustion in stirred reactors [J]. Fuel, 2001, 80: 49-65.
[17] STAIGER B, UNTERBERGER S, BERGER R, KLAUS R G H. Development of an air staging technology to reduce NOx emissions in grate fired boilers[J]. Energy, 2005, 30: 1429-1438.
[18] WEI Huang. The research and analysis of the integral process optimization for the hydro-alumina fluidized calcination [D]. Shenyang: Northeastern University, 2002: 1-40. (in Chinese)
[19] MEI Chi, LI Xin-feng, YIN Zhi-yun, HU Jun. Dynamic simulation of anode baking furnace flue [J]. Journal of Central South University of Technology: Natural Science, 1998, 29(5): 438-411. (in Chinese)
[20] FLUENT I. FLUENT user's guide [R]. Fluent Inc, 1998.
[21] ZHONG Shui-ku, MA Xian-guo, ZHAO Wu-fei, SHUI Xiang-rong. A study of NOx emission mechanism during a high-temperature and low-oxygen combustion process [J]. Journal of Engineering for Thermal Energy and Power, 2004, 19 (5): 483-486. (in Chinese)
[22] WANG Zheng-min. The thermal energy engineering law of combustion in the state of high temperature and low tense of oxygen and its enlarging application [J]. Metallurgical Energy, 2003, 22(2): 24-29. (in Chinese)
Foundation item: Project (60634020) supported by the National Natural Science Foundation of China
Corresponding author: LIU Dai-fei; Tel: +86-731-2790787; E-mail: dfcanfly@tom.com
DOI: 10.1016/S1003-6326(08)60262-9
(Edited by LI Xiang-qun)

