Abstract: The potential fluctuations observed under current control during gas evolution were analyzed by statistic histogram and FFT spectral analysis. Potential fluctuation signals were processed by means of program coded with MatLab and its signal processing toolbox. Calculated power spectral densities (PSDs) were used to analyze bubble behaviors occurring at a platinum disk microelectrode of 100um and 1 mm in diameter during galvanostatic polarization. Some characteristic parameters of the gas evolution, such as the average number of detached bubbles per time unit, the average radius of detached bubble and the mean volume of bubble, were derived from measured PSD of potential fluctuation. The results show that useful information related to bubble behaviors on interface of electrode/electrolyte can be obtained by histogram and FFT spectral analysis, which can be applied to investigate the electrolytic bubble occurring within electrochemical reactor.
Spectral analysis of potential fluctuations on electrolytic gas evolution
Abstract:
The potential fluctuations observed under current control during gas evolution were analyzed by statistic histogram and FFT spectral analysis. Potential fluctuation signals were processed by means of program coded with MatLab and its signal processing toolbox. Calculated power spectral densities (PSDs) were used to analyze bubble behaviors occurring at a platinum disk microelectrode of 100um and 1 mm in diameter during galvanostatic polarization. Some characteristic parameters of the gas evolution, such as the average number of detached bubbles per time unit, the average radius of detached bubble and the mean volume of bubble, were derived from measured PSD of potential fluctuation. The results show that useful information related to bubble behaviors on interface of electrode/electrolyte can be obtained by histogram and FFT spectral analysis, which can be applied to investigate the electrolytic bubble occurring within electrochemical reactor.
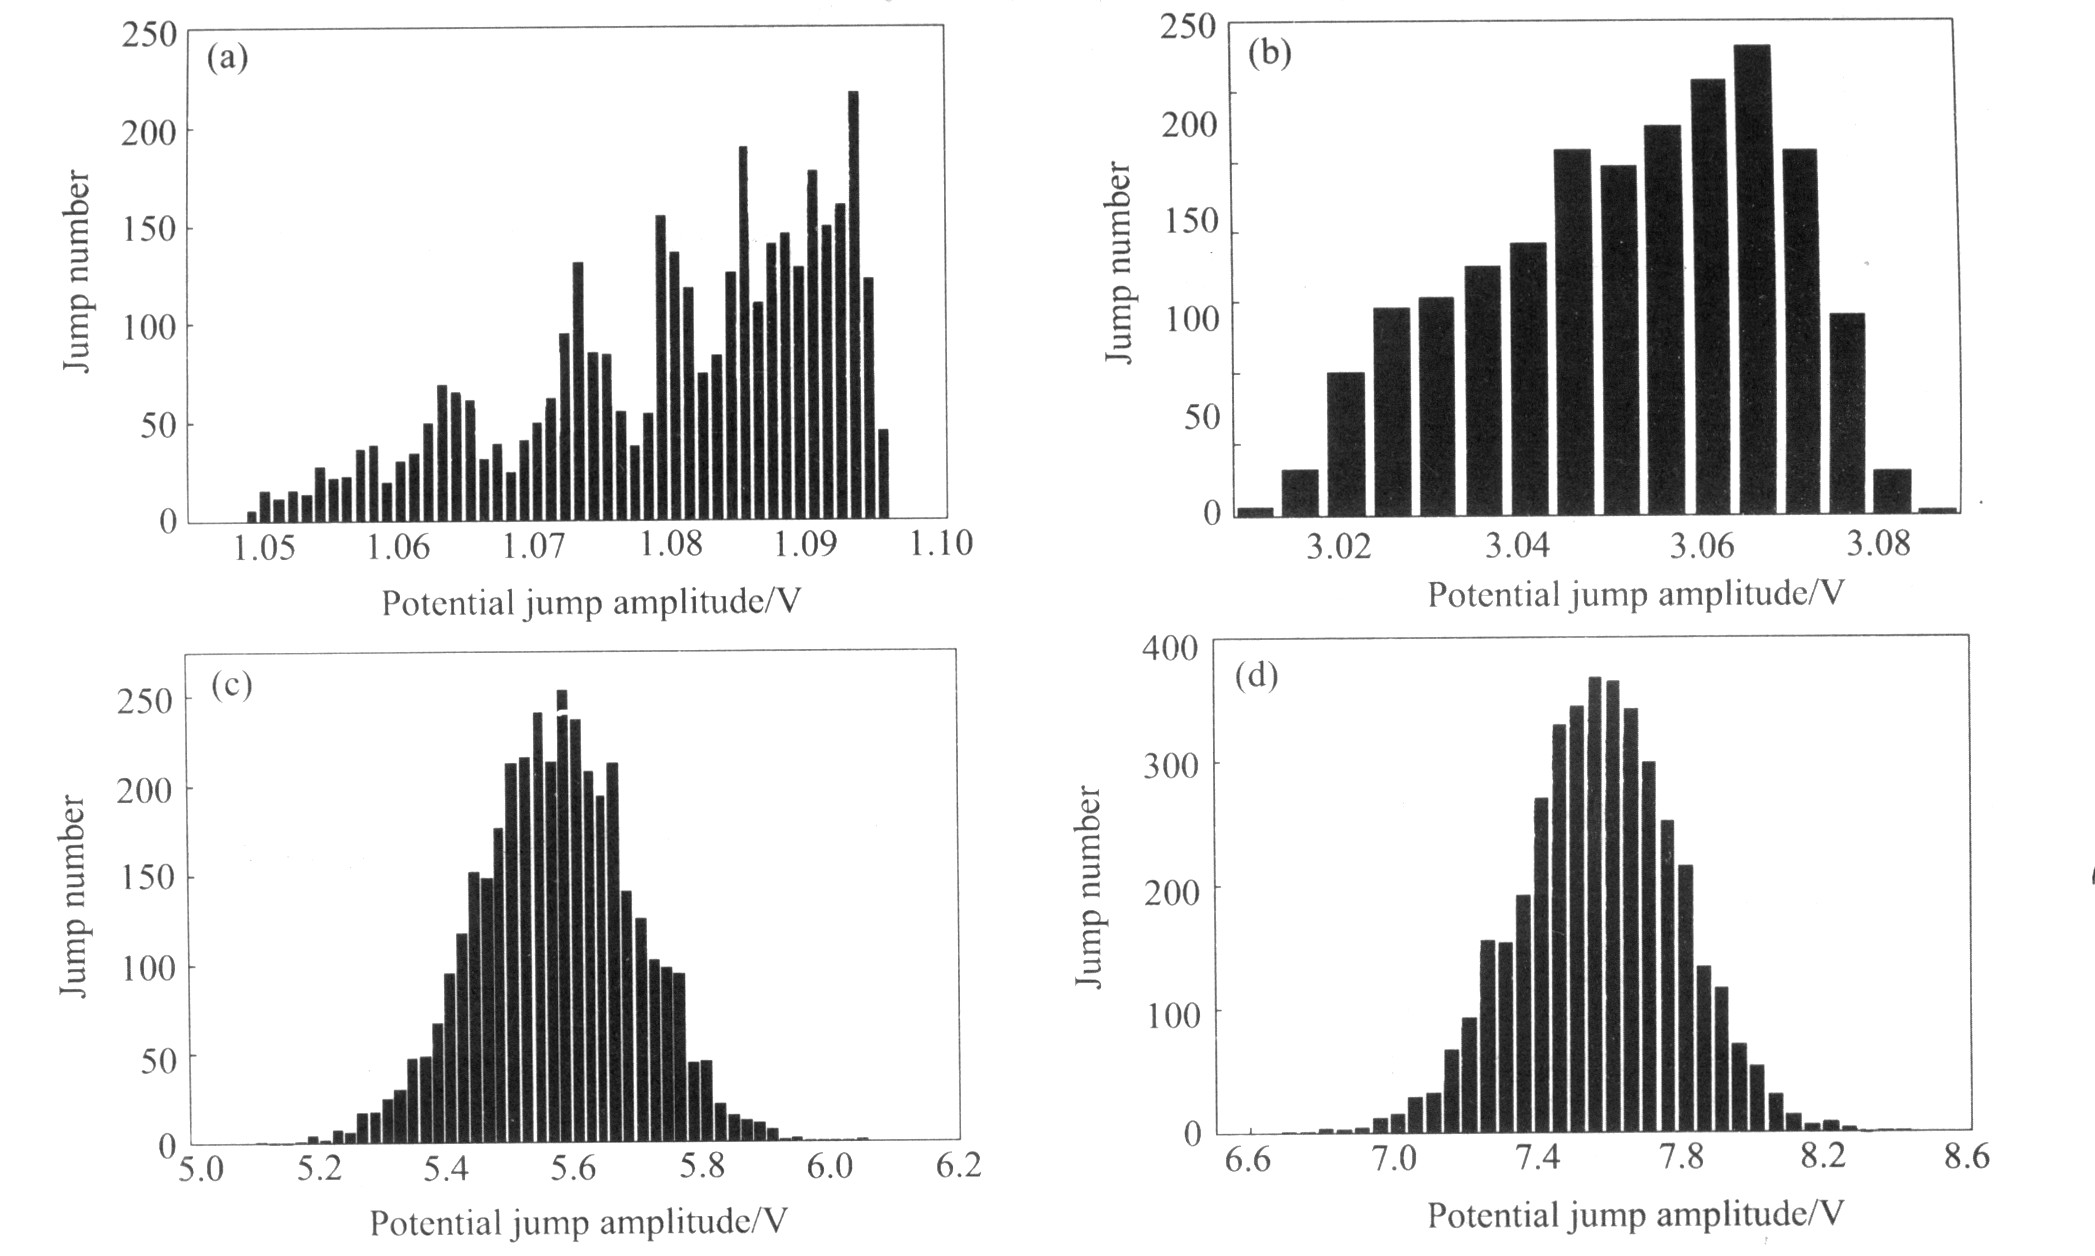
Fig.1 Histogram of potential jumps on 1 mm Pt disk electrode with L type structure at different currents (a)―I=100 μA; (b)―I=5 mA; (c)―I=50 mA; (d)―I=100 mA
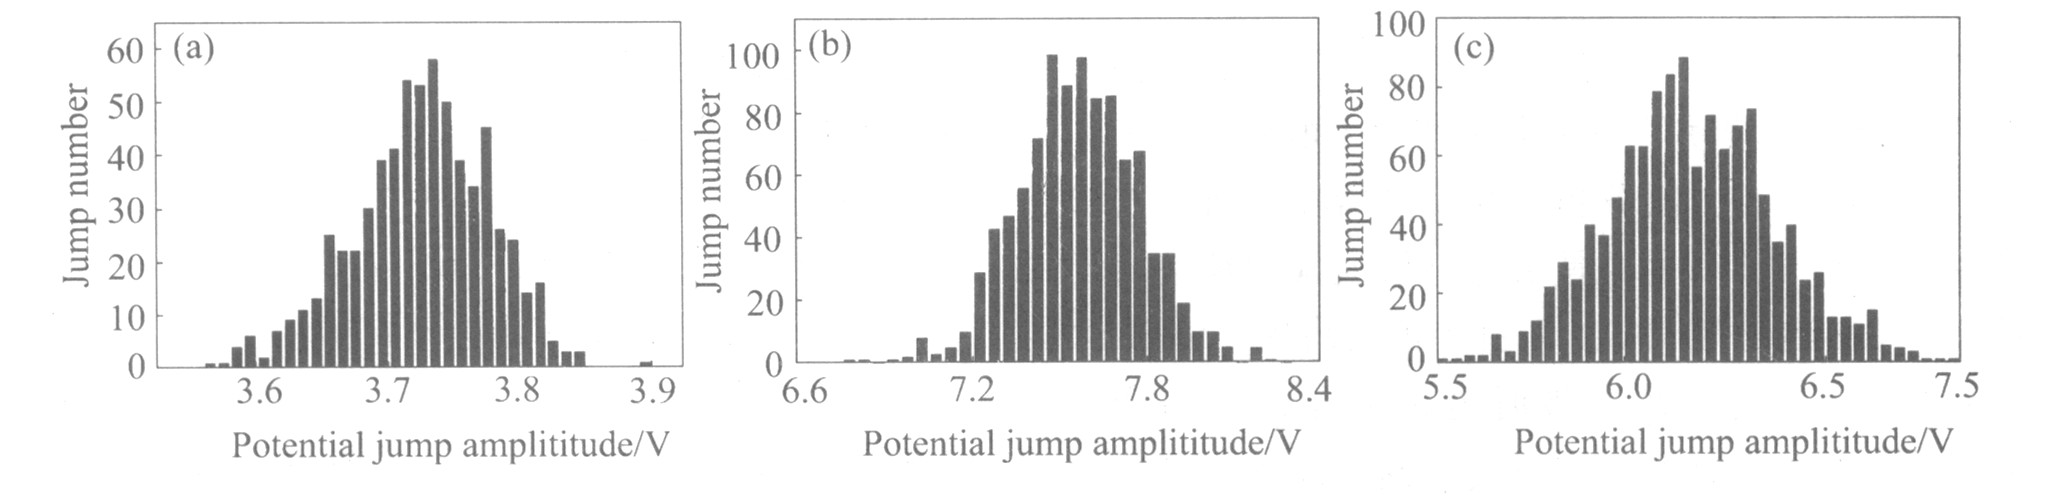
图2 不同电流时电位波动直方图
Fig.2 Histogram of potential jump at different currents (Pt disk microelectrode with diameter of 100 μm, downward) (a)―I=1 mA; (b)―I=2.5 mA; (c)―I=5 mA
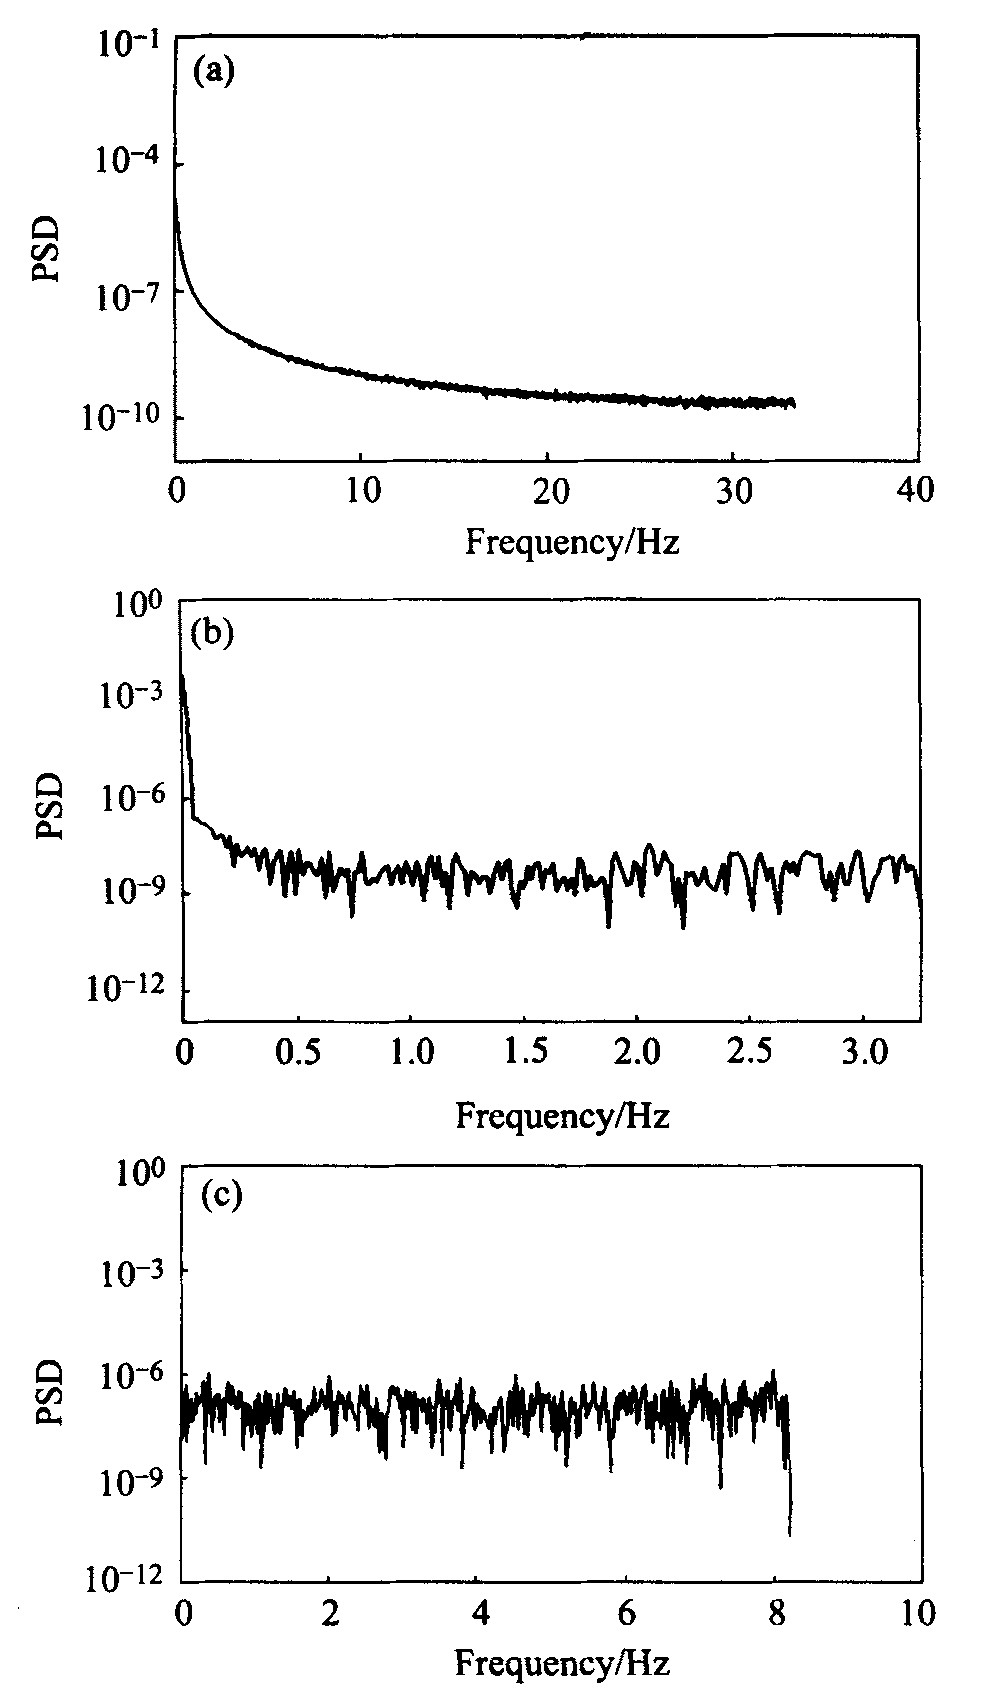
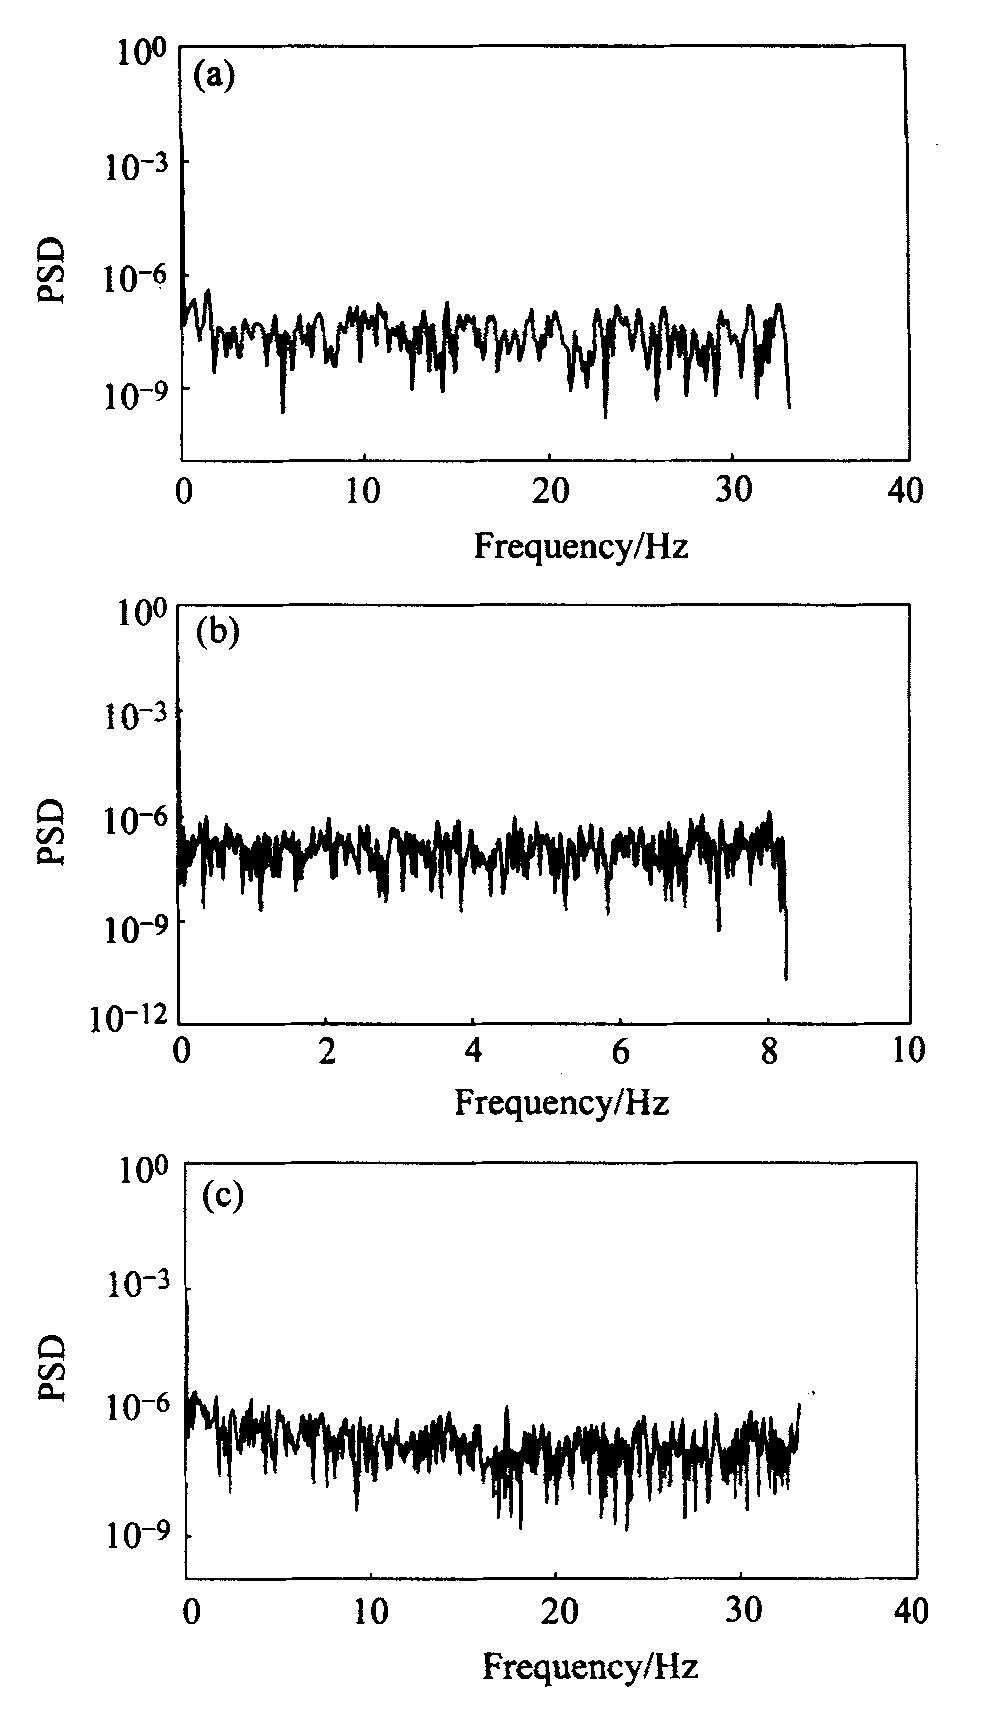
图3 直径1mm的L型结构Pt盘电极的 电位波动功率谱密度分析
Fig.3 Power spectrum analysis of potential jumps on 1mm Pt disk electrode with L type structure at different currents (a)―5 mA; (b)―50 mA; (c)―100 mA